Intuit Inc. and The Trade Desk, Inc. are two influential players in the software application industry, each driving innovation in distinct yet overlapping market segments. Intuit specializes in financial management solutions for small businesses and consumers, while The Trade Desk excels in data-driven digital advertising platforms. This comparison highlights their strategic approaches and market potential, helping you decide which company could be the most promising addition to your investment portfolio.
Table of contents
Companies Overview
I will begin the comparison between Intuit Inc. and The Trade Desk, Inc. by providing an overview of these two companies and their main differences.
Intuit Inc. Overview
Intuit Inc. is a financial software company focused on providing financial management and compliance products for consumers, small businesses, self-employed individuals, and accounting professionals. Operating globally, Intuit’s offerings include QuickBooks, TurboTax, Credit Karma, and ProConnect segments, serving a broad market with cloud-based and desktop solutions, payroll services, and personal finance tools. The company is headquartered in Mountain View, California.
The Trade Desk, Inc. Overview
The Trade Desk, Inc. is a technology company specializing in a self-service, cloud-based platform for managing digital advertising campaigns across various formats and devices. It serves advertising agencies and service providers by offering data-driven solutions and value-added services. Founded in 2009 and headquartered in Ventura, California, The Trade Desk operates internationally with a focus on programmatic advertising.
Key similarities and differences
Both Intuit and The Trade Desk operate in the software application industry within the technology sector and serve international markets. However, Intuit focuses on financial management software and services targeting consumers and small businesses, while The Trade Desk concentrates on digital advertising technology for agencies. Intuit’s business model centers on compliance and financial tools, whereas The Trade Desk emphasizes data-driven advertising campaign management.
Income Statement Comparison
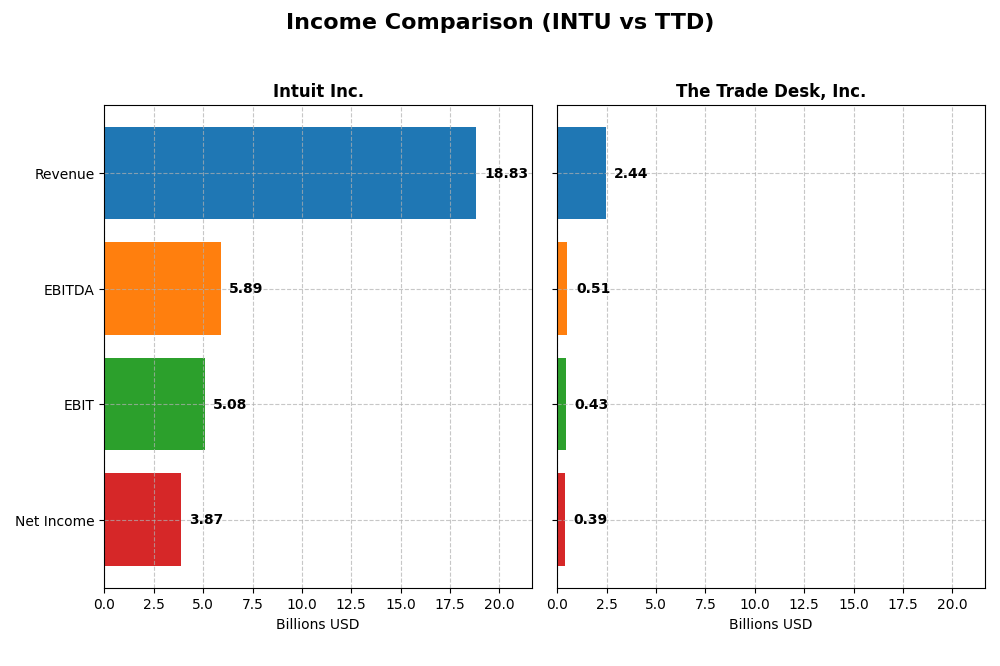
The following table presents a side-by-side comparison of key income statement metrics for Intuit Inc. and The Trade Desk, Inc. based on their most recent fiscal year results.
| Metric | Intuit Inc. (INTU) | The Trade Desk, Inc. (TTD) |
|---|---|---|
| Market Cap | 151.5B | 17.3B |
| Revenue | 18.83B | 2.44B |
| EBITDA | 5.89B | 515M |
| EBIT | 5.08B | 427M |
| Net Income | 3.87B | 393M |
| EPS | 13.82 | 0.80 |
| Fiscal Year | 2025 | 2024 |
Income Statement Interpretations
Intuit Inc.
Intuit Inc. demonstrated strong growth from 2021 to 2025, with revenue nearly doubling from 9.63B to 18.83B and net income rising from 2.06B to 3.87B. Margins remained robust, with a gross margin around 80.76% and net margin improving to 20.55%. In 2025, revenue growth slowed slightly to 15.63%, but EBIT margin and EPS saw significant improvement, reflecting operational efficiency.
The Trade Desk, Inc.
The Trade Desk experienced rapid revenue growth from 836M in 2020 to 2.44B in 2024, nearly tripling over the period. Net income also increased substantially from 242M to 393M, accompanied by a gross margin of 80.69% and a net margin of 16.08%. The 2024 fiscal year showed strong momentum with revenue up 25.63% and EBIT more than doubling, indicating accelerating profitability despite a declining net margin trend overall.
Which one has the stronger fundamentals?
Both companies show favorable income statement evaluations, with Intuit having a higher net margin (20.55% vs. 16.08%) and more stable margin trends. The Trade Desk exhibits faster revenue and EBIT growth, but a more volatile net margin. Intuit’s larger scale and consistent profitability contrast with The Trade Desk’s rapid expansion and margin compression, presenting two distinct fundamental profiles.
Financial Ratios Comparison
The table below presents the most recent financial ratios for Intuit Inc. and The Trade Desk, Inc., reflecting their fiscal year 2025 and 2024 performance respectively.
| Ratios | Intuit Inc. (2025) | The Trade Desk, Inc. (2024) |
|---|---|---|
| ROE | 19.6% | 13.3% |
| ROIC | 14.8% | 10.0% |
| P/E | 56.8 | 146.8 |
| P/B | 11.2 | 19.6 |
| Current Ratio | 1.36 | 1.86 |
| Quick Ratio | 1.36 | 1.86 |
| D/E (Debt-to-Equity) | 0.34 | 0.11 |
| Debt-to-Assets | 18.0% | 5.1% |
| Interest Coverage | 19.9 | 0 |
| Asset Turnover | 0.51 | 0.40 |
| Fixed Asset Turnover | 12.5 | 5.2 |
| Payout Ratio | 30.7% | 0% |
| Dividend Yield | 0.54% | 0% |
Interpretation of the Ratios
Intuit Inc.
Intuit shows mostly favorable ratios, with strong net margin (20.55%) and return on equity (19.63%). Its debt levels and interest coverage are solid, supporting financial stability. However, valuation ratios like P/E (56.82) and P/B (11.15) are high, posing potential concerns. The dividend yield is low at 0.54%, indicating modest shareholder returns.
The Trade Desk, Inc.
The Trade Desk has favorable profitability metrics, such as a 16.08% net margin and 10.02% ROIC, alongside a strong current ratio of 1.86. Its valuation is stretched, with a P/E of 146.77 and P/B of 19.56. The company does not pay dividends, likely focusing on growth and reinvestment, with no dividend yield reported.
Which one has the best ratios?
Both companies present favorable overall ratios, but Intuit’s stronger returns on equity and capital, coupled with better debt management, contrast with The Trade Desk’s stretched valuation and weaker asset turnover. Intuit also offers some dividend income, whereas The Trade Desk prioritizes growth, reflected in its zero dividend yield.
Strategic Positioning
This section compares the strategic positioning of Intuit Inc. and The Trade Desk, Inc., including market position, key segments, and exposure to technological disruption:
Intuit Inc.
- Leading in financial management software with strong competition pressure in software applications.
- Diversified revenue streams: Small Business, Consumer, Credit Karma, and Professional Tax segments drive growth.
- Exposure through cloud-based financial and tax solutions; faces disruption from evolving fintech and digital platforms.
The Trade Desk, Inc.
- Operates in digital advertising technology with competitive pressure from various ad tech platforms.
- Focused on data-driven digital advertising across display, video, audio, native, and social channels.
- Cloud-based ad campaign platform; exposed to rapid technological changes in digital advertising and data analytics.
Intuit Inc. vs The Trade Desk, Inc. Positioning
Intuit presents a diversified business model across multiple financial service segments, offering risk distribution but complexity in managing varied markets. The Trade Desk concentrates on digital advertising technology, enabling focused innovation but with potentially higher vulnerability to market shifts.
Which has the best competitive advantage?
Intuit shows a slightly favorable moat with value creation despite declining ROIC, indicating stronger competitive advantage. The Trade Desk is slightly unfavorable, shedding value with declining profitability, suggesting a weaker moat position.
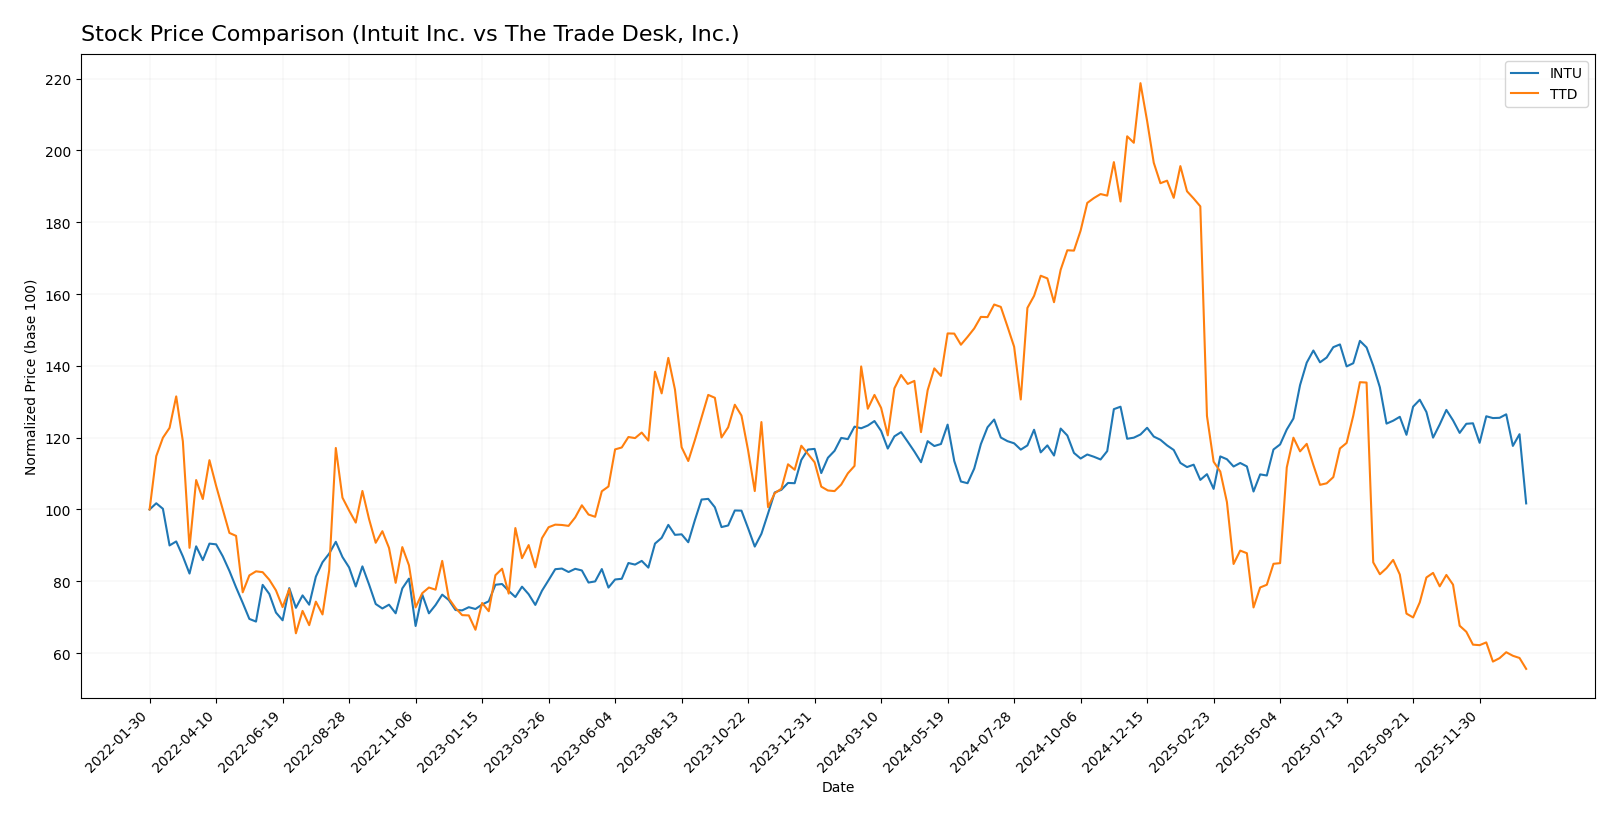
Stock Comparison
The stock prices of Intuit Inc. and The Trade Desk, Inc. have both experienced significant declines over the past year, reflecting bearish trends with notable deceleration in their downward momentum.
Trend Analysis
Intuit Inc. shows a bearish trend with a -17.58% price change over the past 12 months, accompanied by high volatility (std deviation 51.54) and a deceleration in its decline. The stock’s highest and lowest prices were $785.95 and $543.83, respectively.
The Trade Desk, Inc. also exhibits a bearish trend with a sharper -56.58% decline over the same period, lower volatility (std deviation 28.36), and decelerating downward momentum. Its price ranged from a high of $139.11 to a low of $35.36.
Comparing the two, Intuit Inc. has delivered the highest market performance, showing a less severe decline than The Trade Desk, Inc. over the past year.
Target Prices
The current analyst consensus presents a range of target prices for Intuit Inc. and The Trade Desk, Inc.
| Company | Target High | Target Low | Consensus |
|---|---|---|---|
| Intuit Inc. | 880 | 700 | 798.4 |
| The Trade Desk, Inc. | 98 | 39 | 56.73 |
Analysts expect Intuit’s stock price to rise significantly from its current 544.19 USD, indicating strong growth potential. The Trade Desk’s consensus target is moderately above its current price of 35.32 USD, showing cautious optimism.
Analyst Opinions Comparison
This section compares analysts’ ratings and grades for Intuit Inc. and The Trade Desk, Inc.:
Rating Comparison
Intuit Inc. Rating
- Rating: Both have a “B” rating, indicating very favorable analyst sentiment.
- Discounted Cash Flow Score: Intuit scores 4, reflecting favorable valuation prospects.
- ROE Score: Intuit’s ROE score is 4, showing efficient profit generation from equity.
- ROA Score: Intuit leads with 5, a very favorable score for asset utilization.
- Debt To Equity Score: Intuit scores 2, reflecting moderate financial risk.
- Overall Score: Both companies have an overall score of 3, indicating moderate overall financial standing.
The Trade Desk, Inc. Rating
- Rating: Both have a “B” rating, indicating very favorable analyst sentiment.
- Discounted Cash Flow Score: The Trade Desk also scores 4, signaling favorable valuation.
- ROE Score: The Trade Desk matches with a score of 4, indicating similar efficiency.
- ROA Score: The Trade Desk has a 4, a favorable score but slightly below Intuit’s.
- Debt To Equity Score: The Trade Desk scores 3, also moderate but with relatively higher leverage.
- Overall Score: Both companies have an overall score of 3, indicating moderate overall financial standing.
Which one is the best rated?
Both Intuit and The Trade Desk share the same “B” rating and overall score of 3, but Intuit has a slightly better ROA score (5 vs. 4) and a lower debt-to-equity score, suggesting marginally stronger asset efficiency and balance sheet stability.
Scores Comparison
The following table compares the Altman Z-Score and Piotroski Score for Intuit Inc. and The Trade Desk, Inc.:
Intuit Inc. Scores
- Altman Z-Score: 9.35, indicating a safe zone with low bankruptcy risk.
- Piotroski Score: 9, classified as very strong financial health.
The Trade Desk Scores
- Altman Z-Score: 4.30, in the safe zone, showing moderate safety.
- Piotroski Score: 5, reflecting average financial strength.
Which company has the best scores?
Intuit Inc. holds higher scores on both the Altman Z-Score and Piotroski Score, indicating stronger financial health and lower bankruptcy risk compared to The Trade Desk, Inc., based on the provided data.
Grades Comparison
Here is a detailed comparison of the latest grades and ratings for Intuit Inc. and The Trade Desk, Inc.:
Intuit Inc. Grades
The following table summarizes recent grades assigned to Intuit Inc. by reputable grading companies:
| Grading Company | Action | New Grade | Date |
|---|---|---|---|
| Wells Fargo | Downgrade | Equal Weight | 2026-01-08 |
| Wells Fargo | Maintain | Overweight | 2025-11-21 |
| RBC Capital | Maintain | Outperform | 2025-11-21 |
| BMO Capital | Maintain | Outperform | 2025-11-21 |
| Evercore ISI Group | Maintain | Outperform | 2025-11-18 |
| RBC Capital | Maintain | Outperform | 2025-09-02 |
| RBC Capital | Maintain | Outperform | 2025-08-22 |
| UBS | Maintain | Neutral | 2025-08-22 |
| Morgan Stanley | Maintain | Overweight | 2025-08-22 |
| Barclays | Maintain | Overweight | 2025-08-22 |
Intuit’s grades show a consistent pattern of Outperform and Overweight ratings with one recent downgrade to Equal Weight by Wells Fargo.
The Trade Desk, Inc. Grades
Here is a summary of recent grades for The Trade Desk, Inc. from verified grading companies:
| Grading Company | Action | New Grade | Date |
|---|---|---|---|
| Morgan Stanley | Maintain | Equal Weight | 2026-01-13 |
| Wells Fargo | Maintain | Equal Weight | 2026-01-12 |
| Cantor Fitzgerald | Maintain | Neutral | 2026-01-08 |
| Wolfe Research | Maintain | Outperform | 2026-01-06 |
| Guggenheim | Maintain | Buy | 2026-01-05 |
| Jefferies | Maintain | Hold | 2025-12-11 |
| Wedbush | Maintain | Neutral | 2025-12-08 |
| DA Davidson | Maintain | Buy | 2025-11-10 |
| Truist Securities | Maintain | Buy | 2025-11-07 |
| Wells Fargo | Maintain | Equal Weight | 2025-11-07 |
The Trade Desk’s ratings range from Neutral and Equal Weight to Buy and Outperform, suggesting a generally positive but more varied outlook.
Which company has the best grades?
Intuit Inc. has predominantly Outperform and Overweight grades, indicating stronger confidence from analysts compared to The Trade Desk, which shows a mix of Buy, Hold, and Neutral ratings. This suggests investors may perceive Intuit as having more consistent growth potential, while The Trade Desk carries slightly more varied analyst opinions.
Strengths and Weaknesses
Below is a comparison of Intuit Inc. (INTU) and The Trade Desk, Inc. (TTD) based on key financial and strategic criteria as of 2026.
| Criterion | Intuit Inc. (INTU) | The Trade Desk, Inc. (TTD) |
|---|---|---|
| Diversification | Highly diversified with Consumer, Credit Karma, Global Business Solutions, and Professional Tax segments generating $19.1B total revenue in 2025 | Less diversified, primarily focused on advertising technology with limited product segmentation |
| Profitability | Strong profitability: 20.55% net margin, 19.63% ROE, 14.78% ROIC; creating value with ROIC > WACC | Moderate profitability: 16.08% net margin, 13.33% ROE, 10.02% ROIC; currently shedding value with ROIC slightly above WACC but declining |
| Innovation | Steady innovation in financial software and credit services; some decline in ROIC trend suggests challenges in maintaining growth | Innovation in programmatic advertising is key, but declining ROIC and high valuation multiples indicate risk |
| Global presence | Strong global presence especially in business solutions and tax software | Primarily focused on digital advertising markets, with growing but narrower global reach |
| Market Share | Leading position in financial management software and tax preparation | Significant player in programmatic ad buying but faces intense competition and market volatility |
Key takeaways: Intuit offers strong diversification and profitability with a slightly declining profitability trend, indicating some caution. The Trade Desk has solid growth potential but is currently less profitable and faces higher risk due to valuation and declining returns on capital. Investors should weigh Intuit’s stability against The Trade Desk’s growth risks.
Risk Analysis
Below is a comparative table summarizing key risks for Intuit Inc. and The Trade Desk, Inc. as of the most recent fiscal years:
| Metric | Intuit Inc. (INTU) | The Trade Desk, Inc. (TTD) |
|---|---|---|
| Market Risk | Beta 1.254; sensitive to tech sector volatility | Beta 1.105; exposed to advertising market fluctuations |
| Debt level | Moderate debt-to-equity 0.34; debt-to-assets 17.96% | Low debt-to-equity 0.11; debt-to-assets 5.11% |
| Regulatory Risk | Moderate; financial software subject to compliance | Moderate; digital advertising faces evolving privacy laws |
| Operational Risk | Medium; relies on cloud and software updates | Medium; platform uptime and data quality critical |
| Environmental Risk | Low; primarily software business with minimal footprint | Low; digital platform with limited environmental impact |
| Geopolitical Risk | Moderate; global operations subject to trade policies | Moderate; international ad markets impacted by geopolitics |
Intuit’s higher market beta and moderate leverage pose notable risks, while The Trade Desk’s exposure to digital ad regulation and platform reliability is critical. Both companies maintain strong financial health, but regulatory and market volatility remain the most impactful risks to monitor closely.
Which Stock to Choose?
Intuit Inc. (INTU) shows a strong income evolution with 15.63% revenue growth in the last year and favorable profitability metrics, including a 20.55% net margin and 19.63% ROE. The company maintains moderate debt levels and a solid B rating, supported by a slightly favorable MOAT despite a declining ROIC trend.
The Trade Desk, Inc. (TTD) presents robust revenue growth of 25.63% last year and favorable income statement indicators, such as a 16.08% net margin, though its ROE is neutral at 13.33%. It carries low debt and also holds a B rating, but its MOAT is slightly unfavorable due to value erosion and declining ROIC.
Investors seeking stable profitability and value creation might find Intuit’s financial profile more aligned with their goals, while those focused on higher growth potential despite some profitability challenges could view The Trade Desk as more appealing. The final choice could depend on the investor’s risk tolerance and investment strategy.
Disclaimer: Investment carries a risk of loss of initial capital. The past performance is not a reliable indicator of future results. Be sure to understand risks before making an investment decision.
Go Further
I encourage you to read the complete analyses of Intuit Inc. and The Trade Desk, Inc. to enhance your investment decisions: