In today’s dynamic software industry, Intuit Inc. and ServiceTitan, Inc. stand out as key players delivering innovative solutions tailored to business needs. Intuit, a giant in financial management software, competes with ServiceTitan, an emerging leader in field service software, both targeting operational efficiency and growth. This article will explore their strategies, market positions, and potential to guide investors in making an informed choice. Let’s find out which company offers the most compelling investment opportunity.
Table of contents
Companies Overview
I will begin the comparison between Intuit and ServiceTitan by providing an overview of these two companies and their main differences.
Intuit Overview
Intuit Inc. provides financial management and compliance products and services targeting consumers, small businesses, self-employed individuals, and accounting professionals. Operating through four segments—Small Business & Self-Employed, Consumer, Credit Karma, and ProConnect—Intuit offers solutions like QuickBooks, TurboTax, and personal finance platforms. Headquartered in Mountain View, CA, Intuit is a well-established player in the software application industry with a market cap of 152B USD.
ServiceTitan Overview
ServiceTitan, Inc. focuses on software solutions that support field service activities for residential and commercial infrastructure maintenance and installation. Founded in 2008 and based in Glendale, CA, the company leverages technology to streamline service management. With a market cap of 8.5B USD, ServiceTitan is a younger, smaller player in the software application sector but is actively trading on NASDAQ.
Key similarities and differences
Both Intuit and ServiceTitan operate in the technology sector within the software application industry, listed on NASDAQ. Intuit has a broader product portfolio and serves a wide range of financial and accounting needs, while ServiceTitan specializes in field service management software. Intuit’s market cap and employee base are significantly larger, reflecting its established position, compared with ServiceTitan’s more focused niche and smaller scale.
Income Statement Comparison
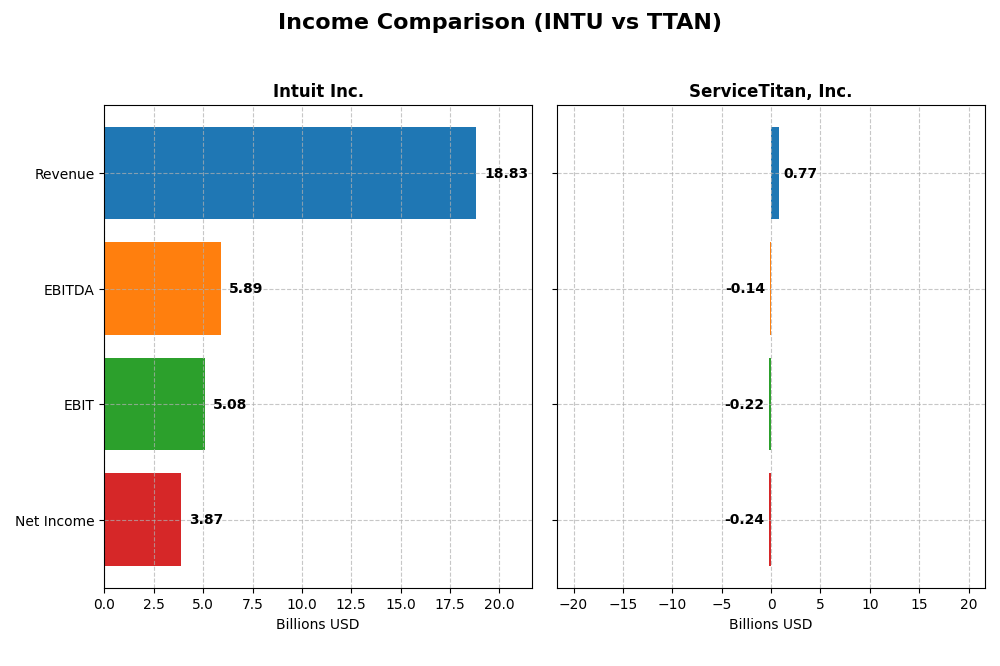
This table compares the key financial metrics of Intuit Inc. and ServiceTitan, Inc. for their most recent fiscal years, highlighting revenue, profitability, and earnings per share.
| Metric | Intuit Inc. (INTU) | ServiceTitan, Inc. (TTAN) |
|---|---|---|
| Market Cap | 152B | 8.5B |
| Revenue | 18.8B | 772M |
| EBITDA | 5.9B | -141M |
| EBIT | 5.1B | -221M |
| Net Income | 3.9B | -239M |
| EPS | 13.82 | -8.53 |
| Fiscal Year | 2025 | 2025 |
Income Statement Interpretations
Intuit Inc.
Intuit Inc. demonstrated strong revenue growth from 2021 to 2025, nearly doubling from $9.63B to $18.83B, with net income rising from $2.06B to $3.87B. Margins remained robust, with a gross margin of 80.76% and a net margin above 20%. The 2025 fiscal year showed accelerated growth in revenue and earnings per share, reflecting improving profitability.
ServiceTitan, Inc.
ServiceTitan’s revenue grew substantially from $468M in 2023 to $772M in 2025, with net income losses narrowing but still negative at -$239M. Gross margin was favorable at 64.9%, but EBIT and net margins remained negative, indicating ongoing operational challenges. The latest year showed a 26% revenue increase, though earnings per share declined significantly.
Which one has the stronger fundamentals?
Intuit exhibits stronger fundamentals, with consistent revenue and net income growth, high and stable margins, and favorable earnings expansion. ServiceTitan shows promising revenue growth but continues to operate at a loss with negative profitability margins. Intuit’s performance reflects better operational efficiency and financial health over the periods analyzed.
Financial Ratios Comparison
Below is a comparison of key financial ratios for Intuit Inc. and ServiceTitan, Inc. for their most recent fiscal years, providing insight into their profitability, liquidity, leverage, and efficiency metrics.
| Ratios | Intuit Inc. (2025) | ServiceTitan, Inc. (2025) |
|---|---|---|
| ROE | 19.6% | -16.4% |
| ROIC | 14.8% | -14.1% |
| P/E | 56.8 | -18.1 |
| P/B | 11.2 | 3.0 |
| Current Ratio | 1.36 | 3.74 |
| Quick Ratio | 1.36 | 3.74 |
| D/E (Debt to Equity) | 0.34 | 0.11 |
| Debt-to-Assets | 18.0% | 9.4% |
| Interest Coverage | 19.9 | -14.8 |
| Asset Turnover | 0.51 | 0.44 |
| Fixed Asset Turnover | 12.5 | 9.6 |
| Payout ratio | 30.7% | 0% |
| Dividend yield | 0.54% | 0% |
Interpretation of the Ratios
Intuit Inc.
Intuit’s financial ratios largely indicate strength, with favorable net margin of 20.55%, ROE at 19.63%, and ROIC near 14.78%. However, elevated valuation multiples such as a PE of 56.82 and PB of 11.15 suggest potential overvaluation risks. The company pays dividends, but a low yield of 0.54% and moderate payout ratio imply conservative shareholder returns, supported by strong free cash flow coverage.
ServiceTitan, Inc.
ServiceTitan displays weak profitability ratios, including a negative net margin of -30.98% and ROE of -16.44%, reflecting operational challenges. Its favorable WACC at 4.9% and low debt levels contrast with an unfavorable interest coverage ratio of -14.26. The company does not pay dividends, consistent with its negative earnings and focus on growth and reinvestment, which explains the absence of shareholder distributions.
Which one has the best ratios?
Considering the evaluations, Intuit presents a more favorable ratio profile, with majority positive metrics reflecting operational efficiency and profitability. ServiceTitan’s ratios reveal financial stress, with significant unfavorable indicators tied to losses and cash flow issues. Thus, Intuit holds the advantage in ratio quality based on the provided data.
Strategic Positioning
This section compares the strategic positioning of Intuit Inc. and ServiceTitan, Inc., focusing on market position, key segments, and exposure to technological disruption:
Intuit Inc.
- Leading software application provider with $152B market cap and competitive pressure from established tech firms.
- Diverse business segments including Small Business, Consumer, Credit Karma, and Professional Tax products.
- Operates in cloud and desktop financial management software, potentially exposed to ongoing tech innovations.
ServiceTitan, Inc.
- Smaller player with $8.5B market cap, facing competitive pressure in field service software niche.
- Concentrated focus on field service platform and subscription revenues.
- Focus on field service infrastructure management; technological disruption risk not explicitly detailed.
Intuit Inc. vs ServiceTitan, Inc. Positioning
Intuit shows a diversified portfolio across financial management and tax software, offering broad market coverage but potential complexity. ServiceTitan focuses on a concentrated market niche, potentially allowing deeper specialization but limited diversification.
Which has the best competitive advantage?
Intuit holds a slightly favorable moat with value creation despite declining profitability, whereas ServiceTitan’s moat is unfavorable, indicating value destruction and less efficient capital use.
Stock Comparison
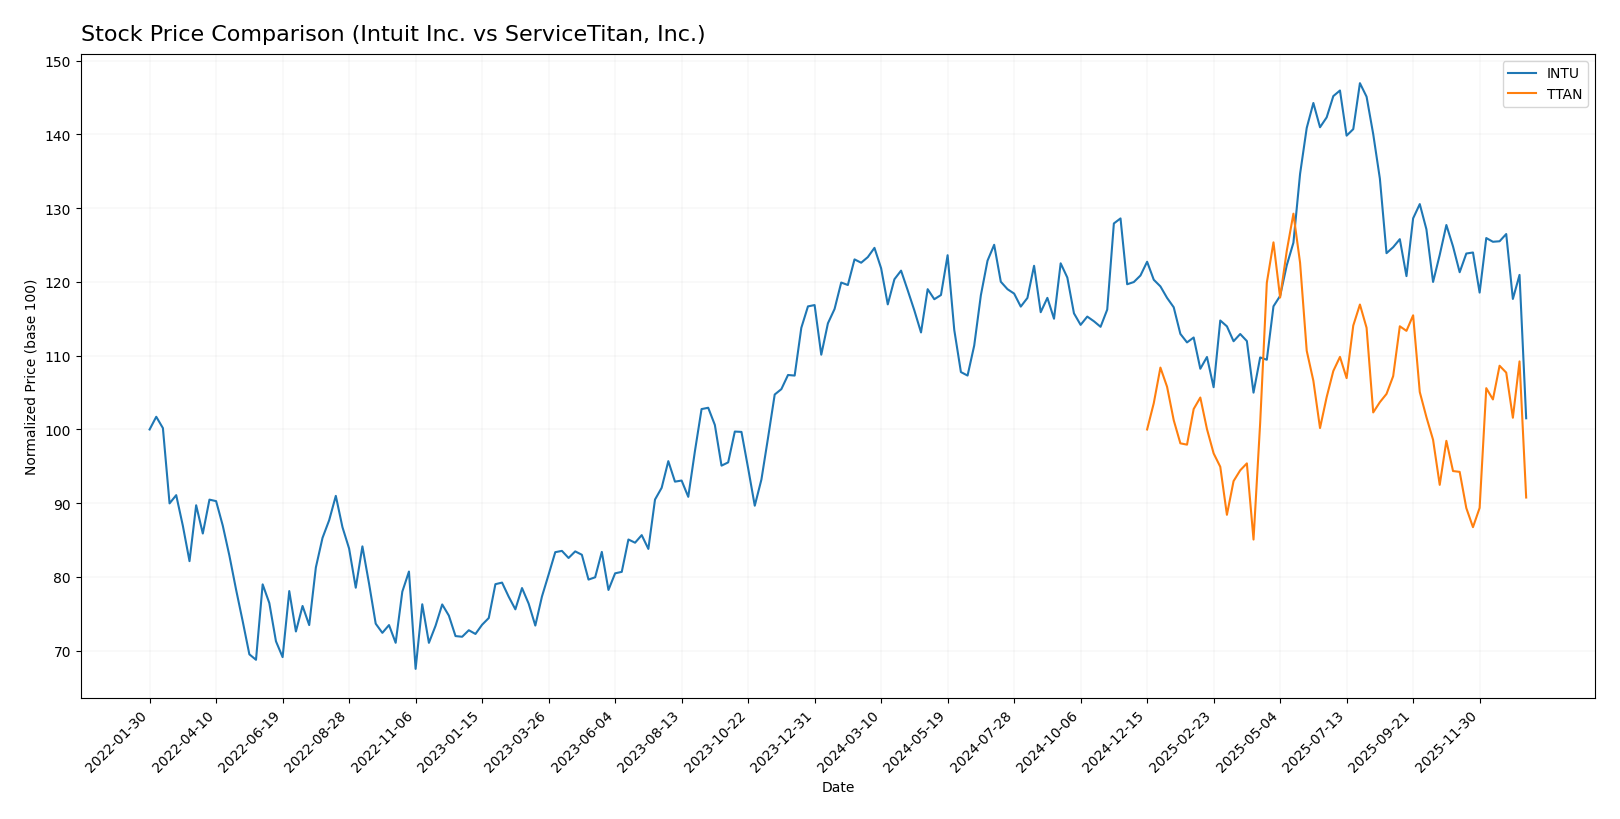
The stock price movements of Intuit Inc. and ServiceTitan, Inc. over the past year reveal distinct bearish trends with varying degrees of price decline and trading volume dynamics.
Trend Analysis
Intuit Inc. experienced a significant bearish trend with a -17.71% price change over the past 12 months, showing deceleration and high volatility with a standard deviation of 51.56. The stock ranged from a high of 785.95 to a low of 542.92.
ServiceTitan, Inc. also showed a bearish trend with a -9.23% price change over the same period, but with accelerating momentum and lower volatility at a standard deviation of 9.86. Its price fluctuated between 129.26 and 85.07.
Comparing both stocks, Intuit Inc. had a steeper decline and higher volatility, while ServiceTitan, Inc. delivered a smaller loss with accelerating trend conditions, indicating relatively better market performance.
Target Prices
The current analyst consensus presents a positive outlook for both Intuit Inc. and ServiceTitan, Inc.
| Company | Target High | Target Low | Consensus |
|---|---|---|---|
| Intuit Inc. | 880 | 700 | 798.4 |
| ServiceTitan, Inc. | 145 | 117 | 132.44 |
Analysts expect Intuit’s stock to rise significantly from the current 545.16 USD, while ServiceTitan’s consensus target of 132.44 USD suggests notable upside from its current 90.8 USD price.
Analyst Opinions Comparison
This section compares analysts’ ratings and financial scores for Intuit Inc. and ServiceTitan, Inc.:
Rating Comparison
INTU Rating
- Rating: B, considered Very Favorable overall.
- Discounted Cash Flow Score: 4, indicating a Favorable valuation based on future cash flows.
- ROE Score: 4, Favorable, showing efficient profit generation from equity.
- ROA Score: 5, Very Favorable, demonstrating excellent asset utilization to generate earnings.
- Debt To Equity Score: 2, Moderate, implying a balanced but somewhat leveraged financial risk.
- Overall Score: 3, Moderate, a balanced summary of financial health and performance.
TTAN Rating
- Rating: C-, marked as Very Favorable despite lower scores.
- Discounted Cash Flow Score: 1, assessed as Very Unfavorable, suggesting overvaluation risks.
- ROE Score: 1, Very Unfavorable, reflecting poor efficiency in generating equity returns.
- ROA Score: 1, Very Unfavorable, indicating weak asset effectiveness.
- Debt To Equity Score: 3, Moderate, showing a higher debt relative to equity than INTU.
- Overall Score: 1, Very Unfavorable, reflecting weaker overall financial standing.
Which one is the best rated?
Based strictly on the provided data, Intuit Inc. holds significantly better ratings and financial scores across all key metrics compared to ServiceTitan, Inc., indicating stronger financial health and operational efficiency.
Scores Comparison
The comparison of the Altman Z-Score and Piotroski Score for Intuit Inc. and ServiceTitan, Inc. is as follows:
INTU Scores
- Altman Z-Score: 9.35, indicating a safe zone and low bankruptcy risk.
- Piotroski Score: 9, classified as very strong financial health.
TTAN Scores
- Altman Z-Score: 15.74, indicating a safe zone and very low bankruptcy risk.
- Piotroski Score: 6, classified as average financial health.
Which company has the best scores?
ServiceTitan has a higher Altman Z-Score than Intuit, suggesting even lower bankruptcy risk. However, Intuit’s Piotroski Score is stronger, indicating better overall financial health.
Grades Comparison
Here is a detailed comparison of the latest available grades from reputable grading companies for Intuit Inc. and ServiceTitan, Inc.:
Intuit Inc. Grades
The table below summarizes the recent grades assigned to Intuit Inc. by established financial institutions:
| Grading Company | Action | New Grade | Date |
|---|---|---|---|
| Wells Fargo | Downgrade | Equal Weight | 2026-01-08 |
| Wells Fargo | Maintain | Overweight | 2025-11-21 |
| RBC Capital | Maintain | Outperform | 2025-11-21 |
| BMO Capital | Maintain | Outperform | 2025-11-21 |
| Evercore ISI Group | Maintain | Outperform | 2025-11-18 |
| RBC Capital | Maintain | Outperform | 2025-09-02 |
| RBC Capital | Maintain | Outperform | 2025-08-22 |
| UBS | Maintain | Neutral | 2025-08-22 |
| Morgan Stanley | Maintain | Overweight | 2025-08-22 |
| Barclays | Maintain | Overweight | 2025-08-22 |
Intuit’s grades show a predominantly positive outlook with multiple “Outperform” and “Overweight” recommendations, though a recent downgrade by Wells Fargo to “Equal Weight” suggests some caution.
ServiceTitan, Inc. Grades
Below are the recent grades issued to ServiceTitan, Inc. by recognized grading firms:
| Grading Company | Action | New Grade | Date |
|---|---|---|---|
| Piper Sandler | Maintain | Overweight | 2025-12-05 |
| BMO Capital | Maintain | Outperform | 2025-12-05 |
| TD Cowen | Maintain | Buy | 2025-12-05 |
| Morgan Stanley | Maintain | Equal Weight | 2025-12-05 |
| BMO Capital | Maintain | Outperform | 2025-11-20 |
| Wells Fargo | Maintain | Overweight | 2025-09-19 |
| Stifel | Maintain | Buy | 2025-09-19 |
| Piper Sandler | Maintain | Overweight | 2025-09-19 |
| Canaccord Genuity | Maintain | Buy | 2025-09-19 |
| Citigroup | Maintain | Neutral | 2025-09-09 |
ServiceTitan’s ratings are consistently favorable, with multiple “Buy,” “Outperform,” and “Overweight” grades reflecting positive analyst sentiment.
Which company has the best grades?
Both Intuit Inc. and ServiceTitan, Inc. have predominantly positive grades, but ServiceTitan features more “Buy” and “Outperform” ratings without recent downgrades. This may indicate stronger analyst conviction, which could influence investor confidence and portfolio positioning accordingly.
Strengths and Weaknesses
Below is a comparative overview of the key strengths and weaknesses of Intuit Inc. and ServiceTitan, Inc. based on their latest financial and operational data.
| Criterion | Intuit Inc. (INTU) | ServiceTitan, Inc. (TTAN) |
|---|---|---|
| Diversification | Highly diversified revenue streams across Consumer, Global Business, Credit Karma, and Professional Tax segments (over $18B total in 2025) | Limited diversification; primarily platform and subscription revenues (~$1.3B total in 2025) |
| Profitability | Strong profitability with 20.55% net margin, 19.63% ROE, and 14.78% ROIC | Negative profitability; net margin -30.98%, ROE -16.44%, ROIC -14.11% |
| Innovation | Established leader with consistent investment in financial and tax technology | Growing innovation but yet to demonstrate profitability or scale comparable to industry leaders |
| Global presence | Extensive global footprint, especially in business and consumer financial solutions | Primarily North American market focus, limited global exposure |
| Market Share | Significant market share in financial software and tax preparation markets | Emerging player with niche market share in service management software |
Key takeaways: Intuit stands out with its diversified revenue base, strong profitability, and global reach, making it a more stable investment. ServiceTitan shows promise in innovation and growth potential but currently suffers from negative profitability and limited diversification, indicating higher risk for investors.
Risk Analysis
Below is a comparison of key risks for Intuit Inc. and ServiceTitan, Inc. based on the most recent data for 2025.
| Metric | Intuit Inc. (INTU) | ServiceTitan, Inc. (TTAN) |
|---|---|---|
| Market Risk | Beta 1.254, moderate volatility | Beta -0.85, inverse market correlation |
| Debt Level | Debt-to-Equity 0.34, low leverage | Debt-to-Equity 0.11, very low leverage |
| Regulatory Risk | Moderate, due to financial services | Moderate, due to field service regulations |
| Operational Risk | Managed, with strong operational metrics | Higher, negative net margin and ROE indicate operational challenges |
| Environmental Risk | Low, standard for software industry | Low, standard for software industry |
| Geopolitical Risk | Moderate, US and international markets exposure | Moderate, primarily US market exposure |
Intuit faces moderate market risk with a beta above 1, indicating sensitivity to market swings. Its financial leverage is low, reducing default risk. ServiceTitan’s negative profitability and return on equity highlight higher operational risks despite low leverage. Both companies have similar regulatory and geopolitical risks typical of their sectors. Investors should weigh Intuit’s stable profitability against ServiceTitan’s growth challenges and volatility.
Which Stock to Choose?
Intuit Inc. (INTU) shows a favorable income evolution with 15.63% revenue growth in 2025 and strong profitability metrics, including a 20.55% net margin and 19.63% ROE. Its financial ratios are mostly favorable, supported by low debt and a very favorable rating of B, despite a high P/E ratio.
ServiceTitan, Inc. (TTAN) exhibits mixed income performance with 25.64% revenue growth but negative net and EBIT margins. Financial ratios are largely unfavorable, reflecting losses and higher risk, though debt levels remain low and the rating is C-, signaling caution despite some balance sheet strengths.
For investors prioritizing quality and stable profitability, Intuit’s favorable rating, consistent income growth, and solid financial ratios might appear more attractive, whereas those with higher risk tolerance and growth focus could view ServiceTitan’s potential for revenue expansion as worth monitoring despite current challenges.
Disclaimer: Investment carries a risk of loss of initial capital. The past performance is not a reliable indicator of future results. Be sure to understand risks before making an investment decision.
Go Further
I encourage you to read the complete analyses of Intuit Inc. and ServiceTitan, Inc. to enhance your investment decisions: