Home > Comparison > Technology > INTU vs NOW
The strategic rivalry between Intuit Inc. and ServiceNow, Inc. shapes the evolution of the technology sector’s application software industry. Intuit operates as a diversified provider of financial management solutions targeting small businesses and consumers. In contrast, ServiceNow delivers enterprise cloud computing platforms focused on workflow automation and IT service management. This analysis seeks to identify which corporate strategy offers a superior risk-adjusted return for a diversified portfolio in 2026.
Table of contents
Companies Overview
Intuit Inc. and ServiceNow, Inc. stand as pivotal players in the software application sector, shaping financial management and enterprise cloud automation markets.
Intuit Inc.: Financial Management Powerhouse
Intuit dominates the financial software space with its QuickBooks suite, TurboTax, and Credit Karma platforms. Its core revenue engine revolves around subscription services and payment processing for small businesses and consumers. The 2026 strategy emphasizes expanding cloud-based offerings and integrated financial solutions to deepen customer engagement.
ServiceNow, Inc.: Enterprise Workflow Innovator
ServiceNow leads in enterprise cloud computing with its Now Platform, automating workflows across IT, HR, and customer service. Revenue stems from subscription licenses and professional services. In 2026, the company focuses on enhancing AI-driven automation and expanding industry-specific solutions to strengthen its foothold in digital transformation.
Strategic Collision: Similarities & Divergences
Both firms leverage software-as-a-service models but diverge in target markets—Intuit focuses on financial management for small businesses, while ServiceNow targets large enterprises’ workflow automation. Their primary battleground lies in cloud-based subscription growth. Intuit offers a consumer-centric ecosystem, whereas ServiceNow provides open, scalable infrastructure—defining distinct investment profiles based on market scope and innovation focus.
Income Statement Comparison
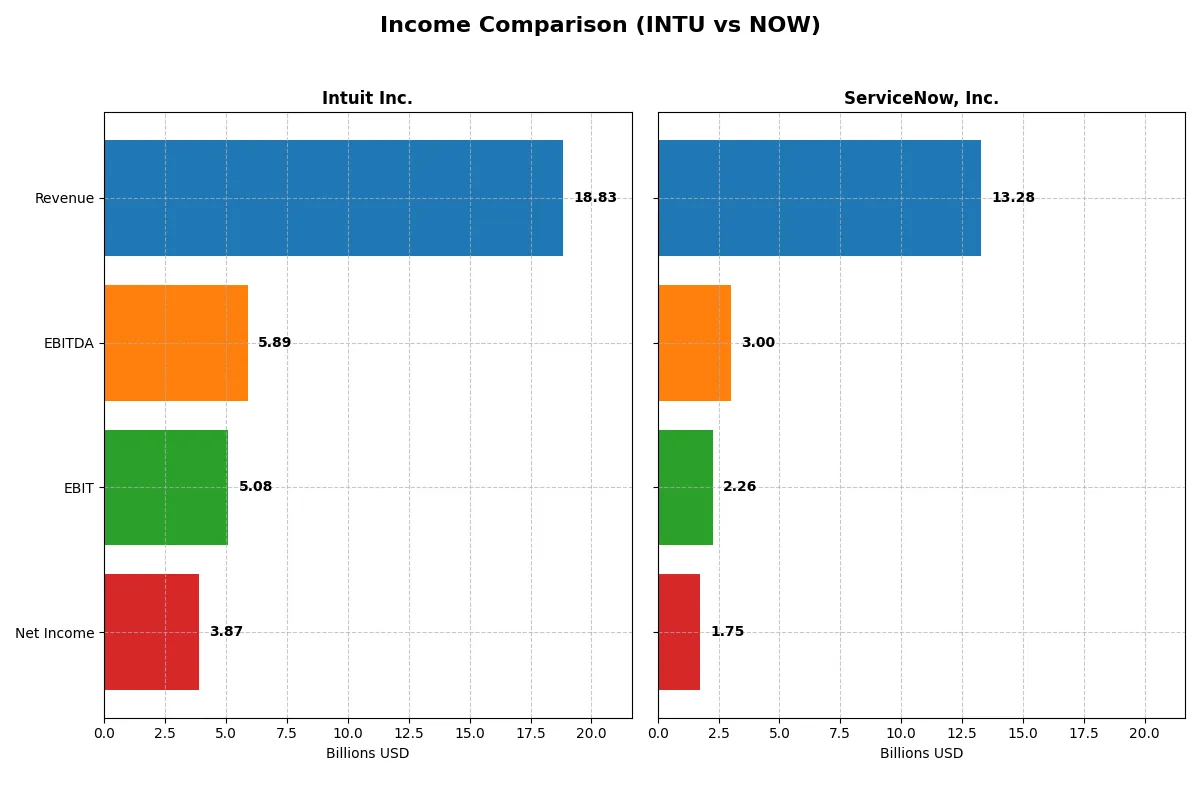
The following data dissects the core profitability and scalability of both corporate engines to reveal who dominates the bottom line:
| Metric | Intuit Inc. (INTU) | ServiceNow, Inc. (NOW) |
|---|---|---|
| Revenue | 18.8B | 13.3B |
| Cost of Revenue | 3.62B | 2.98B |
| Operating Expenses | 10.3B | 8.47B |
| Gross Profit | 15.2B | 10.3B |
| EBITDA | 5.89B | 3.00B |
| EBIT | 5.08B | 2.26B |
| Interest Expense | 247M | 0 |
| Net Income | 3.87B | 1.75B |
| EPS | 13.82 | 1.69 |
| Fiscal Year | 2025 | 2025 |
Income Statement Analysis: The Bottom-Line Duel
This income statement comparison exposes which company runs a more efficient and profitable business engine through recent financial performance.
Intuit Inc. Analysis
Intuit’s revenue rose steadily from 9.6B in 2021 to 18.8B in 2025, nearly doubling over five years. Net income surged from 2.1B to 3.9B, reflecting robust growth. Gross margin remains strong at 80.8%, and net margin holds a healthy 20.6%. The latest year shows impressive EBIT growth of 34%, signaling operational momentum and disciplined cost control.
ServiceNow, Inc. Analysis
ServiceNow more than doubled revenue from 5.9B in 2021 to 13.3B in 2025, outpacing Intuit’s growth rate. Net income expanded dramatically from 230M to 1.75B, fueled by margin improvements. Gross margin stands at 77.5%, with net margin at 13.2%. The company’s swift revenue and EBIT growth—21% and 28% respectively—show accelerating scale and improving efficiency.
Growth Velocity vs. Margin Strength
Intuit leads with superior margins and strong profitability, delivering consistent bottom-line expansion and operational efficiency. ServiceNow impresses with faster revenue and net income growth, leveraging scale to improve margins from a lower base. Investors favoring steady, margin-rich profits may prefer Intuit, while those prioritizing high growth and expanding market share might lean toward ServiceNow.
Financial Ratios Comparison
These vital ratios act as a diagnostic tool to expose the underlying fiscal health, valuation premiums, and capital efficiency of the companies compared below:
| Ratios | Intuit Inc. (INTU) | ServiceNow, Inc. (NOW) |
|---|---|---|
| ROE | 19.6% | 13.5% |
| ROIC | 14.8% | 9.0% |
| P/E | 56.8 | 90.9 |
| P/B | 11.2 | 12.3 |
| Current Ratio | 1.36 | 0.95 |
| Quick Ratio | 1.36 | 0.95 |
| D/E | 0.34 | 0.25 |
| Debt-to-Assets | 18.0% | 12.3% |
| Interest Coverage | 19.9 | 0 |
| Asset Turnover | 0.51 | 0.51 |
| Fixed Asset Turnover | 12.5 | 4.29 |
| Payout Ratio | 30.7% | 0% |
| Dividend Yield | 0.54% | 0% |
| Fiscal Year | 2025 | 2025 |
Efficiency & Valuation Duel: The Vital Signs
Financial ratios serve as a company’s DNA, exposing hidden risks and revealing operational excellence critical to investment decisions.
Intuit Inc.
Intuit posts a robust 19.63% ROE and a strong 20.55% net margin, signaling efficient profitability. Its valuation appears stretched with a high 56.82 P/E and 11.15 P/B, reflecting market premium. The company returns modest dividends (0.54%) while reinvesting heavily in R&D, fueling sustainable growth and solid capital allocation.
ServiceNow, Inc.
ServiceNow delivers moderate profitability with a 13.48% ROE and 13.16% net margin, showing operational steadiness but less efficiency than Intuit. Its valuation is significantly stretched at 90.88 P/E and 12.25 P/B, suggesting high growth expectations. The firm pays no dividend, focusing on aggressive reinvestment in R&D to drive expansion and innovation.
Premium Valuation vs. Operational Safety
Intuit balances superior profitability and a solid dividend with a high but more justified valuation. ServiceNow’s higher valuation demands exceptional growth, yet profitability metrics lag. Investors seeking operational safety might prefer Intuit, while growth-focused profiles may tolerate ServiceNow’s stretched multiples.
Which one offers the Superior Shareholder Reward?
Intuit pays a modest 0.54% dividend yield with a sustainable 31% payout ratio, backed by robust free cash flow of 21.7B, and conducts consistent buybacks enhancing shareholder value. ServiceNow pays no dividend but reinvests all cash into growth, evident by zero payout and smaller free cash flow of 4.4B. Intuit’s balanced distribution—dividends plus buybacks—offers a more attractive, sustainable total return profile in 2026.
Comparative Score Analysis: The Strategic Profile
The radar chart reveals the fundamental DNA and trade-offs of Intuit Inc. and ServiceNow, Inc., outlining their financial strengths and valuation challenges side by side:
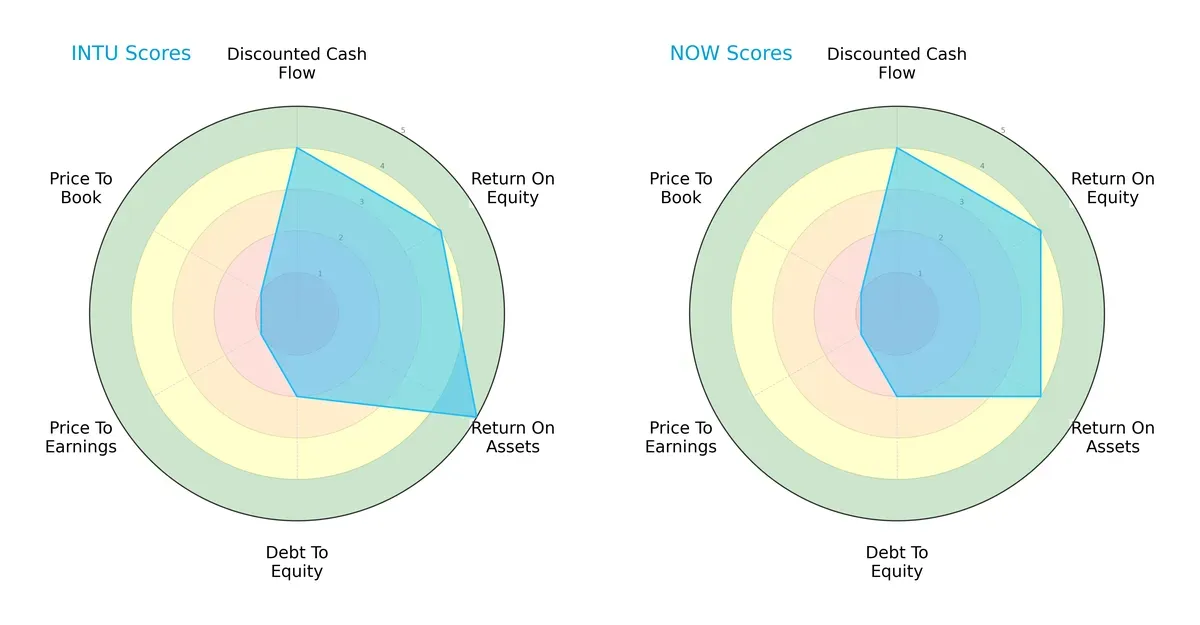
Intuit leads slightly in asset efficiency with a ROA score of 5 versus ServiceNow’s 4. Both share identical DCF and ROE scores at 4, indicating comparable cash flow prospects and equity returns. They tie on moderate debt-to-equity risk at 2 but falter equally on valuation metrics (PE and PB scores of 1), signaling overvaluation concerns. Intuit’s superior ROA suggests a more balanced operational profile, while ServiceNow leans on its equity returns for competitive advantage.
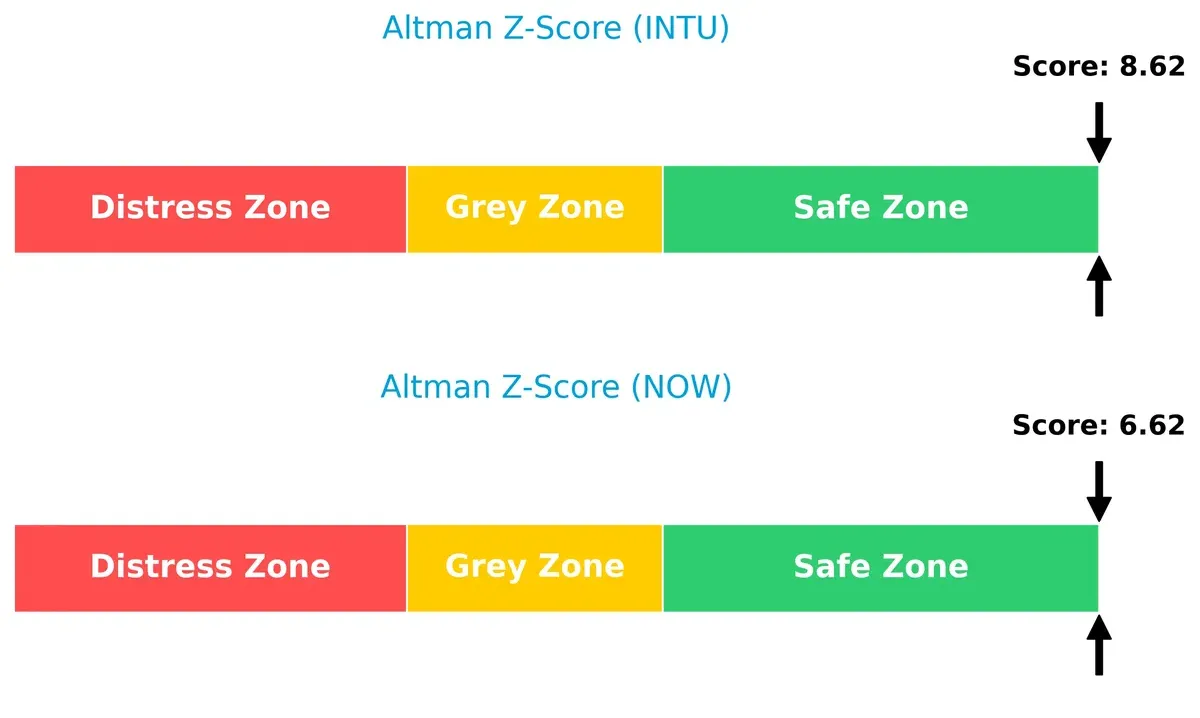
Bankruptcy Risk: Solvency Showdown
Intuit’s Altman Z-Score of 8.6 outpaces ServiceNow’s 6.6, both comfortably in the safe zone, underscoring robust long-term solvency amid economic fluctuations:
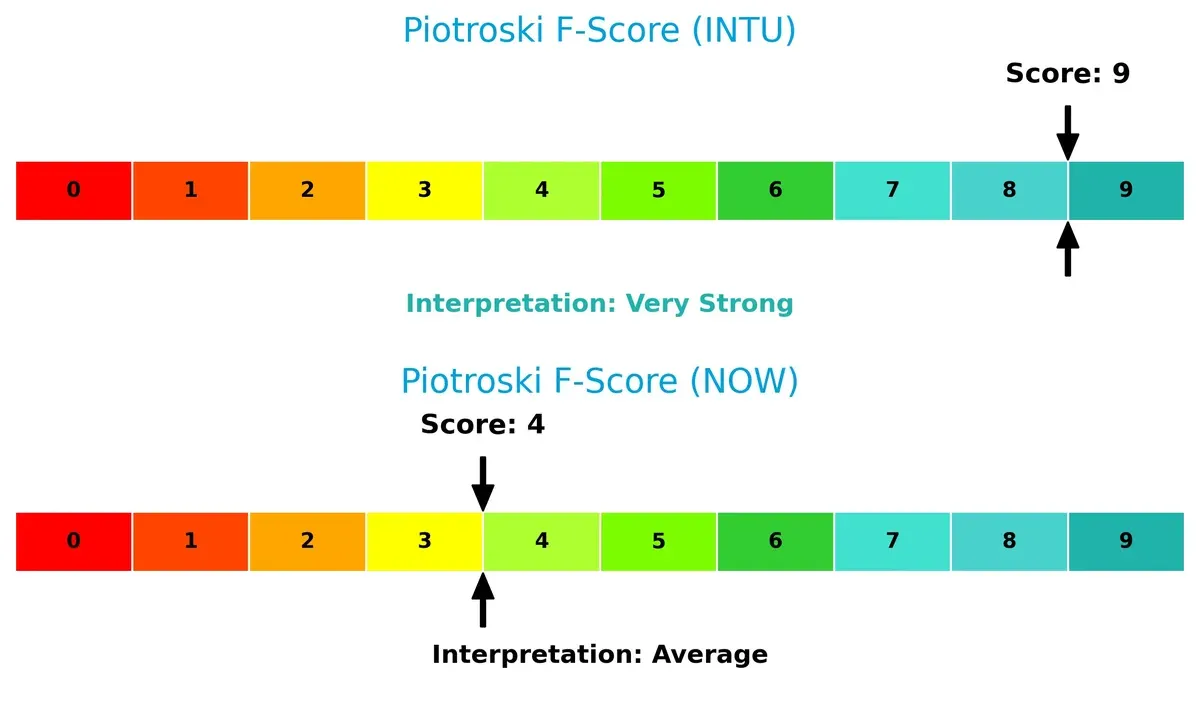
Financial Health: Quality of Operations
Intuit scores a perfect 9 on the Piotroski F-Score, reflecting very strong internal financial health. ServiceNow’s 4 signals average quality, raising red flags about operational consistency and value creation:
How are the two companies positioned?
This section dissects the operational DNA of Intuit and ServiceNow by comparing their revenue distribution and internal strengths and weaknesses. The goal is to confront their economic moats and identify which model offers the most resilient, sustainable competitive advantage today.
Revenue Segmentation: The Strategic Mix
This comparison dissects how Intuit Inc. and ServiceNow, Inc. diversify their income streams and where their primary sector bets lie:
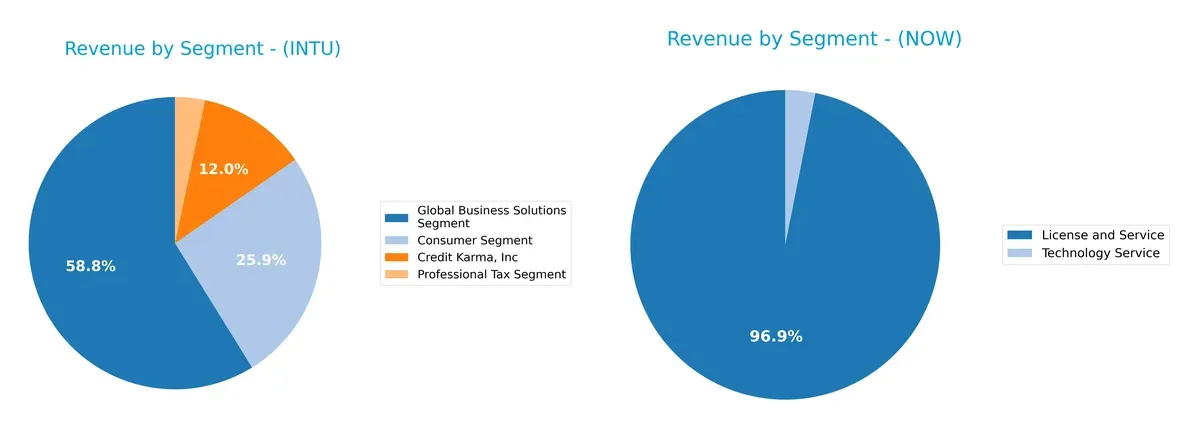
Intuit’s 2025 revenue pivots on a broad base, with $11.1B from Global Business Solutions and $4.87B from Consumer Segment, reflecting strong ecosystem lock-in. Credit Karma adds $2.26B, enhancing diversification. ServiceNow leans heavily on License and Service at $12.88B, dwarfing its $414M Technology Service revenue. Intuit’s balance reduces concentration risk, while ServiceNow’s focus anchors its infrastructure dominance but heightens dependency on core software licenses.
Strengths and Weaknesses Comparison
This table compares the strengths and weaknesses of Intuit Inc. and ServiceNow, Inc. based on key financial and business metrics:
Intuit Inc. Strengths
- Strong profitability with 20.55% net margin and 19.63% ROE
- Favorable ROIC of 14.78% exceeding WACC
- Low debt-to-assets at 17.96% and strong interest coverage
- Diversified revenue streams including Consumer, Credit Karma, and Global Business segments
- High fixed asset turnover at 12.54
- Favorable quick ratio at 1.36 indicating liquidity
ServiceNow, Inc. Strengths
- Positive net margin of 13.16% and favorable interest coverage
- Low debt-to-assets at 12.3% supporting financial stability
- Revenue growth in Digital Workflow and ITOM products
- Global presence with significant revenue from North America, EMEA, and Asia Pacific
- Moderate fixed asset turnover at 4.29
- Neutral current and quick ratios reflecting balanced liquidity
Intuit Inc. Weaknesses
- High valuation multiples with PE at 56.82 and PB at 11.15
- Dividend yield low at 0.54%
- Neutral current ratio at 1.36 suggests moderate short-term liquidity
- Asset turnover moderate at 0.51, indicating room for operational efficiency improvement
ServiceNow, Inc. Weaknesses
- Very high valuation multiples with PE of 90.88 and PB at 12.25
- Current ratio below 1.0 at 0.95 signals liquidity risk
- ROE and ROIC are neutral, below Intuit’s levels
- No dividend yield, limiting income returns
- Asset turnover at 0.51 shows potential inefficiency
Both companies show strengths in financial stability and product diversification but face challenges with high valuations and liquidity metrics. Intuit’s profitability and capital efficiency outpace ServiceNow, while ServiceNow’s global expansion supports growth strategy despite weaker liquidity.
The Moat Duel: Analyzing Competitive Defensibility
A structural moat is the only thing protecting long-term profits from relentless competition and market disruption. Let’s break down the battle between Intuit and ServiceNow:
Intuit Inc.: Switching Costs Powerhouse
Intuit’s moat stems from high switching costs embedded in its financial software ecosystem. Its 27% EBIT margin and stable revenue growth confirm durable pricing power. The expansion of cloud-based QuickBooks deepens this moat in 2026.
ServiceNow, Inc.: Rapidly Growing Platform Moat
ServiceNow relies on network effects from its Now platform, automating enterprise workflows globally. Despite a lower 17% EBIT margin, its accelerating ROIC and 20% annual revenue growth reflect an expanding footprint. Its AI-enhanced workflow tools could disrupt traditional ITSM markets.
Verdict: Switching Costs vs. Network Effects in SaaS Dominance
Intuit holds a deeper moat today with strong cash flow and margin stability. ServiceNow’s rapidly growing ROIC signals a rising moat but it remains vulnerable to competition. Intuit is better positioned to defend entrenched market share, while ServiceNow is the aggressive upstart.
Which stock offers better returns?
Both Intuit Inc. and ServiceNow, Inc. have experienced notable price declines over the past year, with distinct trading volume patterns reflecting shifting investor sentiment.
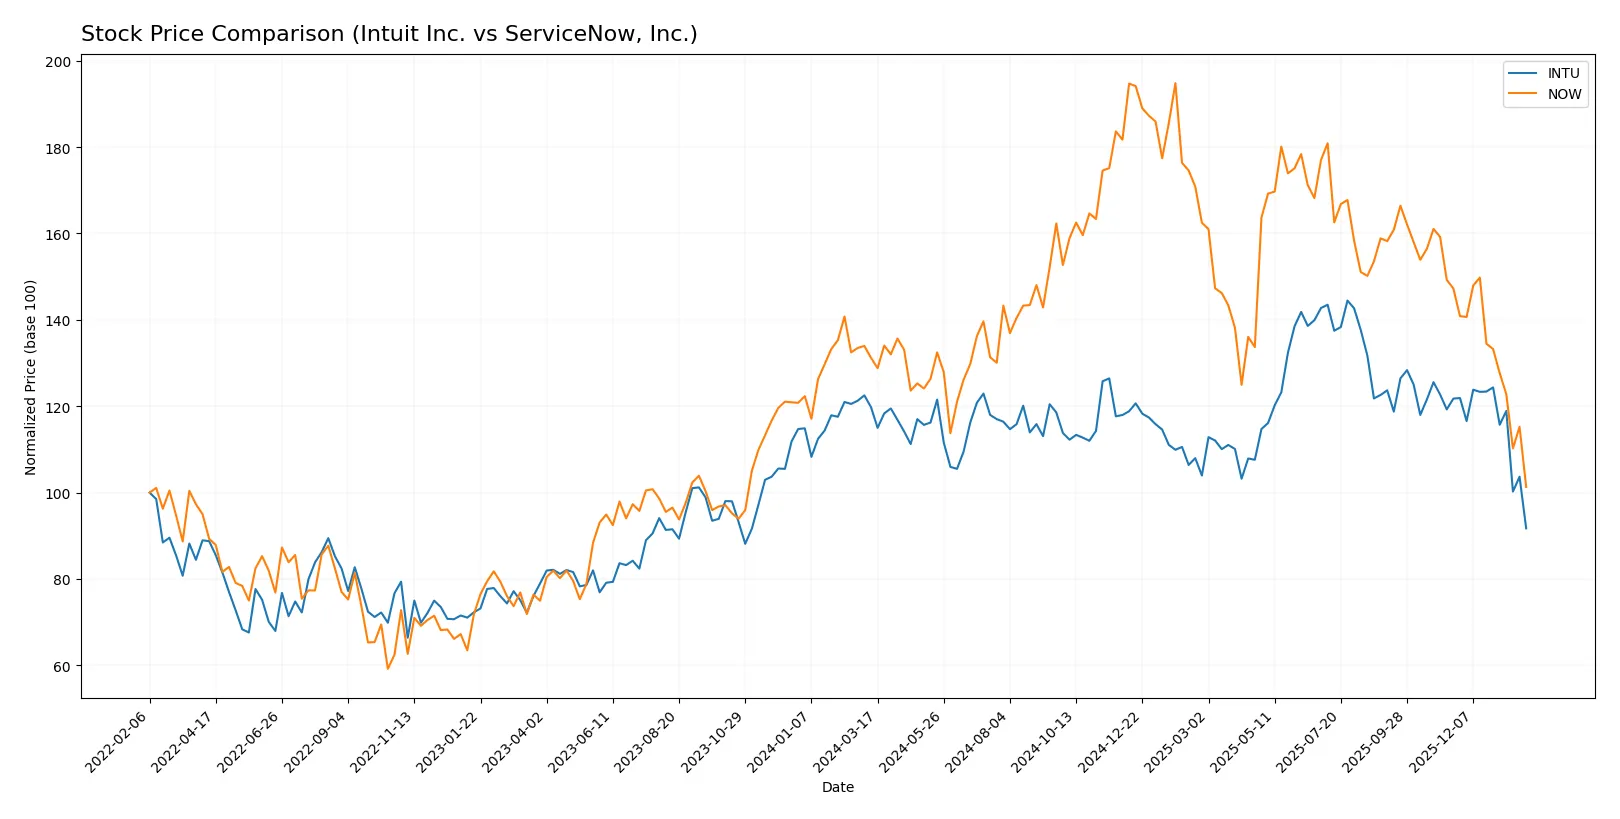
Trend Comparison
Intuit Inc. shows a 23.45% price decline over the past 12 months, indicating a bearish trend with decelerating downward momentum and high volatility. Its price ranged between 499 and 786.
ServiceNow, Inc. also posts a bearish trend, with a 22.79% drop in price over 12 months. The decline decelerates, volatility is lower than Intuit’s, and the stock traded between 117 and 225.
Comparing both, Intuit’s 23.45% loss slightly exceeds ServiceNow’s 22.79%. Intuit’s higher volatility contrasts with ServiceNow’s more moderate price swings.
Target Prices
Analysts present a broad consensus on target prices for Intuit Inc. and ServiceNow, Inc., reflecting varied growth expectations.
| Company | Target Low | Target High | Consensus |
|---|---|---|---|
| Intuit Inc. | 700 | 880 | 798.4 |
| ServiceNow, Inc. | 115 | 1315 | 440.14 |
Intuit’s target consensus at 798.4 suggests significant upside from its current 499 price, indicating strong confidence. ServiceNow’s wide range and consensus well above its 117 price reflect high volatility and mixed sentiment.

Don’t Let Luck Decide Your Entry Point
Optimize your entry points with our advanced ProRealTime indicators. You’ll get efficient buy signals with precise price targets for maximum performance. Start outperforming now!
How do institutions grade them?
Intuit Inc. Grades
This table summarizes recent grades from established grading companies for Intuit Inc.
| Grading Company | Action | New Grade | Date |
|---|---|---|---|
| Wells Fargo | Downgrade | Equal Weight | 2026-01-08 |
| Wells Fargo | Maintain | Overweight | 2025-11-21 |
| RBC Capital | Maintain | Outperform | 2025-11-21 |
| BMO Capital | Maintain | Outperform | 2025-11-21 |
| Evercore ISI Group | Maintain | Outperform | 2025-11-18 |
| RBC Capital | Maintain | Outperform | 2025-09-02 |
| UBS | Maintain | Neutral | 2025-08-22 |
| Barclays | Maintain | Overweight | 2025-08-22 |
| Morgan Stanley | Maintain | Overweight | 2025-08-22 |
| Keybanc | Maintain | Overweight | 2025-08-22 |
ServiceNow, Inc. Grades
This table summarizes recent grades from established grading companies for ServiceNow, Inc.
| Grading Company | Action | New Grade | Date |
|---|---|---|---|
| Citigroup | Maintain | Buy | 2026-01-30 |
| BTIG | Maintain | Buy | 2026-01-29 |
| Stifel | Maintain | Buy | 2026-01-29 |
| RBC Capital | Maintain | Outperform | 2026-01-29 |
| Macquarie | Maintain | Neutral | 2026-01-29 |
| DA Davidson | Maintain | Buy | 2026-01-29 |
| Needham | Maintain | Buy | 2026-01-29 |
| Keybanc | Maintain | Underweight | 2026-01-29 |
| Evercore ISI Group | Maintain | Outperform | 2026-01-29 |
| Cantor Fitzgerald | Maintain | Overweight | 2026-01-29 |
Which company has the best grades?
ServiceNow consistently holds “Buy” and “Outperform” ratings from major firms, signaling stronger institutional confidence. Intuit shows mostly “Outperform” and “Overweight” grades but includes a recent downgrade. This suggests ServiceNow may be viewed as more favorable by analysts, potentially influencing investor sentiment and portfolio inclusion.
Risks specific to each company
The following categories identify critical pressure points and systemic threats facing Intuit Inc. and ServiceNow, Inc. in the 2026 market environment:
1. Market & Competition
Intuit Inc.
- Strong brand in financial software with diversified segments but faces high competition from fintech startups.
ServiceNow, Inc.
- Leading workflow automation platform, growing rapidly but challenged by large cloud providers and niche competitors.
2. Capital Structure & Debt
Intuit Inc.
- Low debt-to-equity (0.34) and strong interest coverage (20.57) indicate conservative leverage and solid debt service capacity.
ServiceNow, Inc.
- Lower debt-to-equity (0.25) with infinite interest coverage shows excellent debt management but weaker liquidity ratios.
3. Stock Volatility
Intuit Inc.
- Beta of 1.254 signals above-market volatility, reflecting sensitivity to tech sector swings.
ServiceNow, Inc.
- Beta of 0.979 implies volatility roughly in line with the market, indicating more stability.
4. Regulatory & Legal
Intuit Inc.
- Operates under stringent financial services regulations; tax software faces compliance complexity risks.
ServiceNow, Inc.
- Faces regulatory scrutiny on data privacy and cloud security, with potential risks from evolving global standards.
5. Supply Chain & Operations
Intuit Inc.
- Relies on cloud infrastructure and third-party payment processors, exposing it to operational disruptions.
ServiceNow, Inc.
- Heavy dependence on IT infrastructure and global partners; operational resilience critical amid tech disruptions.
6. ESG & Climate Transition
Intuit Inc.
- Moderate ESG risks; climate transition impacts limited but investor pressure on sustainability rising.
ServiceNow, Inc.
- Increasing focus on ESG integration; potential risks from regulatory shifts and customer expectations on sustainability.
7. Geopolitical Exposure
Intuit Inc.
- Global operations in financial services expose it to geopolitical tensions affecting cross-border data flows.
ServiceNow, Inc.
- Broad international footprint in enterprise software exposes it to geopolitical risks and trade policy shifts.
Which company shows a better risk-adjusted profile?
Intuit’s strongest risk is its market volatility and premium valuation, signaling sensitivity to tech cycles. ServiceNow’s greatest risk lies in weaker liquidity and regulatory pressures amid rapid expansion. Intuit demonstrates a sturdier risk-adjusted profile, supported by superior liquidity, debt metrics, and high Altman Z-Score (8.6 vs. 6.6). Its very strong Piotroski Score (9) confirms financial health, while ServiceNow’s average Piotroski (4) flags caution. The disparity in current ratios (1.36 vs. 0.95) further justifies concern for ServiceNow’s short-term financial flexibility.
Final Verdict: Which stock to choose?
Intuit Inc. stands out as a cash machine with robust profitability and efficient capital allocation. Its superpower lies in delivering consistent high returns and strong income quality. A point of vigilance is its lofty valuation multiples, which could pressure future gains. Intuit suits portfolios aiming for aggressive growth with a tolerance for premium pricing.
ServiceNow, Inc. boasts a strategic moat rooted in cloud dominance and recurring revenue safety. It offers a more stable profile relative to Intuit, supported by improving profitability and a growing ROIC trajectory. ServiceNow fits well in Growth at a Reasonable Price (GARP) portfolios seeking solid expansion with balanced risk.
If you prioritize consistent value creation and strong profitability, Intuit is the compelling choice due to its superior returns on invested capital. However, if you seek growth fueled by cloud innovation and prefer better stability in profitability trends, ServiceNow offers a more attractive scenario. Both companies warrant caution given recent bearish price trends and stretched valuations.
Disclaimer: Investment carries a risk of loss of initial capital. The past performance is not a reliable indicator of future results. Be sure to understand risks before making an investment decision.
Go Further
I encourage you to read the complete analyses of Intuit Inc. and ServiceNow, Inc. to enhance your investment decisions: