Home > Comparison > Technology > QCOM vs INTC
The strategic rivalry between QUALCOMM Incorporated and Intel Corporation shapes the semiconductor industry’s evolution. QUALCOMM excels as a technology licensor and innovator in wireless communications. Intel stands as a capital-intensive chip manufacturer with broad product diversification. This comparison pits innovation-driven licensing against manufacturing scale. My analysis will clarify which business model offers superior risk-adjusted returns for a diversified portfolio navigating the dynamic tech landscape.
Table of contents
Companies Overview
QUALCOMM Incorporated and Intel Corporation occupy pivotal roles in the semiconductor industry, shaping technology’s evolution in wireless and computing markets.
QUALCOMM Incorporated: Wireless Technology Pioneer
QUALCOMM leads as a foundational technology developer in wireless communications. Its core revenue stems from integrated circuits and licensing intellectual property tied to 3G through 5G standards. In 2026, QUALCOMM focuses on expanding its 5G chipset dominance and strategic investments in AI, automotive, and IoT to sustain growth beyond traditional licensing.
Intel Corporation: Computing Powerhouse
Intel stands as a global leader in computer product design and manufacturing. It generates revenue from platform products like CPUs and chipsets, plus adjacent areas including accelerators and connectivity. Its 2026 strategy targets high-performance computing and AI-enhanced solutions, particularly in cloud, autonomous driving, and healthcare, reinforcing its broad technology ecosystem.
Strategic Collision: Similarities & Divergences
Both firms compete fiercely in semiconductors but adopt distinct philosophies: QUALCOMM emphasizes a licensing-driven, wireless-focused model, while Intel pursues an integrated hardware-software platform approach across diverse verticals. Their primary battleground is 5G and AI-enabled computing. This divergence crafts unique investment profiles: QUALCOMM’s innovation in wireless ecosystems contrasts with Intel’s broad compute-intensive technology portfolio.
Income Statement Comparison
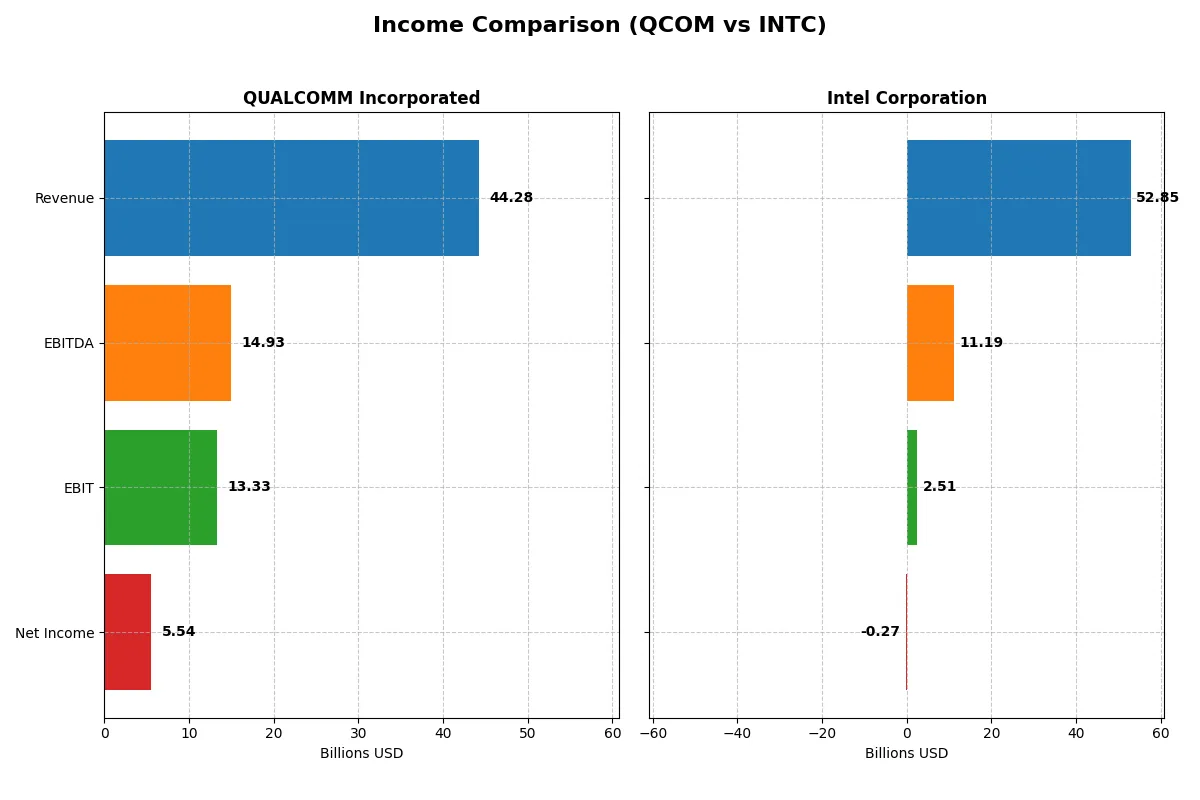
This data dissects the core profitability and scalability of both corporate engines to reveal who dominates the bottom line:
| Metric | QUALCOMM Incorporated (QCOM) | Intel Corporation (INTC) |
|---|---|---|
| Revenue | 44.3B | 52.9B |
| Cost of Revenue | 19.7B | 34.4B |
| Operating Expenses | 12.2B | 20.6B |
| Gross Profit | 24.5B | 18.5B |
| EBITDA | 14.9B | 11.2B |
| EBIT | 13.3B | 2.5B |
| Interest Expense | 664M | 953M |
| Net Income | 5.5B | -267M |
| EPS | 5.06 | -0.08 |
| Fiscal Year | 2025 | 2025 |
Income Statement Analysis: The Bottom-Line Duel
This income statement comparison reveals which company runs a more efficient and profitable business engine through recent market cycles.
QUALCOMM Incorporated Analysis
QUALCOMM’s revenue climbed steadily from 33.6B in 2021 to 44.3B in 2025, showing solid top-line momentum. Gross margin remains robust at 55.4%, and EBIT margin is a healthy 30.1%, reflecting operational strength. However, net income dropped sharply in 2025 to 5.5B from over 10B in 2024, signaling margin pressure despite revenue growth.
Intel Corporation Analysis
Intel’s revenue declined from 79B in 2021 to 52.9B in 2025, indicating a shrinking scale. Gross margin contracted to 35% in 2025, while EBIT margin barely stayed positive at 4.8%. The company swung to a net loss of 267M in 2025, though it showed strong EBIT and net margin improvements from prior losses, hinting at early recovery signs.
Growth Stability vs. Turnaround Struggles
QUALCOMM delivers consistent revenue growth and superior margin control over Intel’s shrinking sales and volatile profitability. Despite a recent net income drop, QUALCOMM’s margins and operational efficiency dominate. Intel’s profile suits investors focused on turnaround potential, while QUALCOMM appeals to those prioritizing stable profits and margin resilience.
Financial Ratios Comparison
These vital ratios act as a diagnostic tool to expose the underlying fiscal health, valuation premiums, and capital efficiency of each company:
| Ratios | QUALCOMM Incorporated (QCOM) | Intel Corporation (INTC) |
|---|---|---|
| ROE | 26.1% | -0.23% |
| ROIC | 13.2% | -0.02% |
| P/E | 32.7 | -658.4 |
| P/B | 8.54 | 1.54 |
| Current Ratio | 2.82 | 2.02 |
| Quick Ratio | 2.10 | 1.65 |
| D/E | 0.70 | 0.41 |
| Debt-to-Assets | 29.5% | 22.0% |
| Interest Coverage | 18.6 | -2.23 |
| Asset Turnover | 0.88 | 0.25 |
| Fixed Asset Turnover | 9.44 | 0.50 |
| Payout Ratio | 68.7% | 0% |
| Dividend Yield | 2.10% | 0% |
| Fiscal Year | 2025 | 2025 |
Efficiency & Valuation Duel: The Vital Signs
Financial ratios serve as a company’s DNA, uncovering both hidden risks and operational strengths that inform investment decisions.
QUALCOMM Incorporated
QUALCOMM’s 2025 financials reveal robust profitability with a 26.13% ROE and a solid 12.51% net margin, signaling operational efficiency. However, its valuation appears stretched, with a high P/E of 32.7 and a P/B of 8.54. The company supports shareholders through a 2.1% dividend yield, reflecting steady cash returns alongside substantial R&D reinvestment.
Intel Corporation
Intel struggles with profitability, showing negative ROE (-0.23%) and net margin (-0.51%) in 2025, indicating operational challenges. Despite a very low P/E ratio, this reflects losses rather than cheap valuation. Intel maintains a conservative balance sheet with favorable leverage ratios but offers no dividend, focusing instead on R&D and restructuring to regain efficiency.
Premium Valuation vs. Operational Safety
QUALCOMM leads in profitability and shareholder returns but trades at a premium valuation, signaling confidence in growth and operational excellence. Intel’s metrics reveal risk with weak profitability and no dividends, suited for investors prioritizing turnaround potential over immediate returns. The choice hinges on appetite for value versus stability.
Which one offers the Superior Shareholder Reward?
QUALCOMM (QCOM) delivers a superior shareholder reward compared to Intel (INTC) through a balanced distribution model. QCOM yields 2.1% with a sustainable payout ratio near 69%, supported by strong free cash flow of $11.7/share and consistent buybacks. INTC suspends dividends in 2025, posting negative free cash flow (-$1B) and operating cash flow challenges. QCOM’s robust buybacks enhance total returns, while INTC’s weak margins and restructuring dampen near-term rewards. I conclude QCOM offers a more attractive and sustainable total return profile in 2026.
Comparative Score Analysis: The Strategic Profile
The radar chart reveals the fundamental DNA and trade-offs of QUALCOMM Incorporated and Intel Corporation, highlighting their financial strengths and weaknesses:
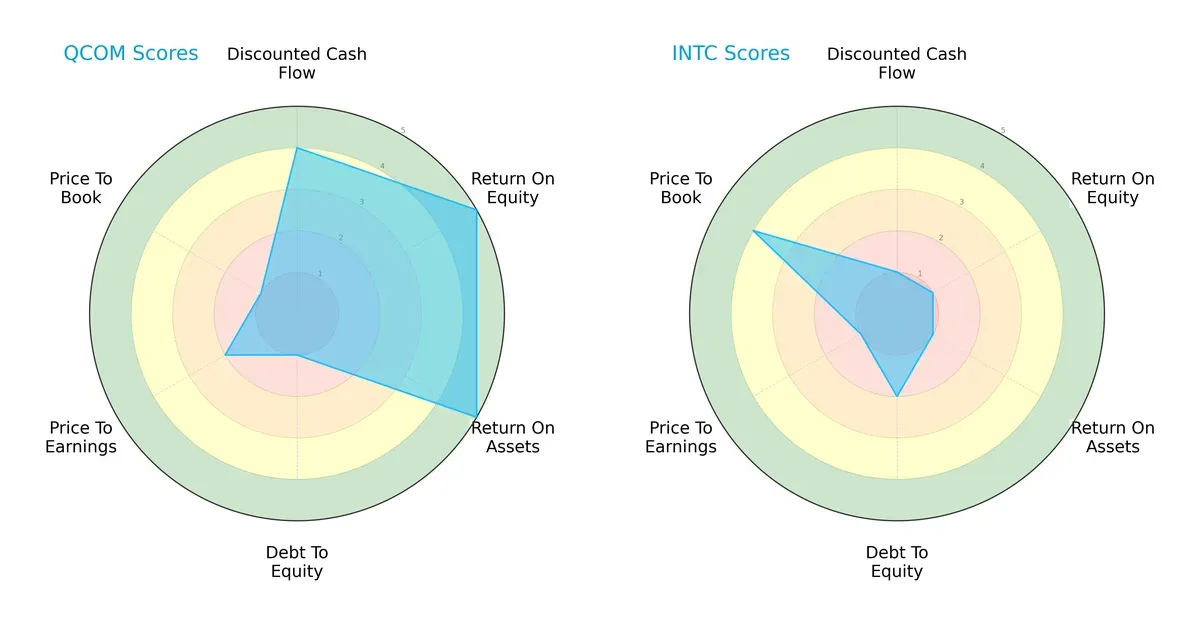
QUALCOMM shows a strong operational edge with very favorable ROE and ROA scores (5 each), indicating efficient profit and asset utilization. Its DCF score (4) suggests reasonable valuation, but its weak debt-to-equity (1) and price-to-book scores (1) expose balance sheet vulnerabilities. Intel, by contrast, presents a more mixed profile with generally low profitability scores (ROE and ROA at 1) and poor valuation metrics, except for a decent price-to-book score (4). QUALCOMM’s profile is more balanced but leans heavily on profitability, while Intel relies more on relative valuation strength.
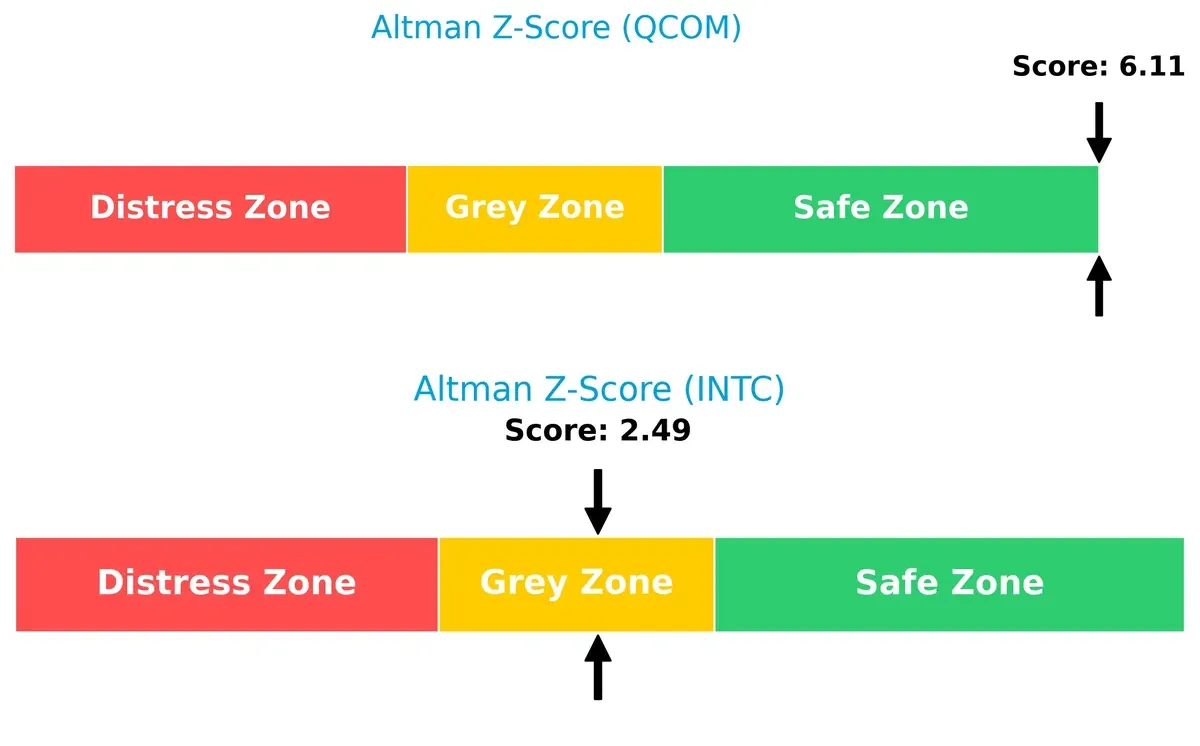
Bankruptcy Risk: Solvency Showdown
QUALCOMM’s Altman Z-Score of 6.11 places it firmly in the safe zone, signaling strong financial stability. Intel’s score of 2.49 falls into the grey zone, indicating moderate bankruptcy risk and caution for long-term survival in this cycle:
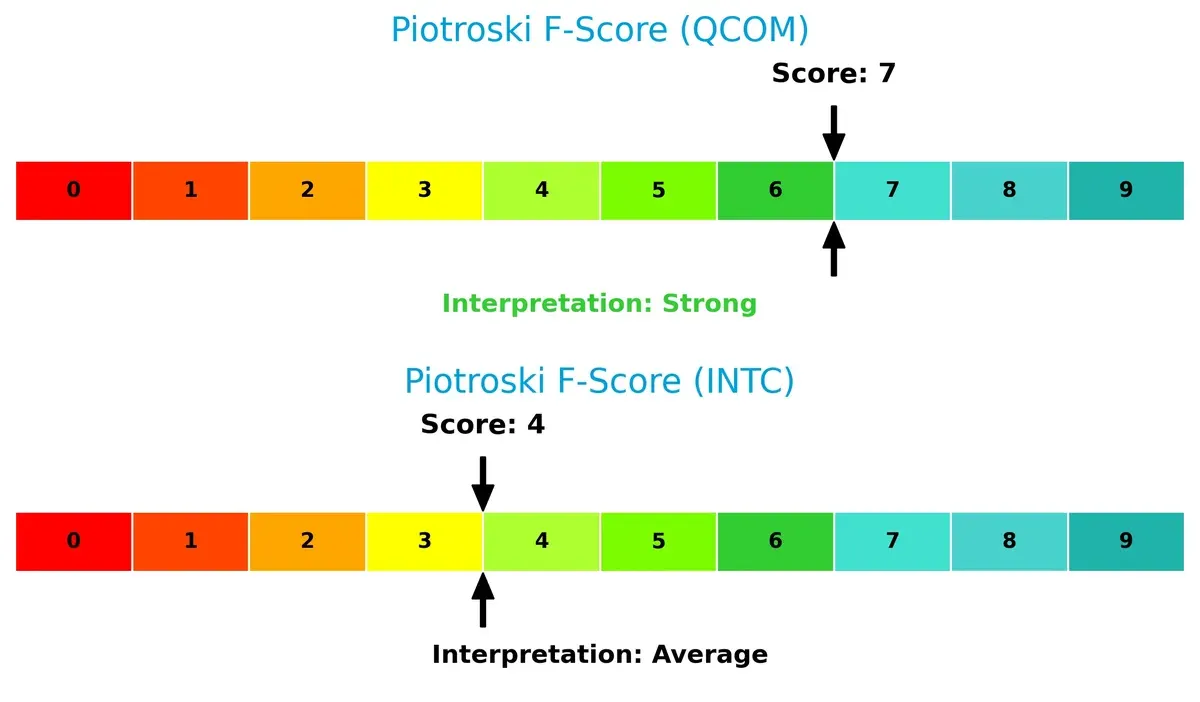
Financial Health: Quality of Operations
QUALCOMM’s Piotroski F-Score of 7 denotes strong financial health with robust internal metrics. Intel’s score of 4 is average, suggesting potential operational red flags and weaker financial quality compared to QUALCOMM:
How are the two companies positioned?
This section dissects QUALCOMM and Intel’s operational DNA by comparing their revenue distribution and internal dynamics. The goal is to confront their economic moats to determine which model offers the most resilient, sustainable advantage today.
Revenue Segmentation: The Strategic Mix
The following visual comparison dissects how QUALCOMM Incorporated and Intel Corporation diversify their income streams and where their primary sector bets lie:
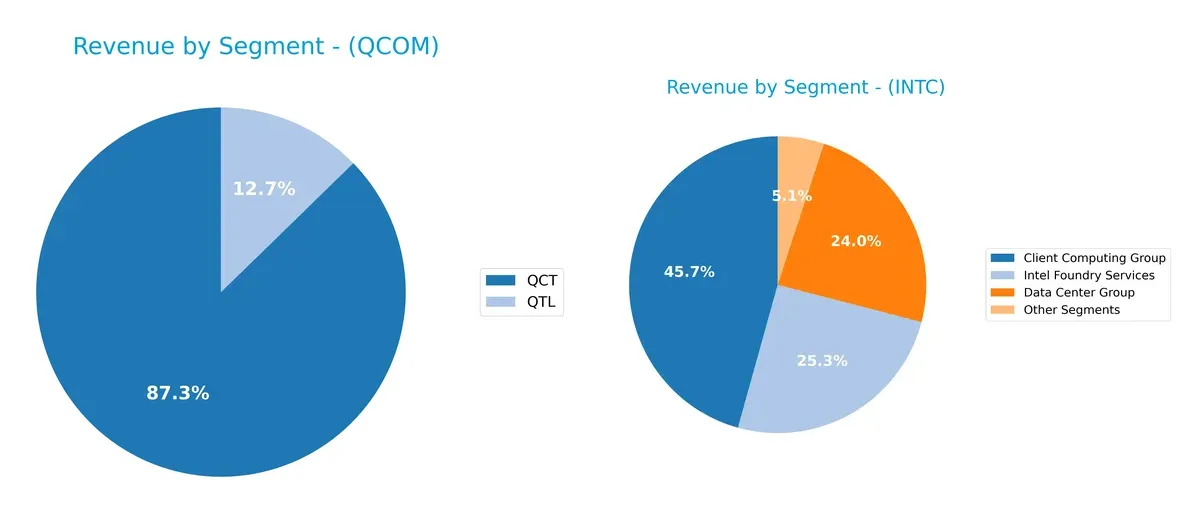
QUALCOMM anchors revenue heavily in QCT at $38.4B in 2025, with QTL trailing at $5.6B, showing a concentrated portfolio. Intel, by contrast, displays a more diversified mix: Client Computing Group leads at $32.2B, but Data Center Group ($16.9B) and Intel Foundry Services ($17.8B) also contribute significantly. Intel’s broader base suggests less concentration risk and a strategic pivot towards foundry services and data infrastructure dominance.
Strengths and Weaknesses Comparison
This table compares the Strengths and Weaknesses of QUALCOMM and Intel Corporation:
QUALCOMM Strengths
- Favorable profitability with 12.5% net margin and 26.1% ROE
- Strong liquidity ratios above 2.0
- Diversified revenue from chip and licensing segments
- Significant global presence, especially in China and Korea
- High fixed asset turnover indicating efficient asset use
Intel Strengths
- Broad product diversification across computing, data center, foundry, and IoT groups
- Solid liquidity with current ratio above 2.0
- Favorable debt-to-equity ratio and low debt-to-assets
- Strong US and Asia-Pacific market presence
- Attractive P/E ratio due to current valuation
QUALCOMM Weaknesses
- Unfavorable valuation multiples with high P/E and P/B ratios
- Neutral debt-to-equity ratio suggests moderate leverage risk
- Asset turnover is average, limiting capital efficiency gains
- Heavy reliance on China market exposes geopolitical risk
Intel Weaknesses
- Negative profitability metrics with net margin and ROE below zero
- Low asset turnover and fixed asset turnover imply inefficiency
- Zero dividend yield removes income appeal for some investors
- Interest coverage ratio is low, potentially constraining financial flexibility
QUALCOMM’s strengths lie in profitability and liquidity, supporting stable operations despite valuation concerns. Intel’s broad diversification and liquidity contrast with its profitability struggles, highlighting challenges in operational efficiency and returns. Both companies face specific risks that should shape their strategic priorities going forward.
The Moat Duel: Analyzing Competitive Defensibility
A structural moat stands as the fortress protecting long-term profits from relentless competitive erosion. Here’s how two chip giants defend their turf:
QUALCOMM Incorporated: Licensing Powerhouse with Intangible Assets
QUALCOMM’s moat centers on its vast patent portfolio and licensing business. This creates stable, high ROIC and margin resilience. Emerging 5G and IoT expansions could deepen its moat but geopolitical risks loom in 2026.
Intel Corporation: Manufacturing Scale with Cost Advantage
Intel relies on manufacturing scale and platform diversity, contrasting QUALCOMM’s IP moat. Its competitive position weakens as ROIC falls below WACC, yet new AI chip initiatives offer a chance to regain ground.
Moat Battle: Intellectual Property vs. Manufacturing Scale
QUALCOMM holds the deeper moat with consistent value creation and licensing strength. Intel’s value destruction trend leaves it less equipped to defend market share despite scale advantages.
Which stock offers better returns?
The past year reveals contrasting price dynamics: QUALCOMM’s shares declined steadily with decelerating losses, while Intel gained ground, accelerating its upward momentum notably since late 2025.
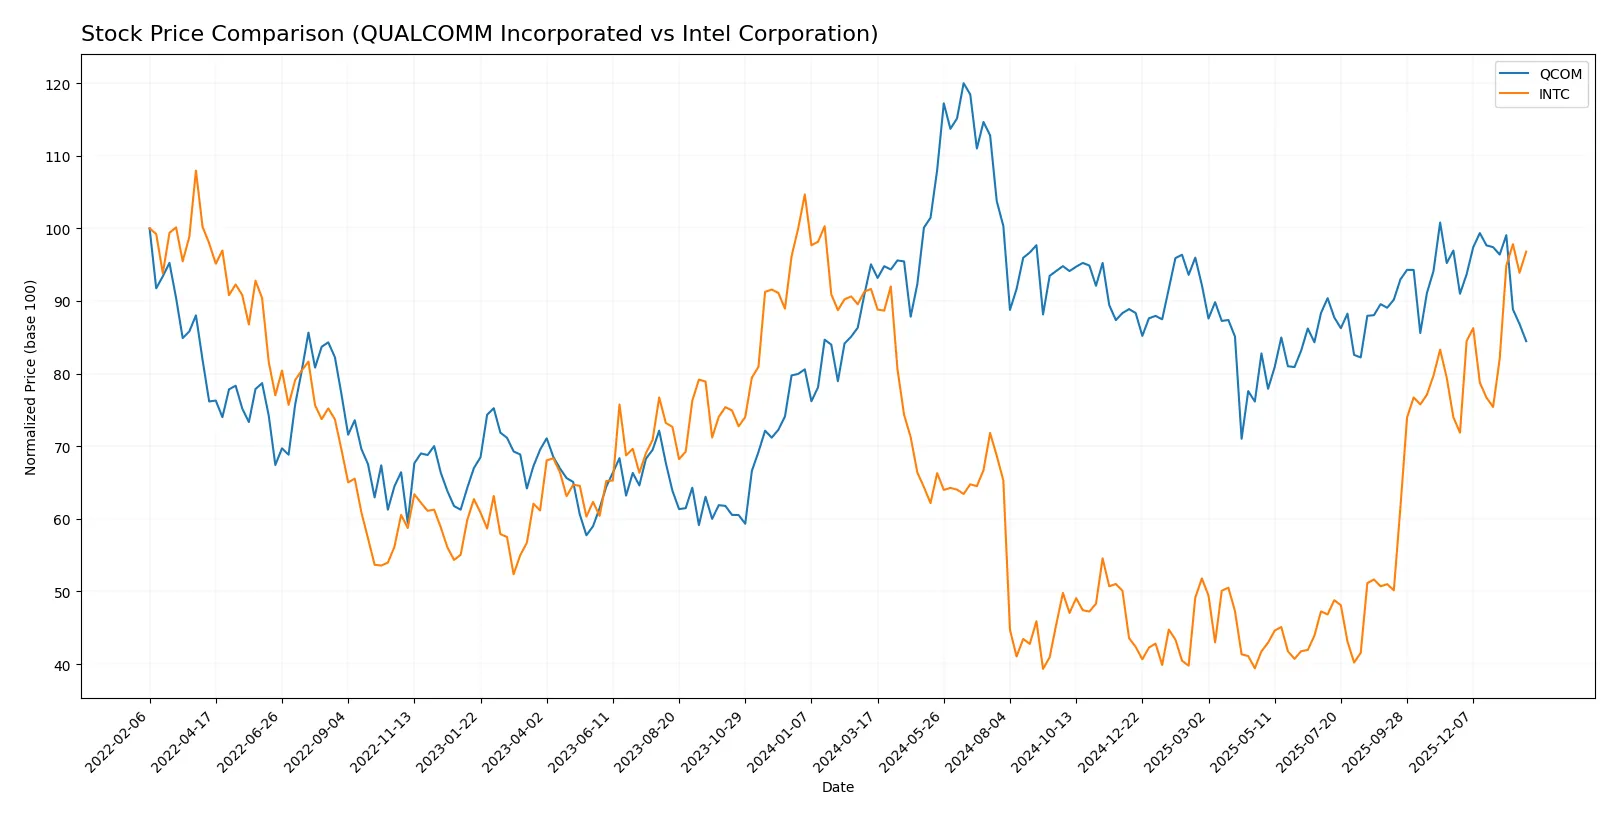
Trend Comparison
QUALCOMM’s stock fell 11.13% over the past 12 months, marking a bearish trend with decelerating losses. Prices fluctuated widely, ranging from 127.46 to 215.33, reflecting elevated volatility.
Intel’s share price increased 5.61% over the same period, indicating a bullish trend with accelerating gains. The price range of 18.89 to 46.96 shows moderate volatility relative to QUALCOMM.
Intel outperformed QUALCOMM in market returns over the past year, delivering a positive trend versus QUALCOMM’s notable decline.
Target Prices
Analysts present a cautiously optimistic consensus for QUALCOMM Incorporated and Intel Corporation.
| Company | Target Low | Target High | Consensus |
|---|---|---|---|
| QUALCOMM Incorporated | 160 | 210 | 182.5 |
| Intel Corporation | 20 | 66 | 46.95 |
QUALCOMM’s target consensus at 182.5 suggests a potential 20% upside from its 151.59 price, indicating confidence in its semiconductor moat. Intel’s consensus near 47 compares closely with its 46.47 price, reflecting market skepticism amid competitive pressures.

Don’t Let Luck Decide Your Entry Point
Optimize your entry points with our advanced ProRealTime indicators. You’ll get efficient buy signals with precise price targets for maximum performance. Start outperforming now!
How do institutions grade them?
QUALCOMM Incorporated Grades
Here are recent institutional grades for QUALCOMM Incorporated:
| Grading Company | Action | New Grade | Date |
|---|---|---|---|
| UBS | Maintain | Neutral | 2026-01-26 |
| Mizuho | Maintain | Neutral | 2026-01-26 |
| Mizuho | Downgrade | Neutral | 2026-01-09 |
| B of A Securities | Maintain | Buy | 2025-11-06 |
| Rosenblatt | Maintain | Buy | 2025-11-06 |
| Wells Fargo | Maintain | Underweight | 2025-11-06 |
| Mizuho | Maintain | Outperform | 2025-11-06 |
| Piper Sandler | Maintain | Overweight | 2025-11-06 |
| UBS | Maintain | Neutral | 2025-11-06 |
| JP Morgan | Maintain | Overweight | 2025-11-04 |
Intel Corporation Grades
Here are recent institutional grades for Intel Corporation:
| Grading Company | Action | New Grade | Date |
|---|---|---|---|
| RBC Capital | Maintain | Sector Perform | 2026-01-23 |
| Keybanc | Maintain | Overweight | 2026-01-23 |
| Evercore ISI Group | Maintain | In Line | 2026-01-23 |
| Needham | Maintain | Hold | 2026-01-23 |
| Benchmark | Maintain | Buy | 2026-01-23 |
| Rosenblatt | Maintain | Sell | 2026-01-23 |
| UBS | Maintain | Neutral | 2026-01-23 |
| Citigroup | Maintain | Neutral | 2026-01-23 |
| Stifel | Maintain | Hold | 2026-01-23 |
| Wedbush | Maintain | Neutral | 2026-01-23 |
Which company has the best grades?
QUALCOMM generally receives stronger buy and outperform ratings, while Intel’s grades mix buy, hold, and sell opinions. This divergence may reflect varied analyst confidence, affecting investor sentiment and portfolio risk perception.
Risks specific to each company
The following categories identify the critical pressure points and systemic threats facing both firms in the 2026 market environment:
1. Market & Competition
QUALCOMM Incorporated
- Strong presence in wireless technology licensing and chips sustains competitive edge.
Intel Corporation
- Struggles with profitability amid fierce competition and market share loss.
2. Capital Structure & Debt
QUALCOMM Incorporated
- Moderate debt level with strong interest coverage indicates manageable financial risk.
Intel Corporation
- Lower debt but weaker interest coverage signals potential strain in servicing debt.
3. Stock Volatility
QUALCOMM Incorporated
- Beta at 1.21 reflects moderate volatility typical for semiconductor firms.
Intel Corporation
- Higher beta of 1.35 indicates greater stock price sensitivity and risk.
4. Regulatory & Legal
QUALCOMM Incorporated
- Licensing business faces ongoing patent litigation risks that can impact revenues.
Intel Corporation
- Regulatory scrutiny in multiple segments creates uncertainty and potential compliance costs.
5. Supply Chain & Operations
QUALCOMM Incorporated
- Efficient asset turnover and integrated supply chain sustain operational resilience.
Intel Corporation
- Low asset turnover highlights operational inefficiencies and slower asset utilization.
6. ESG & Climate Transition
QUALCOMM Incorporated
- Proactive investments in AI and 5G align with climate-conscious innovation.
Intel Corporation
- ESG efforts less visible, with slower transition to sustainable practices.
7. Geopolitical Exposure
QUALCOMM Incorporated
- Global wireless licensing exposes firm to cross-border trade tensions.
Intel Corporation
- Diverse product lines increase exposure to global geopolitical disruptions.
Which company shows a better risk-adjusted profile?
QUALCOMM’s most impactful risk stems from patent litigation affecting licensing revenue. Intel faces critical operational inefficiencies and profitability struggles. QUALCOMM’s robust financial health and strong Altman Z-Score (6.1, safe zone) contrast with Intel’s grey zone (2.5). Recent data show Intel’s negative net margin and weak returns, underscoring higher risk. Overall, QUALCOMM offers a better risk-adjusted profile in 2026’s volatile semiconductor landscape.
Final Verdict: Which stock to choose?
QUALCOMM Incorporated’s superpower lies in its robust cash-generating engine and strong economic moat. It consistently creates value with high returns on invested capital, despite a recent decline in profitability. The key point of vigilance is its premium valuation, which demands conviction. It suits portfolios seeking aggressive growth exposure.
Intel Corporation’s strategic moat is rooted in its ongoing transformation and scale in semiconductor manufacturing. It offers a comparatively safer profile with lower leverage and improving operating metrics, though it currently struggles with value destruction and profitability. Intel fits investors targeting growth at a reasonable price with a tolerance for turnaround risk.
If you prioritize a proven cash machine with a strong moat and are comfortable with premium valuation, QUALCOMM outshines Intel due to superior capital efficiency and income quality. However, if you seek potential value in a restructuring play with better recent price momentum and lower valuation, Intel offers better stability but with elevated execution risk.
Disclaimer: Investment carries a risk of loss of initial capital. The past performance is not a reliable indicator of future results. Be sure to understand risks before making an investment decision.
Go Further
I encourage you to read the complete analyses of QUALCOMM Incorporated and Intel Corporation to enhance your investment decisions: