Home > Comparison > Technology > MSFT vs INFA
The strategic rivalry between Microsoft Corporation and Informatica Inc. shapes the evolution of software infrastructure. Microsoft, a tech behemoth, integrates cloud, productivity, and personal computing ecosystems. Informatica, a specialized data management innovator, focuses on AI-powered multi-cloud solutions. This head-to-head pits diversified scale against focused innovation. This analysis will identify which trajectory offers superior risk-adjusted returns for a balanced portfolio in today’s dynamic technology sector.
Table of contents
Companies Overview
Microsoft and Informatica stand as pillars in the software infrastructure market, shaping enterprise technology landscapes.
Microsoft Corporation: Global Software Infrastructure Titan
Microsoft dominates with a diversified software portfolio spanning productivity tools, cloud computing, and personal computing devices. Its core revenue streams derive from cloud services like Azure, Office 365 subscriptions, and Windows licensing. In 2026, Microsoft sharpens its strategic focus on expanding Intelligent Cloud offerings while integrating AI to enhance enterprise solutions.
Informatica Inc.: AI-Driven Data Management Innovator
Informatica specializes in an AI-powered data integration platform that unifies and manages enterprise data across multi-cloud and hybrid environments. Its revenue hinges on data integration, governance, and quality products. The company’s 2026 strategy centers on enhancing interoperability and compliance tools to meet growing data privacy and regulatory demands.
Strategic Collision: Similarities & Divergences
Both firms invest heavily in cloud infrastructure and enterprise software, yet Microsoft embraces a broad ecosystem, while Informatica zeroes in on specialized data management. Their primary battleground lies in enterprise digital transformation, with Microsoft leveraging scale and platform breadth, and Informatica focusing on data accuracy and governance. These differences create distinct investment profiles: Microsoft offers scale and diversification; Informatica promises niche specialization and growth potential.
Income Statement Comparison
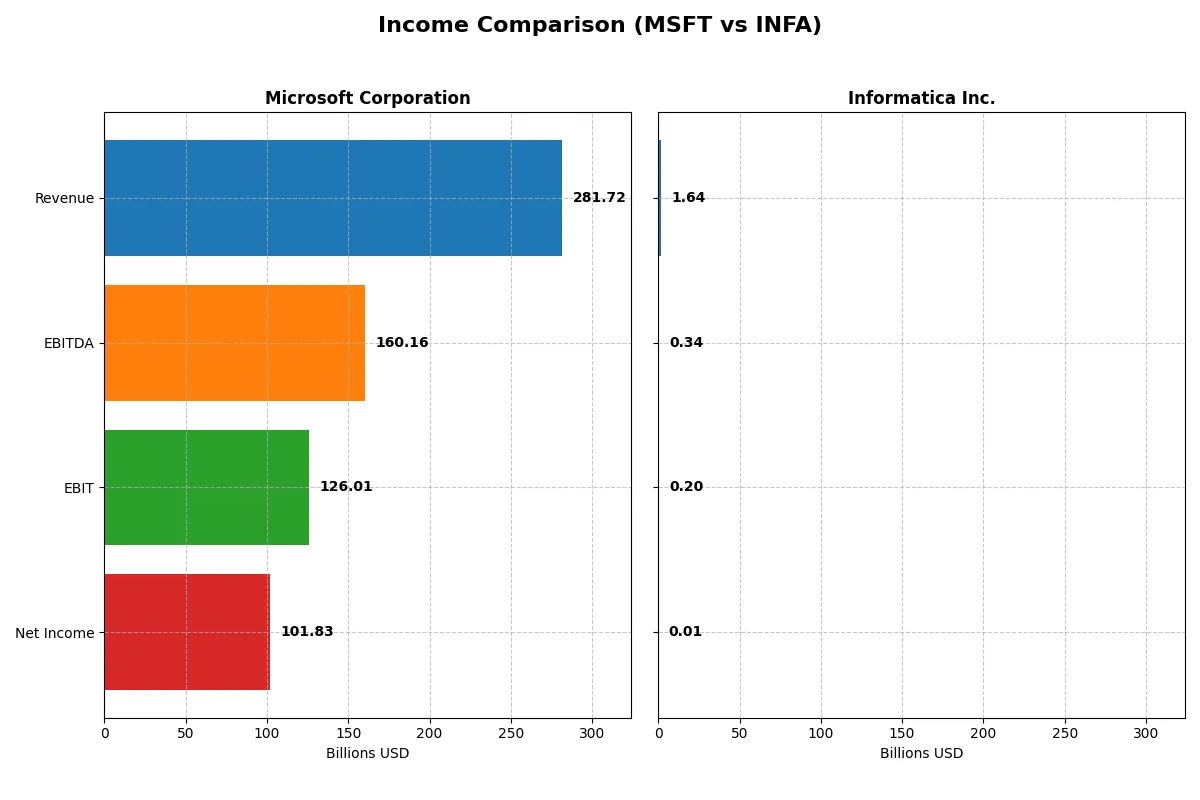
This data dissects the core profitability and scalability of both corporate engines to reveal who dominates the bottom line:
| Metric | Microsoft Corporation (MSFT) | Informatica Inc. (INFA) |
|---|---|---|
| Revenue | 282B | 1.64B |
| Cost of Revenue | 87.8B | 326M |
| Operating Expenses | 65.4B | 1.19B |
| Gross Profit | 194B | 1.31B |
| EBITDA | 160B | 339M |
| EBIT | 126B | 199M |
| Interest Expense | 2.39B | 146M |
| Net Income | 102B | 9.93M |
| EPS | 13.7 | 0.0329 |
| Fiscal Year | 2025 | 2024 |
Income Statement Analysis: The Bottom-Line Duel
This income statement comparison exposes the core operational efficiency and profitability momentum of two distinct corporate engines.
Microsoft Corporation Analysis
Microsoft’s revenue surged from 168B in 2021 to 282B in 2025, marking a robust 68% growth. Net income followed suit, rising from 61B to 102B, reflecting strong bottom-line expansion. Gross margin remains healthy at 68.8%, while net margin stands at a solid 36.2%. The latest fiscal year highlights efficient cost control and sustained profitability momentum.
Informatica Inc. Analysis
Informatica grew revenue modestly from 1.32B in 2020 to 1.64B in 2024, a 24% increase. Net income improved dramatically, swinging from a negative 168M in 2020 to a slight profit of 10M in 2024. Gross margin is strong at 80.1%, but net margin remains thin at 0.6%. The latest year shows a significant turnaround in earnings, supported by a sharp EBIT growth of 168%.
Margin Power vs. Earnings Scale
Microsoft dominates with a commanding scale and consistent profitability, boasting a net margin over 36%, compared to Informatica’s near breakeven net margin. Informatica’s rapid earnings recovery signals potential but remains far smaller in absolute terms. For investors, Microsoft’s blend of scale and margin strength offers a more stable and commanding income profile.
Financial Ratios Comparison
These vital ratios act as a diagnostic tool to expose the underlying fiscal health, valuation premiums, and capital efficiency of the companies compared:
| Ratios | Microsoft Corporation (MSFT) | Informatica Inc. (INFA) |
|---|---|---|
| ROE | 29.6% | 0.4% |
| ROIC | 22.0% | 0.6% |
| P/E | 36.3 | 788.0 |
| P/B | 10.8 | 3.4 |
| Current Ratio | 1.35 | 1.82 |
| Quick Ratio | 1.35 | 1.82 |
| D/E | 0.18 | 0.81 |
| Debt-to-Assets | 9.8% | 35.2% |
| Interest Coverage | 53.9 | 0.87 |
| Asset Turnover | 0.46 | 0.31 |
| Fixed Asset Turnover | 1.23 | 8.75 |
| Payout ratio | 23.6% | 0.12% |
| Dividend yield | 0.65% | 0.00015% |
| Fiscal Year | 2025 | 2024 |
Efficiency & Valuation Duel: The Vital Signs
Financial ratios act as a company’s DNA, revealing hidden risks and operational excellence that raw numbers cannot convey alone.
Microsoft Corporation
Microsoft boasts a strong return on equity of 29.65% and net margin of 36.15%, signaling robust profitability and operational efficiency. However, its P/E ratio at 36.31 suggests the stock trades at a premium, reflecting high market expectations. Shareholders receive modest dividends with a 0.65% yield, while the company reinvests heavily in R&D, fueling sustainable growth.
Informatica Inc.
Informatica’s detailed ratio data is unavailable, preventing precise profitability and valuation analysis. The lack of key financial metrics obscures insights on operational efficiency and shareholder returns. This data gap raises caution about assessing its risk profile and investment quality compared to well-documented peers like Microsoft.
Premium Valuation vs. Data Transparency
Microsoft offers a transparent, slightly favorable ratio profile with clear profitability but a stretched valuation. Informatica’s missing ratio data limits risk assessment, increasing uncertainty. Investors seeking clarity and operational strength will gravitate toward Microsoft, while those comfortable with opacity face higher risk with Informatica.
Which one offers the Superior Shareholder Reward?
I compare Microsoft and Informatica’s distribution strategies to find the superior shareholder reward. Microsoft offers a 0.65% dividend yield with a sustainable 24% payout ratio, backed by strong free cash flow of 9.6B and robust buybacks. Informatica barely pays dividends, focusing on reinvestment with minimal payout and modest buybacks. Microsoft’s balanced dividend and aggressive buyback program provide a more attractive total return profile for 2026 investors.
Comparative Score Analysis: The Strategic Profile
The radar chart reveals the fundamental DNA and trade-offs of Microsoft Corporation and Informatica Inc., highlighting their core financial strengths and weaknesses:

Microsoft demonstrates a strong return on equity (5) and assets (5), indicating efficient capital and asset use. However, its valuation scores are weaker (P/E at 2, P/B at 1), suggesting premium pricing. Microsoft shows a balanced financial risk profile (debt/equity score 3) but moderate DCF potential (3). Informatica lacks comparable data, so I cannot assess its profile here.
—
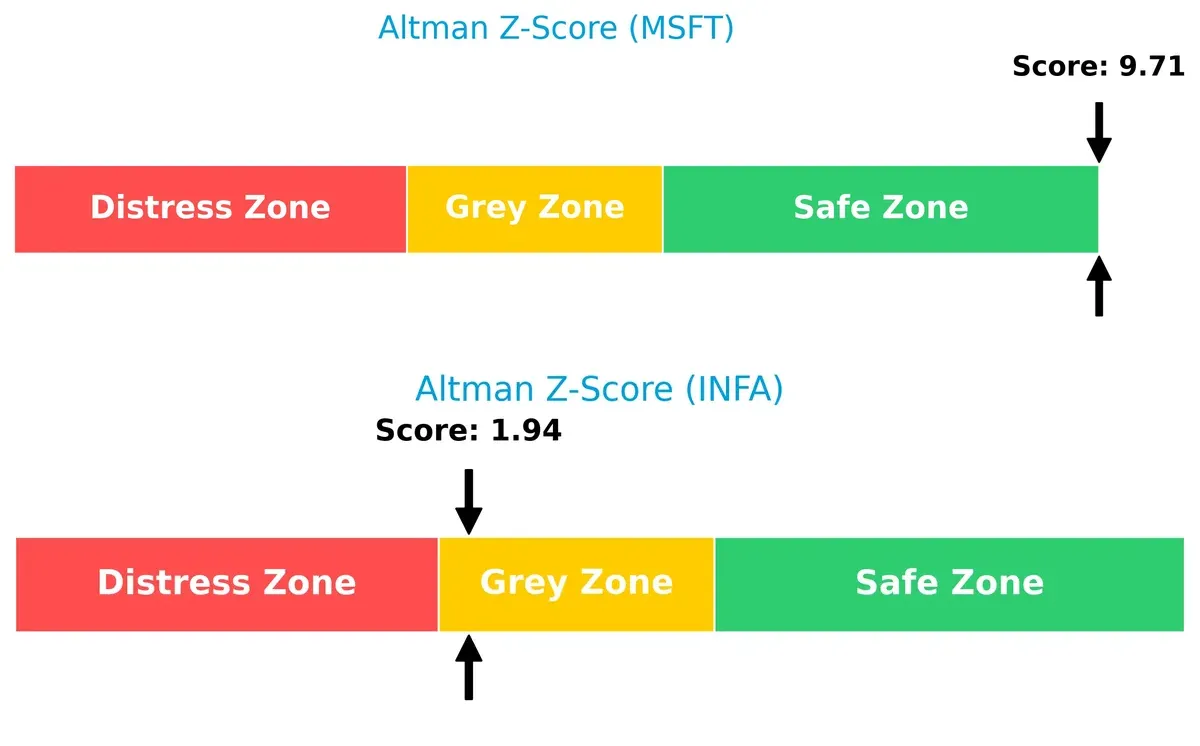
Bankruptcy Risk: Solvency Showdown
Microsoft’s Altman Z-Score of 9.7 places it firmly in the safe zone, signaling low bankruptcy risk. Informatica’s score of 1.9 sits in the grey zone, implying moderate financial distress risk in this cycle:
—
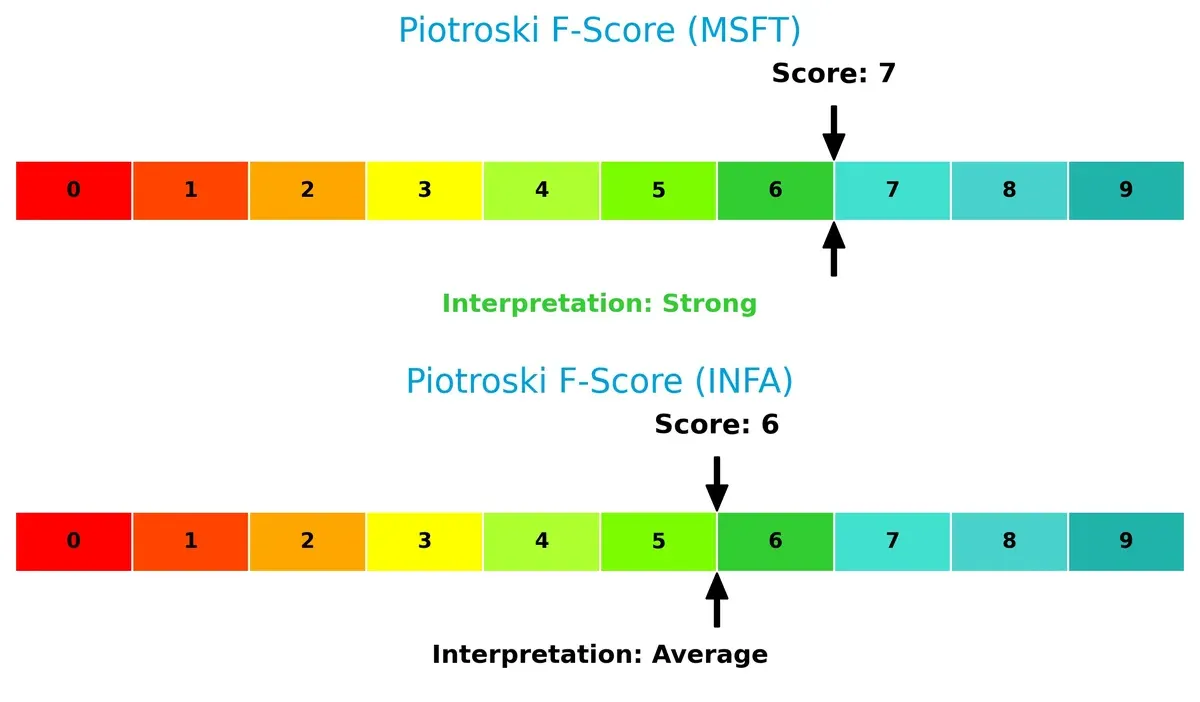
Financial Health: Quality of Operations
Microsoft’s Piotroski F-Score of 7 indicates strong financial health with solid internal metrics. Informatica’s score of 6 is average, suggesting some operational weaknesses compared to Microsoft:
How are the two companies positioned?
This section dissects the operational DNA of Microsoft and Informatica by comparing their revenue distribution and internal dynamics. The goal is to confront their economic moats and reveal which model offers the most resilient competitive advantage today.
Revenue Segmentation: The Strategic Mix
This visual comparison dissects how Microsoft Corporation and Informatica Inc. diversify their income streams and where their primary sector bets lie:
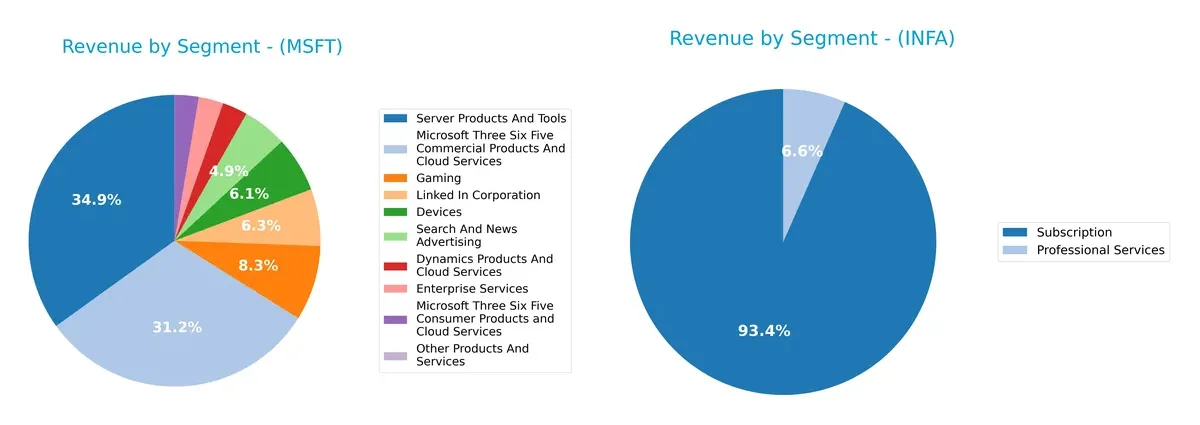
Microsoft dwarfs Informatica with a vast, diversified revenue base spanning cloud services, gaming, professional networks, and devices. Microsoft’s Server Products and Tools segment alone hits $98B, anchoring its infrastructure dominance. Informatica relies heavily on subscription revenue around $1.1B, signaling a focused SaaS model but exposing it to concentration risk. Microsoft’s ecosystem lock-in contrasts with Informatica’s specialized, subscription-driven strategy.
Strengths and Weaknesses Comparison
This table compares the Strengths and Weaknesses of Microsoft Corporation and Informatica Inc.:
Microsoft Strengths
- Highly diversified product segments including cloud, gaming, and enterprise services
- Strong global presence with nearly equal US and Non-US revenues
- Favorable profitability metrics: net margin 36%, ROE 29.6%, ROIC 22%
- Low leverage with debt-to-assets below 10%
- High innovation reflected in cloud and server products
Informatica Strengths
- Focused subscription and professional services revenue streams
- Geographic presence across North America, EMEA, Asia Pacific, and Latin America
- Steady subscription revenue growth supports recurring income
Microsoft Weaknesses
- High valuation multiples: P/E 36.3, P/B 10.8 may limit upside
- Moderate liquidity with current ratio 1.35 is neutral
- Asset turnover below industry norms at 0.46 suggests efficiency challenges
- Low dividend yield at 0.65% may deter income investors
Informatica Weaknesses
- Limited public financial data restricts ratio analysis
- Narrow product diversification compared to large peers
- Smaller scale and market share relative to industry leaders
Microsoft’s strengths lie in its scale, diversification, and financial robustness, which underpin its competitive moat. Informatica’s focused business model offers stability but lacks the breadth and financial transparency of a larger peer. These contrasts highlight different strategic positions within the software industry.
The Moat Duel: Analyzing Competitive Defensibility
A durable structural moat is the only reliable shield against relentless competitive pressure eroding long-term profits:
Microsoft Corporation: Ecosystem Lock-in Powerhouse
Microsoft’s moat lies in its vast ecosystem and switching costs. Its high ROIC over WACC (13.3%) and stable margins reveal value creation. Azure and AI innovations in 2026 could deepen this moat.
Informatica Inc.: Data Integration Niche Specialist
Informatica’s competitive edge comes from its AI-driven data unification platform, contrasting Microsoft’s scale. While smaller, it shows strong margin growth and could disrupt markets through multi-cloud expansion in 2026.
Ecosystem Lock-in vs. AI-enabled Specialization
Microsoft commands a wider moat with consistent value creation despite a slight ROIC decline. Informatica’s moat is narrower but promising in growth potential. Microsoft remains better positioned to defend market share long-term.
Which stock offers better returns?
Over the past year, Microsoft’s stock gained 5.93%, showing a decelerating bullish trend, while Informatica’s stock fell 12.68%, reflecting accelerating bearish momentum.
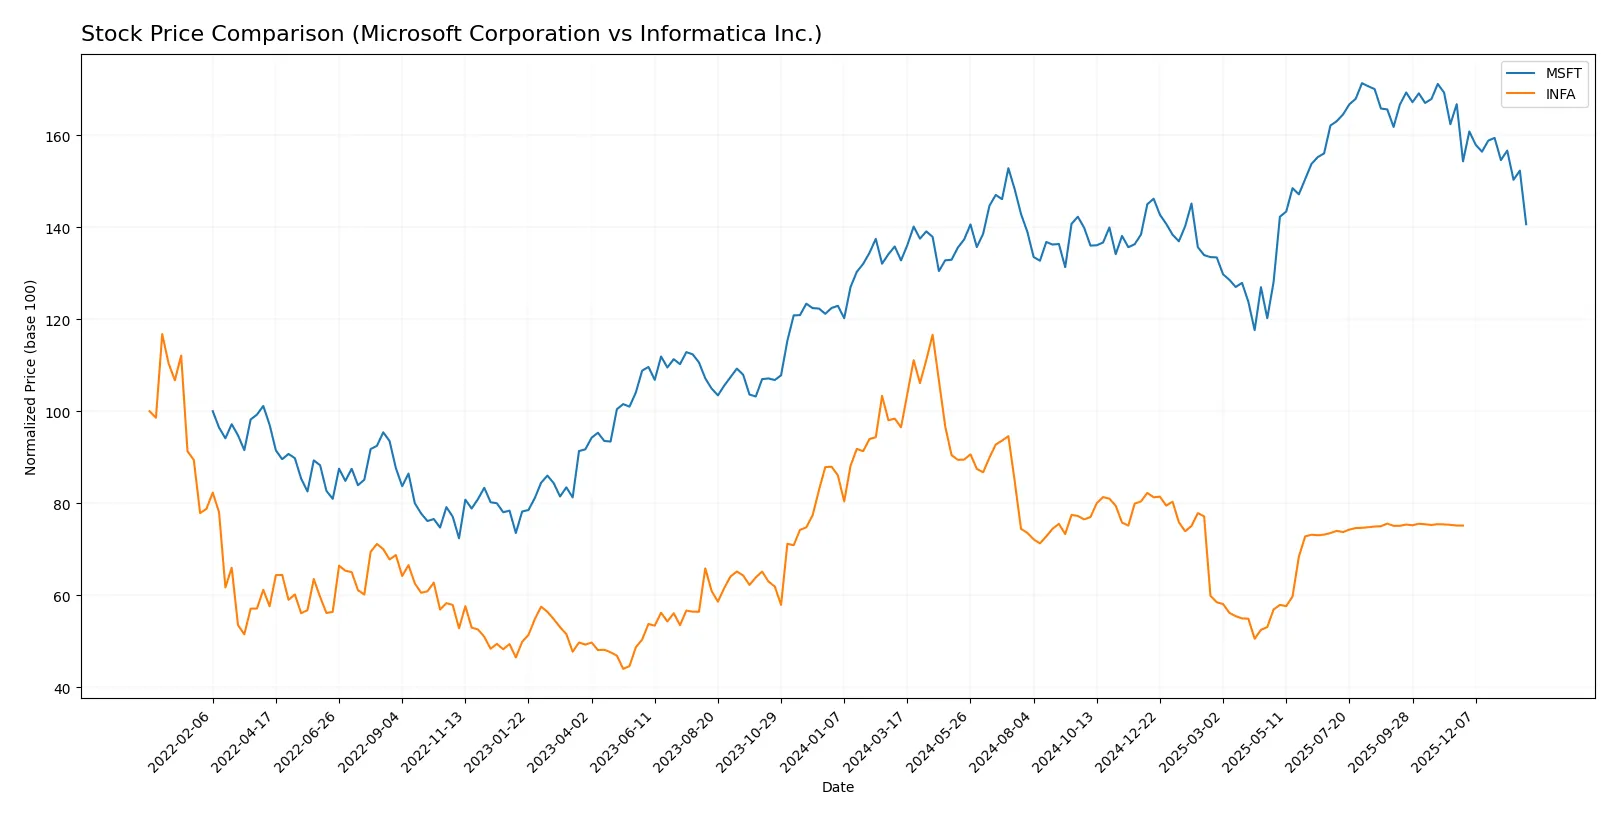
Trend Comparison
Microsoft’s stock rose 5.93% over 12 months, marking a bullish trend with decelerating gains and high volatility (std dev 41.93). It peaked at 524.11 and troughed at 359.84.
Informatica’s stock declined 12.68% over the same period, confirming a bearish trend with accelerating weakness and low volatility (std dev 4.46). Its price ranged between 16.67 and 38.48.
Microsoft outperformed Informatica, delivering the highest market returns with a positive trend versus Informatica’s sustained decline.
Target Prices
Analysts show a bullish consensus with substantial upside potential for these technology firms.
| Company | Target Low | Target High | Consensus |
|---|---|---|---|
| Microsoft Corporation | 450 | 675 | 600.04 |
| Informatica Inc. | 27 | 27 | 27 |
Microsoft’s target consensus at 600.04 suggests a 40% upside from the current 430.29 price. Informatica’s flat target of 27 indicates limited price movement expectations.

Don’t Let Luck Decide Your Entry Point
Optimize your entry points with our advanced ProRealTime indicators. You’ll get efficient buy signals with precise price targets for maximum performance. Start outperforming now!
How do institutions grade them?
Microsoft Corporation Grades
The following table summarizes recent institutional grades for Microsoft Corporation:
| Grading Company | Action | New Grade | Date |
|---|---|---|---|
| Citigroup | Maintain | Buy | 2026-01-30 |
| Scotiabank | Maintain | Sector Outperform | 2026-01-29 |
| Wells Fargo | Maintain | Overweight | 2026-01-29 |
| RBC Capital | Maintain | Outperform | 2026-01-29 |
| Stifel | Maintain | Buy | 2026-01-29 |
| Evercore ISI Group | Maintain | Outperform | 2026-01-29 |
| Keybanc | Maintain | Overweight | 2026-01-29 |
| Piper Sandler | Maintain | Overweight | 2026-01-29 |
| DA Davidson | Maintain | Buy | 2026-01-29 |
| Cantor Fitzgerald | Maintain | Overweight | 2026-01-29 |
Informatica Inc. Grades
The following table summarizes recent institutional grades for Informatica Inc.:
| Grading Company | Action | New Grade | Date |
|---|---|---|---|
| Guggenheim | Downgrade | Neutral | 2025-08-07 |
| UBS | Maintain | Neutral | 2025-08-07 |
| Baird | Maintain | Neutral | 2025-05-28 |
| JP Morgan | Downgrade | Neutral | 2025-05-28 |
| RBC Capital | Maintain | Sector Perform | 2025-05-28 |
| Wolfe Research | Downgrade | Peer Perform | 2025-05-28 |
| Wells Fargo | Maintain | Equal Weight | 2025-05-28 |
| Truist Securities | Downgrade | Hold | 2025-05-28 |
| RBC Capital | Maintain | Sector Perform | 2025-05-27 |
| UBS | Maintain | Neutral | 2025-05-16 |
Which company has the best grades?
Microsoft Corporation consistently receives strong buy and outperform ratings from multiple reputable institutions. Informatica Inc. shows more neutral and downgraded ratings. This contrast may influence investors seeking higher conviction from analyst opinions.
Risks specific to each company
The following categories identify the critical pressure points and systemic threats facing both firms in the 2026 market environment:
1. Market & Competition
Microsoft Corporation
- Dominates with a diversified product portfolio and strong cloud presence. Faces intense competition from other tech giants.
Informatica Inc.
- Competes in a niche AI-powered data management market but with smaller scale and less brand recognition.
2. Capital Structure & Debt
Microsoft Corporation
- Maintains a conservative debt-to-equity ratio of 0.18, indicating low financial risk. Strong interest coverage at 52.8x.
Informatica Inc.
- Limited public data; likely higher leverage risk given smaller size and recent IPO status.
3. Stock Volatility
Microsoft Corporation
- Beta of 1.07 suggests moderate volatility, aligned with the Nasdaq-100 tech sector average.
Informatica Inc.
- Beta of 1.14 indicates slightly higher volatility, reflecting smaller market cap and less liquidity.
4. Regulatory & Legal
Microsoft Corporation
- Faces regulatory scrutiny due to size and market power, especially in privacy and antitrust.
Informatica Inc.
- Regulatory risks concentrated on data privacy and compliance; less exposure to antitrust challenges.
5. Supply Chain & Operations
Microsoft Corporation
- Complex global supply chains for hardware and cloud infrastructure; resilient but exposed to geopolitical disruptions.
Informatica Inc.
- Primarily software-based with fewer physical supply chain risks but depends heavily on cloud infrastructure providers.
6. ESG & Climate Transition
Microsoft Corporation
- Strong ESG commitments with significant investments in carbon neutrality and sustainability initiatives.
Informatica Inc.
- ESG efforts less visible; potential risk if investor pressure on sustainability intensifies.
7. Geopolitical Exposure
Microsoft Corporation
- Global operations expose it to US-China tensions and broader geopolitical risks affecting cloud and software services.
Informatica Inc.
- Mainly US-focused but growing international presence could increase geopolitical vulnerability.
Which company shows a better risk-adjusted profile?
Microsoft’s robust capital structure and diversified global footprint create a more favorable risk-adjusted profile. Informatica’s smaller scale and limited data transparency heighten risk, especially regarding leverage and regulatory compliance.
Microsoft’s primary risk lies in regulatory and geopolitical pressures given its size and global reach. Informatica faces its greatest risk in financial stability and market volatility, compounded by its grey zone Altman Z-score. The recent strong Altman Z-score and high interest coverage for Microsoft justify my confidence despite valuation concerns.
Final Verdict: Which stock to choose?
Microsoft’s superpower lies in its unparalleled capital efficiency and robust cash flow generation. It commands a strong economic moat with consistent value creation despite a slight dip in ROIC. A point of vigilance is its elevated valuation multiples, which could pressure returns. It suits portfolios aiming for Aggressive Growth with a tolerance for premium pricing.
Informatica’s strategic moat centers on its specialized data management niche and improving operational metrics. Compared to Microsoft, it offers a more cautious risk profile but lacks the scale and profitability consistency. Its recent earnings growth signals potential upside, fitting well into GARP (Growth at a Reasonable Price) strategies seeking value in smaller tech players.
If you prioritize dominant market positioning and sustainable free cash flow, Microsoft is the compelling choice due to its proven ability to generate shareholder value. However, if you seek value-driven growth with a margin of safety in a niche segment, Informatica offers better stability at a lower entry point, albeit with higher execution risk.
Disclaimer: Investment carries a risk of loss of initial capital. The past performance is not a reliable indicator of future results. Be sure to understand risks before making an investment decision.
Go Further
I encourage you to read the complete analyses of Microsoft Corporation and Informatica Inc. to enhance your investment decisions: