Navigating the evolving healthcare diagnostics sector requires a clear understanding of key players like IDEXX Laboratories, Inc. (IDXX) and RadNet, Inc. (RDNT). Both companies operate within medical diagnostics but focus on distinct yet overlapping services—IDEXX excels in veterinary and water testing diagnostics, while RadNet specializes in outpatient diagnostic imaging and AI-driven radiology solutions. This article will help you determine which company offers the most compelling investment opportunity for your portfolio.
Table of contents
Companies Overview
I will begin the comparison between IDEXX Laboratories, Inc. and RadNet, Inc. by providing an overview of these two companies and their main differences.
IDEXX Laboratories Overview
IDEXX Laboratories, Inc. operates globally in the healthcare sector, focusing on veterinary diagnostics, water testing, and biomedical research products. The company develops and distributes point-of-care diagnostic instruments, consumables, and software solutions for companion animals, livestock, and poultry markets. Headquartered in Westbrook, Maine, IDEXX serves veterinary clinics and research communities, emphasizing innovative diagnostic technologies and health monitoring services.
RadNet Overview
RadNet, Inc. is a healthcare company specializing in outpatient diagnostic imaging services across the United States. It offers a broad range of imaging procedures, including MRI, CT, PET, ultrasound, and mammography. RadNet also develops computerized imaging systems and AI solutions to enhance cancer diagnosis. Based in Los Angeles, California, the company operates 347 imaging centers, focusing on multi-modality diagnostics and technology-driven radiology services.
Key similarities and differences
Both IDEXX and RadNet operate within the medical diagnostics and research industry, serving healthcare needs with advanced technologies. IDEXX primarily focuses on veterinary diagnostics and water testing, while RadNet concentrates on human outpatient imaging services and AI-enhanced radiology. Although both have a significant presence in healthcare diagnostics, their business models diverge in target markets and service offerings, with IDEXX leaning toward veterinary and environmental testing and RadNet toward human medical imaging.
Income Statement Comparison
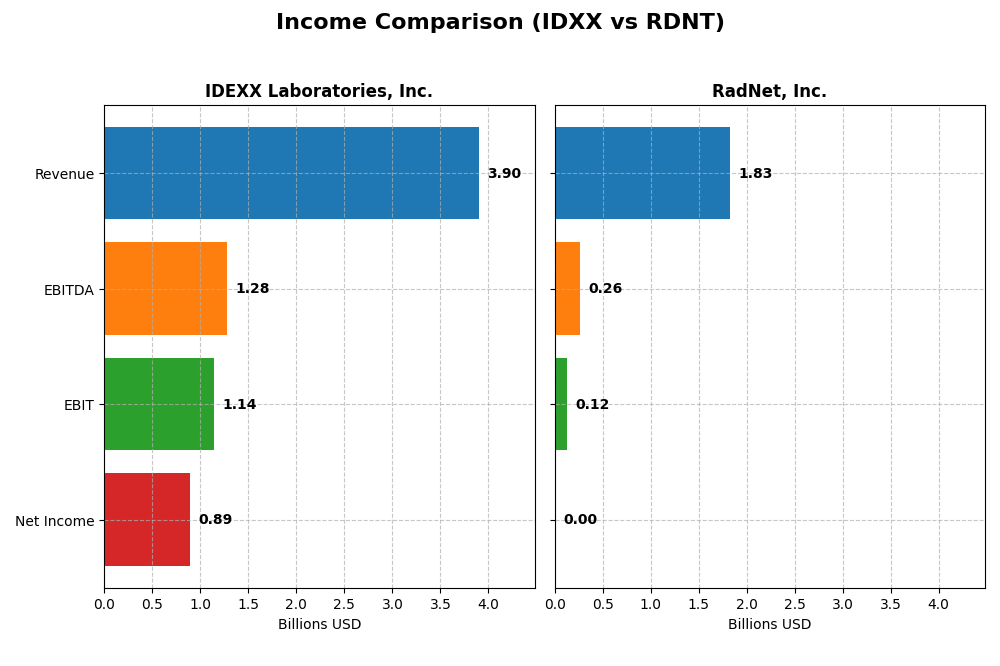
The table below compares the key income statement metrics for IDEXX Laboratories, Inc. and RadNet, Inc. for the fiscal year 2024, highlighting their financial performance in the medical diagnostics sector.
| Metric | IDEXX Laboratories, Inc. (IDXX) | RadNet, Inc. (RDNT) |
|---|---|---|
| Market Cap | 57B | 6B |
| Revenue | 3.90B | 1.83B |
| EBITDA | 1.28B | 263M |
| EBIT | 1.14B | 125M |
| Net Income | 888M | 2.79M |
| EPS | 10.77 | 0.038 |
| Fiscal Year | 2024 | 2024 |
Income Statement Interpretations
IDEXX Laboratories, Inc.
Between 2020 and 2024, IDEXX Laboratories showed a steady revenue increase from $2.71B to $3.90B and net income growth from $582M to $888M. Margins remained strong with a gross margin above 61% and net margin around 23%. In 2024, revenue growth slowed to 6.46% with net margin slightly declining, though EPS rose by 6.06%, indicating solid profitability.
RadNet, Inc.
RadNet’s revenue rose significantly from $1.07B in 2020 to $1.83B in 2024, with net income improving from a loss of $14.8M to a modest profit of $2.8M. Margins remained slim, with a gross margin near 14% and net margin around 0.15%. In 2024, revenue and EBIT growth remained favorable, but net margin and EPS declined, reflecting ongoing profitability challenges.
Which one has the stronger fundamentals?
IDEXX Laboratories presents stronger fundamentals with higher and stable margins, consistent net income growth, and favorable overall income statement metrics. RadNet shows impressive revenue and net income growth percentages but operates with very thin margins and recent net margin deterioration. IDEXX’s greater profitability and margin stability suggest a more robust earnings profile.
Financial Ratios Comparison
The table below presents a side-by-side comparison of key financial ratios for IDEXX Laboratories, Inc. (IDXX) and RadNet, Inc. (RDNT) for the fiscal year ending 2024.
| Ratios | IDEXX Laboratories, Inc. (IDXX) | RadNet, Inc. (RDNT) |
|---|---|---|
| ROE | 55.7% | 0.31% |
| ROIC | 33.9% | 3.14% |
| P/E | 38.4 | 1826.3 |
| P/B | 21.4 | 5.65 |
| Current Ratio | 1.31 | 2.12 |
| Quick Ratio | 0.95 | 2.12 |
| D/E (Debt-to-Equity) | 0.62 | 1.92 |
| Debt-to-Assets | 29.97% | 52.60% |
| Interest Coverage | 36.2 | 1.31 |
| Asset Turnover | 1.18 | 0.56 |
| Fixed Asset Turnover | 4.70 | 1.37 |
| Payout Ratio | 0% | 0% |
| Dividend Yield | 0% | 0% |
Interpretation of the Ratios
IDEXX Laboratories, Inc.
IDEXX shows strong profitability with a net margin of 22.78%, ROE at 55.65%, and ROIC at 33.87%, indicating efficient capital use. However, high valuation multiples like a PE of 38.4 and PB of 21.37 present potential concerns. The company maintains a neutral liquidity position and a favorable debt-to-assets ratio of 29.97%. IDEXX does not pay dividends, reflecting a reinvestment strategy focused on growth and innovation.
RadNet, Inc.
RadNet exhibits weak profitability metrics, with a net margin of 0.15%, ROE of 0.31%, and ROIC of 3.14%, suggesting operational challenges. Its high debt levels, including a debt-to-assets ratio of 52.6% and a debt-to-equity of 1.92, raise financial risk concerns. Liquidity ratios are favorable, but valuation multiples are unattractively high. RadNet also does not pay dividends, likely prioritizing reinvestment amid profitability struggles.
Which one has the best ratios?
IDEXX stands out with significantly stronger profitability and more efficient capital management, despite some valuation concerns. RadNet’s ratios reveal operational and financial weaknesses, with many unfavorable indicators and high leverage. Overall, IDEXX’s financial ratios appear more robust and balanced compared to RadNet’s less favorable profile.
Strategic Positioning
This section compares the strategic positioning of IDEXX Laboratories and RadNet, including market position, key segments, and exposure to technological disruption:
IDEXX Laboratories, Inc.
- Large market cap (57B USD) in veterinary diagnostics with high beta and NASDAQ listing.
- Focuses on companion animal, livestock, poultry, dairy diagnostics, and water testing products and services.
- Operates in veterinary diagnostics and biomedical research with moderate exposure to human medical diagnostics.
RadNet, Inc.
- Smaller market cap (6B USD) in outpatient diagnostic imaging, also NASDAQ listed.
- Provides outpatient diagnostic imaging and AI solutions for radiology across multiple US states.
- Develops AI suites for radiologist image interpretation, indicating higher tech disruption exposure.
IDEXX Laboratories, Inc. vs RadNet, Inc. Positioning
IDEXX shows a diversified approach across veterinary and environmental diagnostic markets, while RadNet concentrates on outpatient imaging and AI-enhanced radiology. IDEXX benefits from broad product lines, RadNet from specialized imaging and AI development.
Which has the best competitive advantage?
IDEXX holds a slightly favorable moat with value creation despite declining ROIC, indicating some sustainable competitive advantage. RadNet has a slightly unfavorable moat, currently destroying value but showing improving profitability.
Stock Comparison
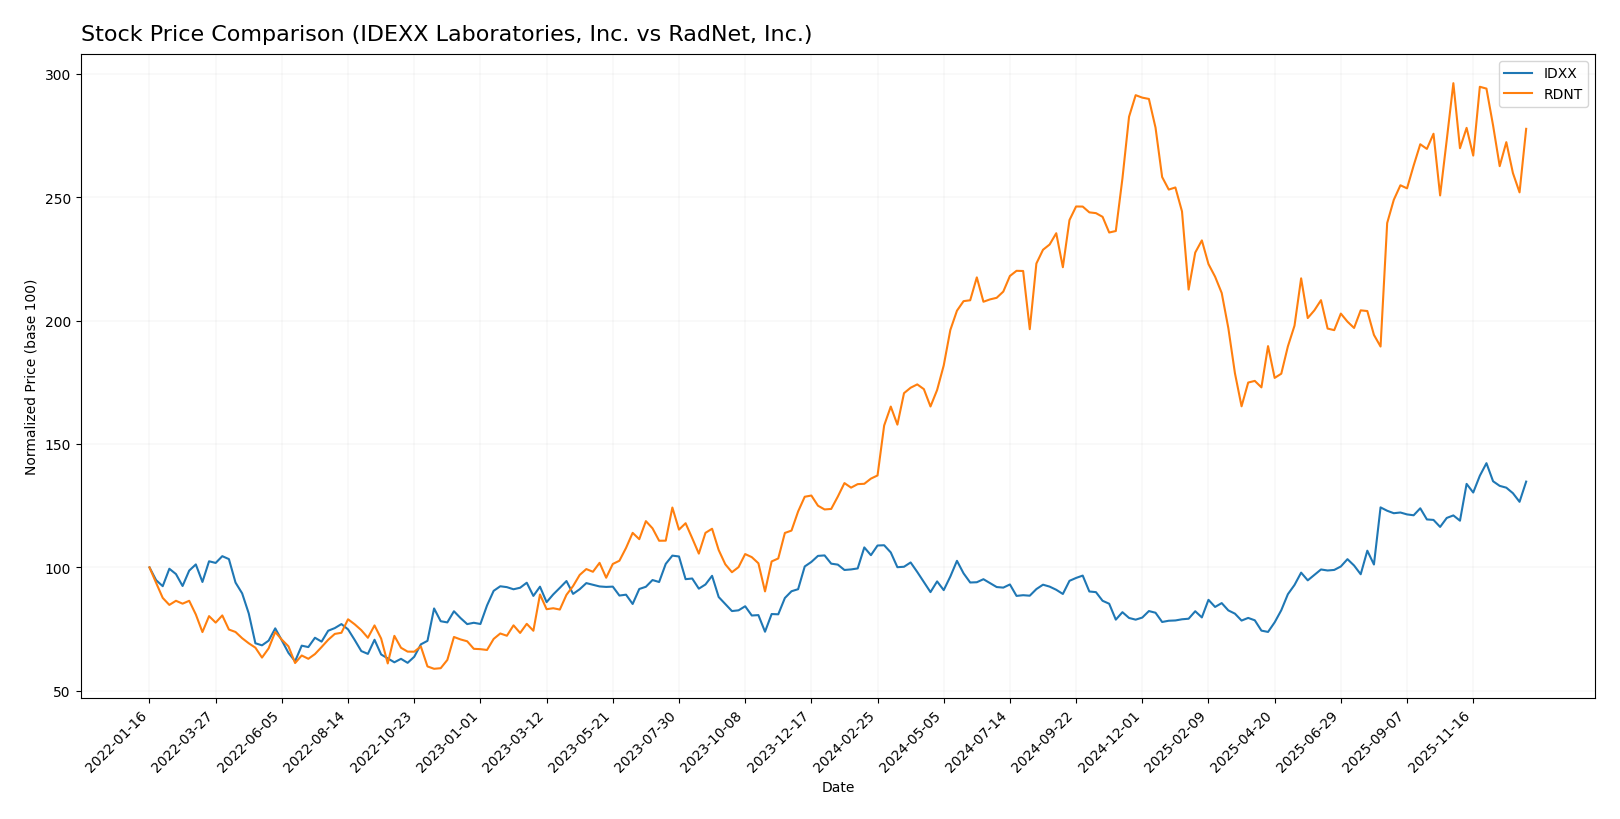
The stock price movements of IDEXX Laboratories, Inc. (IDXX) and RadNet, Inc. (RDNT) over the past 12 months reveal distinct bullish trends with differing momentum and volatility characteristics.
Trend Analysis
IDEXX Laboratories, Inc. exhibited a 28.41% price increase over the past year, indicating a bullish trend with acceleration. The stock showed significant volatility, with prices ranging from 390.94 to 752.88.
RadNet, Inc. demonstrated a stronger 104.23% price increase over the same period, confirming a bullish trend but with deceleration. Price fluctuation was more contained, between 38.29 and 83.41, reflecting lower volatility.
Comparing both, RadNet delivered the highest market performance with a 104.23% gain versus IDEXX’s 28.41%, despite recent deceleration in its upward momentum.
Target Prices
Analysts present a bullish consensus on both IDEXX Laboratories, Inc. and RadNet, Inc.
| Company | Target High | Target Low | Consensus |
|---|---|---|---|
| IDEXX Laboratories, Inc. | 850 | 750 | 803.57 |
| RadNet, Inc. | 95 | 90 | 92.25 |
The target consensus for IDEXX suggests a significant upside from the current price of 713.35 USD, while RadNet shows moderate upside potential from its current 78.2 USD price. Overall, analysts expect both stocks to appreciate.
Analyst Opinions Comparison
This section compares analysts’ ratings and grades for IDEXX Laboratories, Inc. (IDXX) and RadNet, Inc. (RDNT):
Rating Comparison
IDXX Rating
- Rating: B, considered very favorable overall.
- Discounted Cash Flow Score: 3, indicating a moderate valuation assessment.
- ROE Score: 5, showing very favorable profit generation from shareholders’ equity.
- ROA Score: 5, indicating very favorable asset utilization to generate earnings.
- Debt To Equity Score: 1, representing very unfavorable financial risk due to higher debt level.
- Overall Score: 3, classified as moderate financial standing.
RDNT Rating
- Rating: D+, described as very favorable overall.
- Discounted Cash Flow Score: 1, indicating a very unfavorable valuation assessment.
- ROE Score: 1, reflecting very unfavorable profit generation from equity.
- ROA Score: 1, showing very unfavorable asset utilization.
- Debt To Equity Score: 1, also indicating very unfavorable financial risk with high debt level.
- Overall Score: 1, classified as very unfavorable financial standing.
Which one is the best rated?
Based strictly on the provided data, IDXX holds a better overall rating (B) and higher scores in discounted cash flow, ROE, and ROA, despite similarly unfavorable debt-to-equity scores compared to RDNT.
Scores Comparison
Here is a comparison of the Altman Z-Score and Piotroski Score for both companies:
IDXX Scores
- Altman Z-Score: 23.01, well within the safe zone indicating very low bankruptcy risk.
- Piotroski Score: 8, classified as very strong financial health.
RDNT Scores
- Altman Z-Score: 2.16, in the grey zone indicating moderate bankruptcy risk.
- Piotroski Score: 2, classified as very weak financial health.
Which company has the best scores?
Based strictly on the provided data, IDXX has significantly better scores, with a high Altman Z-Score in the safe zone and a very strong Piotroski Score, compared to RDNT’s moderate bankruptcy risk and very weak financial strength.
Grades Comparison
Here is the comparison of the latest reliable grades for IDEXX Laboratories, Inc. and RadNet, Inc.:
IDEXX Laboratories, Inc. Grades
The table below shows recent grades from established financial institutions for IDEXX Laboratories, Inc.:
| Grading Company | Action | New Grade | Date |
|---|---|---|---|
| BTIG | Maintain | Buy | 2025-11-04 |
| JP Morgan | Maintain | Overweight | 2025-11-04 |
| UBS | Maintain | Neutral | 2025-11-04 |
| Morgan Stanley | Maintain | Overweight | 2025-11-04 |
| Stifel | Upgrade | Buy | 2025-10-31 |
| Morgan Stanley | Maintain | Overweight | 2025-08-15 |
| Piper Sandler | Maintain | Neutral | 2025-08-11 |
| Morgan Stanley | Maintain | Overweight | 2025-08-04 |
| JP Morgan | Maintain | Overweight | 2025-08-04 |
| Morgan Stanley | Maintain | Overweight | 2025-07-29 |
IDEXX Laboratories exhibits a predominantly positive trend with most firms maintaining Overweight or Buy ratings, reflecting steady confidence.
RadNet, Inc. Grades
The table below shows recent grades from established financial institutions for RadNet, Inc.:
| Grading Company | Action | New Grade | Date |
|---|---|---|---|
| B. Riley Securities | Maintain | Buy | 2025-12-01 |
| Barclays | Maintain | Overweight | 2025-11-13 |
| Truist Securities | Maintain | Buy | 2025-11-12 |
| Truist Securities | Maintain | Buy | 2025-09-03 |
| Barclays | Maintain | Overweight | 2025-09-03 |
| Raymond James | Maintain | Strong Buy | 2025-08-13 |
| Truist Securities | Maintain | Buy | 2025-04-11 |
| Barclays | Maintain | Overweight | 2025-03-24 |
| Raymond James | Upgrade | Strong Buy | 2025-03-05 |
| Barclays | Maintain | Overweight | 2025-01-22 |
RadNet shows strong and consistent Buy and Overweight grades, including upgrades to Strong Buy, indicating robust analyst support.
Which company has the best grades?
RadNet, Inc. generally holds stronger grades with multiple Strong Buy ratings and consistent Buy or Overweight assessments, whereas IDEXX Laboratories mainly receives Buy and Overweight ratings with some Neutral. RadNet’s stronger consensus could influence investor perception favorably, potentially impacting portfolio decisions regarding growth and risk appetite.
Strengths and Weaknesses
Below is a comparative overview of the key strengths and weaknesses of IDEXX Laboratories, Inc. (IDXX) and RadNet, Inc. (RDNT) based on their financial performance, innovation, market presence, and diversification.
| Criterion | IDEXX Laboratories, Inc. (IDXX) | RadNet, Inc. (RDNT) |
|---|---|---|
| Diversification | Strong product and service revenue streams ($2.25B products, $1.65B services in 2024); diversified veterinary diagnostics portfolio | Moderate diversification in healthcare services, with major reliance on commercial insurance ($1.02B) and Medicare ($410M) revenues |
| Profitability | High profitability with net margin 22.78%, ROIC 33.87%, ROE 55.65%; creating value but with a slight decline in ROIC trend | Very low profitability with net margin 0.15%, ROIC 3.14%, ROE 0.31%; currently shedding value though ROIC is improving |
| Innovation | Strong innovation in veterinary diagnostics and reagent rental programs, supporting long-term growth | Innovation limited, focused on imaging and teleradiology services with modest growth areas |
| Global presence | Significant global footprint in veterinary diagnostics, strong brand recognition | Primarily U.S.-focused with limited international exposure |
| Market Share | Leading market position in veterinary diagnostics with continuous revenue growth | Fragmented market with moderate share in diagnostic imaging and healthcare management |
Key takeaways: IDEXX demonstrates robust profitability, strong diversification, and an international footprint, despite a slight decline in ROIC. RadNet shows improving profitability but remains unprofitable overall, with heavy dependence on U.S. insurance payers and limited diversification. Investors should consider IDEXX’s stable value creation and RadNet’s turnaround potential with caution.
Risk Analysis
Below is a comparative table summarizing key risks for IDEXX Laboratories, Inc. (IDXX) and RadNet, Inc. (RDNT) based on the latest 2024 data:
| Metric | IDEXX Laboratories, Inc. (IDXX) | RadNet, Inc. (RDNT) |
|---|---|---|
| Market Risk | Beta 1.67, sensitive to healthcare market fluctuations | Beta 1.51, exposed to outpatient imaging market volatility |
| Debt Level | Moderate debt/equity 0.62, debt to assets 30% (favorable) | High debt/equity 1.92, debt to assets 53% (unfavorable) |
| Regulatory Risk | Moderate, subject to healthcare and veterinary diagnostic regulations | Moderate to high, due to healthcare and imaging regulations |
| Operational Risk | Diversified products and services reduce risk | Operational concentration in US outpatient imaging centers |
| Environmental Risk | Low, limited exposure | Low, standard for healthcare services |
| Geopolitical Risk | Low, primarily US-based operations | Low, primarily US-based operations |
In synthesis, RadNet faces higher financial risk due to its elevated debt load and weaker profitability metrics, along with operational concentration risk. IDEXX, while having some valuation concerns, shows stronger financial health and diversification. Market and regulatory risks remain pertinent for both, with debt level and operational risk being the most impactful for RadNet.
Which Stock to Choose?
IDEXX Laboratories, Inc. shows a generally favorable income evolution with 71% positive income statement indicators, including strong profitability and a stable net margin near 23%. Financial ratios are slightly favorable, reflecting high returns (ROE 56%) and efficient asset use, balanced by some valuation concerns. Debt levels are moderate and manageable, supported by a strong interest coverage ratio. The overall rating is very favorable with a “B” grade.
RadNet, Inc. presents a mixed income profile, with 57% favorable income metrics but very low profitability measures, including a net margin near 0.15% and weak return ratios. Financial ratios are mostly unfavorable, reflecting high leverage and low returns. While liquidity is strong, debt burden and interest coverage remain concerns. The rating is very unfavorable with a “D+” grade, signaling financial challenges.
Considering ratings and financial evaluations, IDXX might appear more suited to investors seeking quality and stable profitability, while RDNT’s profile could be interpreted as fitting for those tolerating higher risk with potential growth exposure. The choice may depend on individual investor preferences regarding stability versus speculative growth potential.
Disclaimer: Investment carries a risk of loss of initial capital. The past performance is not a reliable indicator of future results. Be sure to understand risks before making an investment decision.
Go Further
I encourage you to read the complete analyses of IDEXX Laboratories, Inc. and RadNet, Inc. to enhance your investment decisions: