In the fast-evolving semiconductor industry, QUALCOMM Incorporated and GLOBALFOUNDRIES Inc. stand out as key players driving innovation and technological advancement. QUALCOMM leads with its extensive wireless technology portfolio, while GLOBALFOUNDRIES focuses on advanced semiconductor manufacturing. Their overlapping markets and complementary innovation strategies make them ideal candidates for a comparative investment analysis. Join me as we explore which company offers the most compelling opportunity for your portfolio in 2026.

Table of contents
Companies Overview
I will begin the comparison between QUALCOMM and GLOBALFOUNDRIES by providing an overview of these two companies and their main differences.
QUALCOMM Overview
QUALCOMM Incorporated develops and commercializes foundational wireless technologies globally. Operating through three segments, it supplies integrated circuits and system software based on 3G/4G/5G standards, licenses its extensive intellectual property portfolio, and invests in early-stage companies across 5G, AI, automotive, and IoT industries. Founded in 1985 and headquartered in San Diego, QUALCOMM employs 49K people and is a key player in the semiconductors sector.
GLOBALFOUNDRIES Overview
GLOBALFOUNDRIES Inc. is a semiconductor foundry that manufactures integrated circuits enabling various electronic devices worldwide. Its product range includes microprocessors, mobile application processors, radio frequency modems, and power management units, alongside wafer fabrication services. Established in 2009 and based in Malta, New York, GLOBALFOUNDRIES has 13K employees and focuses on semiconductor manufacturing technologies within the technology sector.
Key similarities and differences
Both QUALCOMM and GLOBALFOUNDRIES operate in the semiconductor industry and are listed on NASDAQ. QUALCOMM focuses on technology development, IP licensing, and strategic investments, while GLOBALFOUNDRIES specializes in semiconductor manufacturing and wafer fabrication services. QUALCOMM’s business model is broader, including software and licensing, whereas GLOBALFOUNDRIES centers on foundry operations and hardware production. Employee count and market capitalization also differ significantly between the two.
Income Statement Comparison
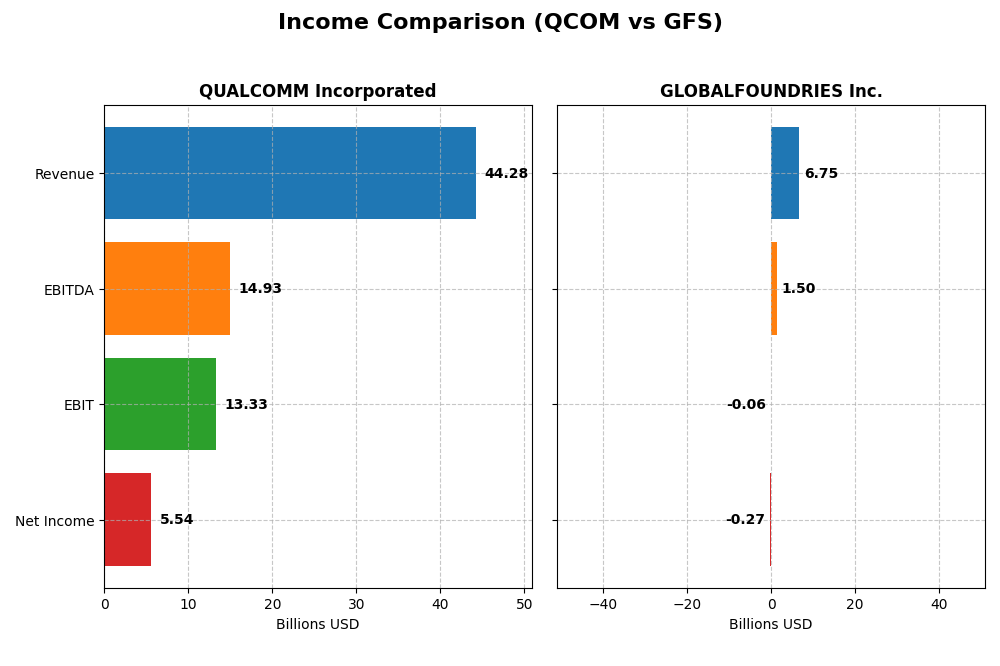
This table compares the latest fiscal year income statement metrics of QUALCOMM Incorporated and GLOBALFOUNDRIES Inc., highlighting key financial performance indicators in USD.
| Metric | QUALCOMM Incorporated | GLOBALFOUNDRIES Inc. |
|---|---|---|
| Market Cap | 176B | 23.3B |
| Revenue | 44.3B | 6.75B |
| EBITDA | 14.9B | 1.5B |
| EBIT | 13.3B | -64M |
| Net Income | 5.54B | -265M |
| EPS | 5.06 | -0.48 |
| Fiscal Year | 2025 | 2024 |
Income Statement Interpretations
QUALCOMM Incorporated
QUALCOMM’s revenue increased steadily from $33.6B in 2021 to $44.3B in 2025, with a 31.93% growth over the period. Despite this, net income declined by 38.73%, falling to $5.54B in 2025. Margins remained largely favorable, with gross margin at 55.43% and EBIT margin at 30.09%. However, net margin dropped significantly in the latest year, reflecting a slowdown in earnings growth.
GLOBALFOUNDRIES Inc.
GLOBALFOUNDRIES saw revenue growth of 39.15% from 2020 to 2024, peaking at $6.75B in 2024, but experienced an 8.69% revenue decline in the last year. Net income improved overall by 80.37% to a loss of $265M in 2024, with gross margin favorable at 24.46%. EBIT and net margins remain negative, showing ongoing profitability challenges despite recent revenue gains.
Which one has the stronger fundamentals?
QUALCOMM demonstrates robust revenue growth and strong gross and EBIT margins, yet suffers declining net income and net margin pressures. GLOBALFOUNDRIES shows less stable recent revenue and earnings, with persistent negative margins despite overall improvement. QUALCOMM’s income statement is evaluated as globally favorable, whereas GLOBALFOUNDRIES is unfavorable, indicating stronger fundamentals for QUALCOMM based on income metrics.
Financial Ratios Comparison
The table below presents the latest available financial ratios for QUALCOMM Incorporated (QCOM) and GLOBALFOUNDRIES Inc. (GFS) for a clear side-by-side comparison.
| Ratios | QUALCOMM Incorporated (2025 FY) | GLOBALFOUNDRIES Inc. (2024 FY) |
|---|---|---|
| ROE | 26.1% | -2.5% |
| ROIC | 13.2% | -1.5% |
| P/E | 32.7 | -89.5 |
| P/B | 8.54 | 2.20 |
| Current Ratio | 2.82 | 2.11 |
| Quick Ratio | 2.10 | 1.57 |
| D/E (Debt-to-Equity) | 0.70 | 0.22 |
| Debt-to-Assets | 29.5% | 13.8% |
| Interest Coverage | 18.6 | -1.48 |
| Asset Turnover | 0.88 | 0.40 |
| Fixed Asset Turnover | 9.44 | 0.82 |
| Payout Ratio | 68.7% | 0% |
| Dividend Yield | 2.10% | 0% |
Interpretation of the Ratios
QUALCOMM Incorporated
QUALCOMM shows predominantly strong financial ratios with favorable net margin (12.51%), return on equity (26.13%), and return on invested capital (13.19%). Liquidity ratios are solid, with a current ratio of 2.82 and a quick ratio of 2.1. However, valuation multiples like P/E (32.7) and P/B (8.54) are unfavorable, indicating potentially high market expectations. The company pays dividends, offering a 2.1% yield supported by healthy coverage from free cash flow and manageable payout risks.
GLOBALFOUNDRIES Inc.
GLOBALFOUNDRIES exhibits weak profitability ratios, including negative net margin (-3.93%) and return on equity (-2.46%), signaling operational challenges. Liquidity and leverage ratios appear sound, such as a current ratio of 2.11 and debt-to-equity of 0.22, but interest coverage is negative, reflecting difficulties servicing debt. The company does not pay dividends, likely due to ongoing losses and reinvestment priorities in its growth and operational turnaround phase.
Which one has the best ratios?
QUALCOMM clearly holds the superior ratio profile with a majority of favorable profitability, liquidity, and dividend metrics, despite some valuation concerns. In contrast, GLOBALFOUNDRIES faces significant profitability and coverage weaknesses, resulting in an overall unfavorable ratio assessment. Therefore, QUALCOMM demonstrates stronger financial health based on the provided ratio analysis.
Strategic Positioning
This section compares the strategic positioning of QUALCOMM and GLOBALFOUNDRIES, including their market position, key segments, and exposure to disruption:
QUALCOMM
- Leading market position with notable competitive pressure in wireless technology sectors.
- Key segments include integrated circuits for wireless communications and technology licensing.
- Exposed to technological disruption through investments in 5G, AI, automotive, and IoT innovations.
GLOBALFOUNDRIES
- Competes in semiconductor foundry with moderate market presence and competitive challenges.
- Focuses on wafer fabrication and engineering pre-fabrication services as main business drivers.
- Faces disruption risks through evolving semiconductor manufacturing technologies and process scaling.
QUALCOMM vs GLOBALFOUNDRIES Positioning
QUALCOMM’s diversified approach spans chips, licensing, and strategic initiatives, offering multiple revenue streams. GLOBALFOUNDRIES operates with a more concentrated focus on wafer fabrication and related services, potentially limiting business diversification.
Which has the best competitive advantage?
QUALCOMM holds a slightly favorable moat status with value creation despite declining profitability. GLOBALFOUNDRIES shows a slightly unfavorable moat with value destruction but improving profitability, indicating QUALCOMM currently maintains a stronger competitive advantage.
Stock Comparison
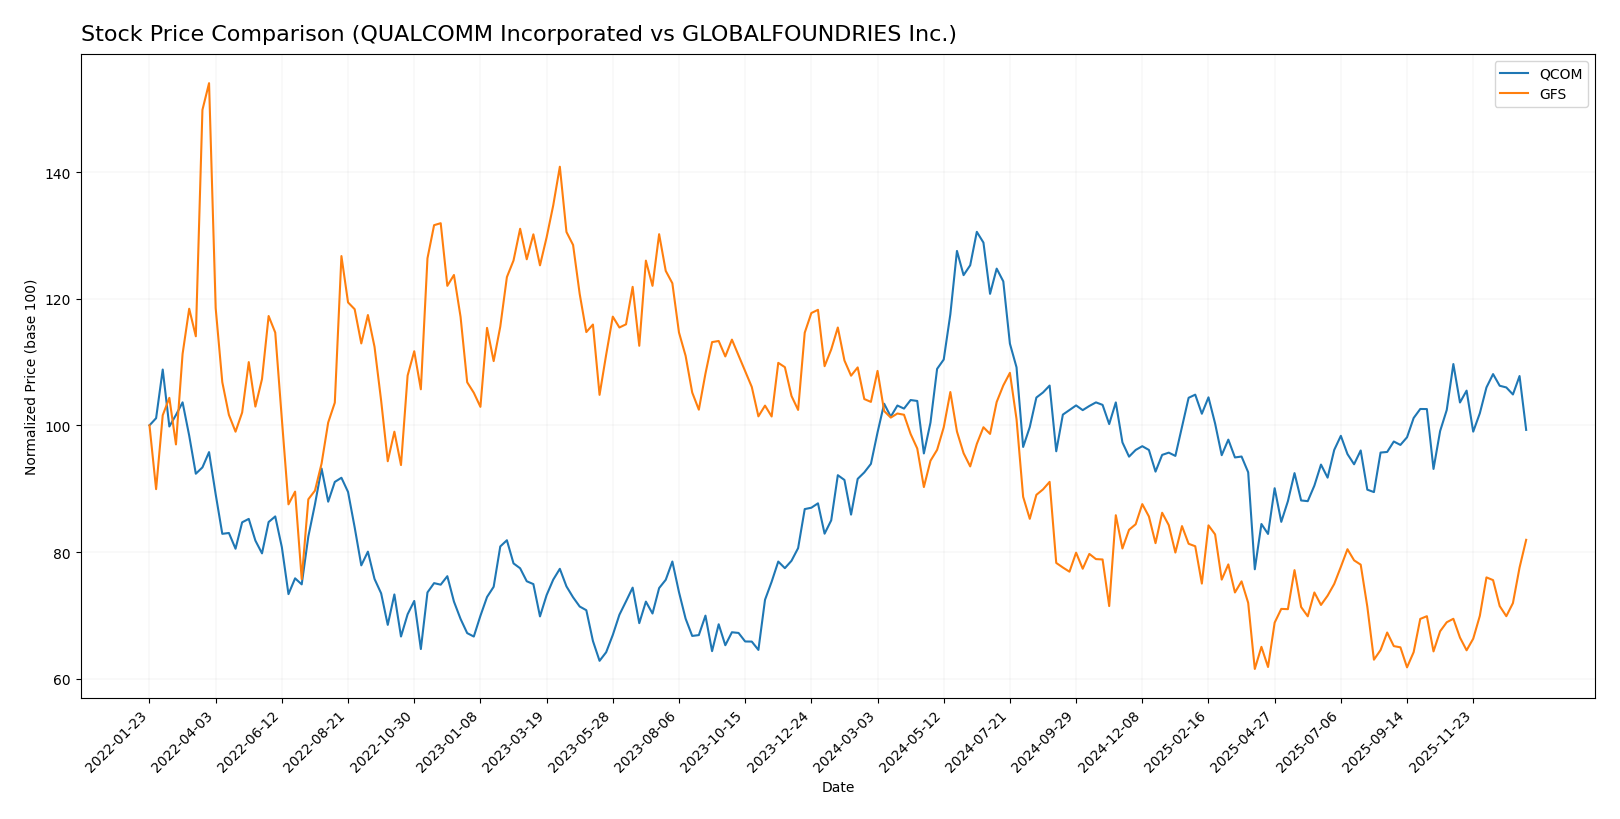
The stock price movements of QUALCOMM Incorporated and GLOBALFOUNDRIES Inc. over the past year reveal contrasting trading dynamics, with QCOM showing a moderate overall gain and GFS experiencing a pronounced decline, each exhibiting recent shifts in trend direction and trading volume behavior.
Trend Analysis
QUALCOMM Incorporated’s stock posted a 5.71% gain over the past 12 months, indicating a bullish trend with accelerating upward momentum and notable volatility (16.08 std deviation). The price ranged between 127.46 and 215.33, but recent weeks show a declining trend (-9.47%) with reduced volatility.
GLOBALFOUNDRIES Inc. exhibited a bearish trend over the last year, with a -21.0% price change and accelerating decline despite relatively lower volatility (6.45 std deviation). However, recent months reveal a positive reversal, gaining 17.95%, indicating short-term recovery momentum.
Comparing both stocks, QUALCOMM delivered the highest market performance over the full year with a bullish trajectory, while GLOBALFOUNDRIES showed a stronger recent uptrend but remains down overall.
Target Prices
The current analyst consensus presents a positive outlook for both QUALCOMM Incorporated and GLOBALFOUNDRIES Inc.
| Company | Target High | Target Low | Consensus |
|---|---|---|---|
| QUALCOMM Incorporated | 210 | 165 | 185.71 |
| GLOBALFOUNDRIES Inc. | 40 | 37 | 38.5 |
Analysts expect QUALCOMM’s price to rise from its current 164 USD to a consensus near 186 USD, suggesting moderate upside potential. GLOBALFOUNDRIES’ target consensus of 38.5 USD is slightly below its current price of 42.13 USD, indicating a cautious or neutral stance.
Analyst Opinions Comparison
This section compares analysts’ ratings and grades for QUALCOMM Incorporated and GLOBALFOUNDRIES Inc.:
Rating Comparison
QUALCOMM Incorporated Rating
- Rating: B+, considered Very Favorable by analysts.
- Discounted Cash Flow Score: 4, indicating a Favorable valuation.
- ROE Score: 5, Very Favorable, showing efficient profit use.
- ROA Score: 5, Very Favorable, strong asset utilization.
- Debt To Equity Score: 1, Very Unfavorable, higher financial risk.
- Overall Score: 3, Moderate overall financial standing.
GLOBALFOUNDRIES Inc. Rating
- Rating: C+, also marked as Very Favorable in evaluation.
- Discounted Cash Flow Score: 3, reflecting a Moderate valuation.
- ROE Score: 1, Very Unfavorable, indicating weak profitability.
- ROA Score: 1, Very Unfavorable, poor asset earnings generation.
- Debt To Equity Score: 3, Moderate, indicating balanced leverage.
- Overall Score: 2, Moderate, slightly lower overall assessment.
Which one is the best rated?
QUALCOMM holds a higher rating (B+) and superior scores in ROE and ROA, indicating stronger profitability and asset use, despite higher financial risk. GLOBALFOUNDRIES has a lower rating (C+) with weaker profitability but a more balanced debt position. Overall, QUALCOMM is better rated based on provided data.
Scores Comparison
The scores comparison between QUALCOMM and GLOBALFOUNDRIES highlights their financial stability and strength as follows:
QUALCOMM Scores
- Altman Z-Score: 6.37, indicating a safe zone with low bankruptcy risk.
- Piotroski Score: 7, classified as strong financial health.
GLOBALFOUNDRIES Scores
- Altman Z-Score: 2.61, in the grey zone with moderate bankruptcy risk.
- Piotroski Score: 6, considered average financial strength.
Which company has the best scores?
QUALCOMM exhibits a higher Altman Z-Score and Piotroski Score than GLOBALFOUNDRIES, indicating stronger financial stability and health based on the provided data.
Grades Comparison
Here is a comparison of the recent grades assigned to QUALCOMM Incorporated and GLOBALFOUNDRIES Inc.:
QUALCOMM Incorporated Grades
The table below summarizes recent grades from recognized grading companies for QUALCOMM Incorporated:
| Grading Company | Action | New Grade | Date |
|---|---|---|---|
| Mizuho | Downgrade | Neutral | 2026-01-09 |
| Rosenblatt | Maintain | Buy | 2025-11-06 |
| B of A Securities | Maintain | Buy | 2025-11-06 |
| Mizuho | Maintain | Outperform | 2025-11-06 |
| Wells Fargo | Maintain | Underweight | 2025-11-06 |
| Piper Sandler | Maintain | Overweight | 2025-11-06 |
| UBS | Maintain | Neutral | 2025-11-06 |
| JP Morgan | Maintain | Overweight | 2025-11-04 |
| Citigroup | Maintain | Neutral | 2025-10-28 |
| Rosenblatt | Maintain | Buy | 2025-10-28 |
QUALCOMM’s grades show a general consensus around Buy and Neutral ratings, with a recent downgrade from Mizuho to Neutral, indicating some caution.
GLOBALFOUNDRIES Inc. Grades
The table below presents recent grades from recognized grading companies for GLOBALFOUNDRIES Inc.:
| Grading Company | Action | New Grade | Date |
|---|---|---|---|
| Wedbush | Downgrade | Neutral | 2025-12-31 |
| B of A Securities | Maintain | Underperform | 2025-12-04 |
| Evercore ISI Group | Maintain | Outperform | 2025-11-13 |
| JP Morgan | Maintain | Neutral | 2025-11-13 |
| Citigroup | Maintain | Neutral | 2025-11-13 |
| Wedbush | Maintain | Outperform | 2025-11-13 |
| B of A Securities | Downgrade | Underperform | 2025-10-13 |
| Deutsche Bank | Maintain | Buy | 2025-08-06 |
| Morgan Stanley | Maintain | Equal Weight | 2025-08-06 |
| Wedbush | Maintain | Outperform | 2025-08-06 |
GLOBALFOUNDRIES exhibits a mixed rating profile, with multiple Outperform and Neutral grades but also Underperform ratings and recent downgrades, suggesting some market uncertainty.
Which company has the best grades?
QUALCOMM Incorporated generally receives stronger and more consistent Buy and Outperform grades compared to GLOBALFOUNDRIES Inc., which has a more varied and cautious rating mix. This difference in grading could influence investor sentiment, reflecting perceived stability and growth prospects.
Strengths and Weaknesses
Below is a comparison table summarizing the key strengths and weaknesses of QUALCOMM Incorporated (QCOM) and GLOBALFOUNDRIES Inc. (GFS) based on the most recent financial and operational data.
| Criterion | QUALCOMM Incorporated (QCOM) | GLOBALFOUNDRIES Inc. (GFS) |
|---|---|---|
| Diversification | High diversification with strong segments in QCT (38.4B) and QTL (5.58B) revenue streams | Moderate diversification focusing mainly on Water Fabrication (6.1B) and Engineering Services (652M) |
| Profitability | Favorable net margin (12.5%) and ROIC (13.2%), creating value despite a declining trend | Negative net margin (-3.9%) and ROIC (-1.5%), currently shedding value but improving profitability |
| Innovation | Strong innovation reflected in consistent high ROE (26.1%) and efficient asset turnover | Lower innovation impact with unfavorable fixed asset turnover and asset utilization ratios |
| Global presence | Extensive global footprint with strong market reach in communications technologies | Global presence concentrated in semiconductor fabrication with growing revenue trends |
| Market Share | Established leader with significant market share in mobile chipsets and licensing | Smaller market share with focus on specialized semiconductor manufacturing |
In summary, QUALCOMM shows solid profitability and diversification with a slight concern over declining ROIC trends, while GLOBALFOUNDRIES is improving profitability but still faces challenges in generating positive returns and operational efficiency. Investors should weigh QCOM’s stable value creation against GFS’s turnaround potential and inherent risks.
Risk Analysis
Below is a comparative table highlighting key risks for QUALCOMM Incorporated (QCOM) and GLOBALFOUNDRIES Inc. (GFS) based on the most recent financial and market data.
| Metric | QUALCOMM (QCOM) | GLOBALFOUNDRIES (GFS) |
|---|---|---|
| Market Risk | Beta 1.21 – Moderate volatility; tech sector cyclical risks | Beta 1.49 – Higher volatility, semiconductor cycle sensitive |
| Debt Level | Debt-to-Equity 0.7 (neutral); Debt-to-Assets 29.5% (favorable) | Debt-to-Equity 0.22 (favorable); Low leverage |
| Regulatory Risk | Moderate; IP licensing and global trade tensions impact | Moderate; foundry industry regulations, export controls |
| Operational Risk | Diversified segments reduce risk; strong supply chain | Higher operational risk; manufacturing complexity and scale |
| Environmental Risk | Moderate; focus on sustainability but energy-intensive | Moderate; manufacturing processes environmentally sensitive |
| Geopolitical Risk | Exposure to US-China tech tensions and global supply chains | Significant; dependencies on global trade and geopolitical stability |
In synthesis, QCOM shows moderate market and geopolitical risks but benefits from strong financial health and diversification. GFS faces higher market volatility and operational risks due to its manufacturing focus and weaker profitability. The most impactful risks remain semiconductor market cyclicality and geopolitical tensions affecting global supply chains, especially for GFS. Investors should weigh these factors carefully with an emphasis on risk management given GFS’s financial challenges and QCOM’s premium valuation.
Which Stock to Choose?
QUALCOMM Incorporated (QCOM) shows a favorable income evolution with strong profitability and financial ratios, including a 12.51% net margin and 26.13% ROE. Its debt levels are moderate, and it holds a very favorable B+ rating supported by solid cash flow and a safe Altman Z-Score.
GLOBALFOUNDRIES Inc. (GFS) presents a mixed picture with unfavorable income growth and negative profitability ratios. Despite low debt and a moderate current ratio, it carries an unfavorable global income statement opinion and a C+ rating, reflecting ongoing challenges, though its Altman Z-Score places it in the grey zone.
For investors prioritizing financial stability and profitability, QUALCOMM’s favorable rating and income performance might appear more attractive, while those open to turnaround opportunities could find GLOBALFOUNDRIES’ improving profitability and lower valuation metrics worth monitoring. The choice could depend on the investor’s risk tolerance and strategy focus.
Disclaimer: Investment carries a risk of loss of initial capital. The past performance is not a reliable indicator of future results. Be sure to understand risks before making an investment decision.
Go Further
I encourage you to read the complete analyses of QUALCOMM Incorporated and GLOBALFOUNDRIES Inc. to enhance your investment decisions: