Home > Comparison > Technology > MSFT vs GEN
The strategic rivalry between Microsoft Corporation and Gen Digital Inc. shapes the competitive landscape of the technology sector. Microsoft, a capital-intensive software infrastructure giant, operates a diversified portfolio spanning cloud computing, productivity software, and devices. In contrast, Gen Digital focuses on high-margin cyber safety solutions for consumers worldwide. This analysis will assess which company’s business model offers superior risk-adjusted potential for a diversified portfolio amidst evolving industry dynamics.
Table of contents
Companies Overview
Microsoft Corporation and Gen Digital Inc. command significant roles in the software infrastructure sector, shaping digital security and cloud computing.
Microsoft Corporation: Global Technology Powerhouse
Microsoft dominates as a technology giant in software infrastructure. It generates revenue through diverse segments: Productivity and Business Processes, Intelligent Cloud, and More Personal Computing. In 2026, Microsoft sharpened its focus on expanding Azure cloud services and integrating AI-driven solutions across enterprise software, reinforcing its competitive advantage in cloud computing and productivity tools.
Gen Digital Inc.: Cyber Safety Specialist
Gen Digital focuses on consumer cyber safety solutions, offering subscription services like Norton 360 and LifeLock for identity protection. Its revenue engine hinges on subscription renewals and expanding privacy tools globally. In 2026, the company prioritized enhancing its VPN and dark web monitoring capabilities to meet rising cybersecurity demands amid escalating online threats.
Strategic Collision: Similarities & Divergences
Both operate in software infrastructure but diverge sharply: Microsoft pursues a broad ecosystem with cloud and productivity dominance, while Gen Digital focuses on a niche of consumer cybersecurity. Their battleground is digital trust—enterprise cloud security versus consumer privacy protection. Investors face distinct profiles: Microsoft offers diversified growth and scale; Gen Digital targets specialized, subscription-based resilience in cyber defense.
Income Statement Comparison
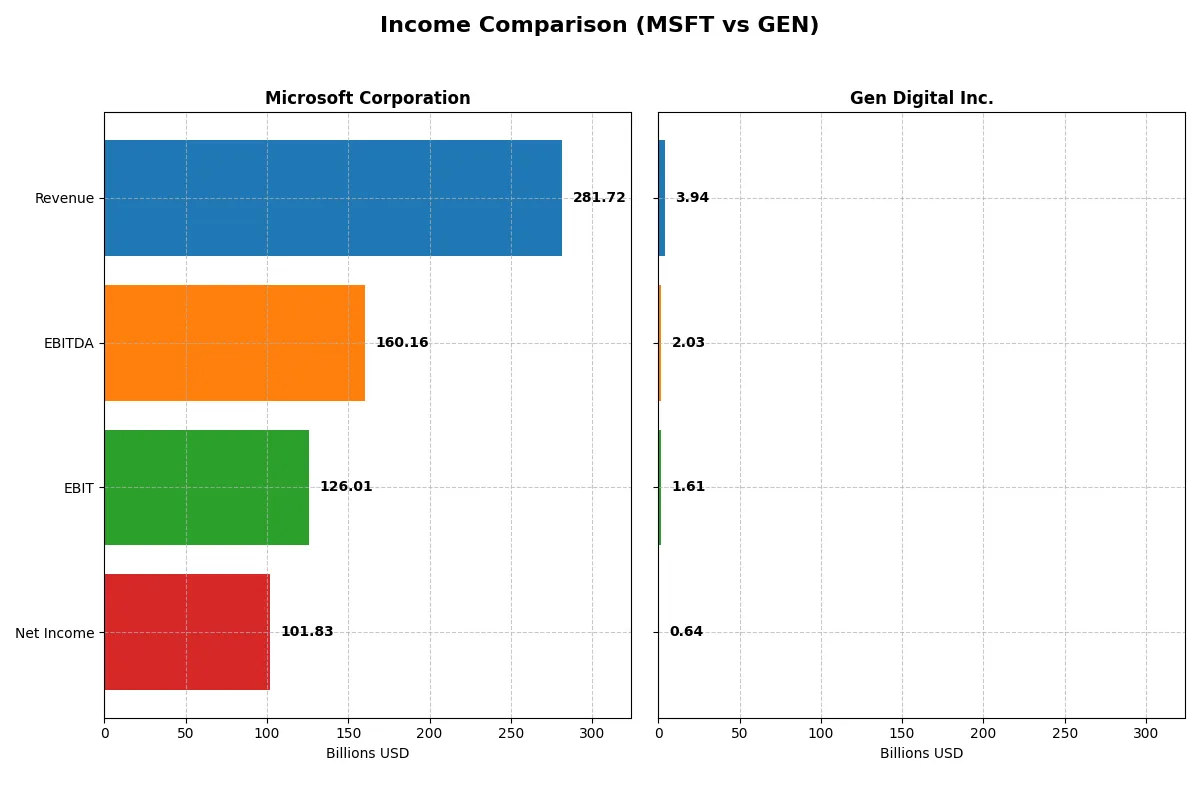
This data dissects the core profitability and scalability of both corporate engines to reveal who dominates the bottom line:
| Metric | Microsoft Corporation (MSFT) | Gen Digital Inc. (GEN) |
|---|---|---|
| Revenue | 282B | 3.94B |
| Cost of Revenue | 87.8B | 776M |
| Operating Expenses | 65.4B | 1.55B |
| Gross Profit | 194B | 3.16B |
| EBITDA | 160B | 2.03B |
| EBIT | 126B | 1.61B |
| Interest Expense | 2.39B | 578M |
| Net Income | 102B | 643M |
| EPS | 13.7 | 1.04 |
| Fiscal Year | 2025 | 2025 |
Income Statement Analysis: The Bottom-Line Duel
This income statement comparison reveals each company’s operational efficiency and profitability momentum over recent years.
Microsoft Corporation Analysis
Microsoft’s revenue surged from $168B in 2021 to $282B in 2025, with net income climbing from $61B to $102B. Its gross margin remains robust near 69%, while net margins steady at 36%. The 2025 fiscal year highlights solid growth momentum, with a 15.6% EPS increase and healthy operating leverage driving profits upward.
Gen Digital Inc. Analysis
Gen Digital’s revenue expanded from $2.55B in 2021 to $3.93B in 2025, with net income rising from $554M to $643M. The company maintains a strong gross margin above 80%, but net margins are thinner at 16%. Despite modest revenue growth, 2025 showed a sharp 44% EBIT increase, reflecting improving operational efficiency amid high interest expenses.
Margin Strength vs. Growth Momentum
Microsoft dominates with superior scale, delivering higher absolute profits and more consistent margin expansion. Gen Digital impresses with excellent gross margins and rapid EBIT growth but struggles with elevated interest costs limiting net margin expansion. For investors, Microsoft’s blend of scale and margin resilience offers a more compelling income statement profile.
Financial Ratios Comparison
These vital ratios act as a diagnostic tool to expose underlying fiscal health, valuation premiums, and capital efficiency for clear comparative insight:
| Ratios | Microsoft (MSFT) | Gen Digital (GEN) |
|---|---|---|
| ROE | 29.6% | 28.3% |
| ROIC | 22.0% | 7.8% |
| P/E | 36.3 | 25.4 |
| P/B | 10.8 | 7.2 |
| Current Ratio | 1.35 | 0.51 |
| Quick Ratio | 1.35 | 0.51 |
| D/E | 0.18 | 3.66 |
| Debt-to-Assets | 9.8% | 53.7% |
| Interest Coverage | 53.9 | 2.79 |
| Asset Turnover | 0.46 | 0.25 |
| Fixed Asset Turnover | 1.23 | 36.1 |
| Payout Ratio | 23.6% | 48.7% |
| Dividend Yield | 0.65% | 1.92% |
| Fiscal Year | 2025 | 2025 |
Efficiency & Valuation Duel: The Vital Signs
Ratios serve as a company’s DNA, uncovering hidden risks and operational strengths that raw numbers alone cannot reveal.
Microsoft Corporation
Microsoft impresses with a robust 29.65% ROE and a strong 36.15% net margin, signaling high profitability. Its P/E of 36.31 and P/B of 10.76 suggest the stock is expensive relative to earnings and book value. The company balances shareholder returns with modest dividends and reinvests heavily in R&D, fueling growth and sustaining its competitive moat.
Gen Digital Inc.
Gen Digital posts a comparable 28.34% ROE but a lower 16.34% net margin, reflecting moderate profitability. The P/E of 25.36 and P/B of 7.19 show less valuation stretch than Microsoft. However, its weak liquidity ratios and high debt levels raise red flags. Gen focuses on growth over dividends, reinvesting cash to improve operations amid financial constraints.
Premium Valuation vs. Operational Safety
Microsoft offers higher profitability and a balanced capital structure but trades at a premium valuation. Gen Digital’s lower valuation masks financial risks from debt and liquidity weaknesses. Investors prioritizing stability and quality may prefer Microsoft, while those seeking growth at a discount face more risk with Gen.
Which one offers the Superior Shareholder Reward?
I compare Microsoft and Gen Digital’s distribution strategies to find the superior shareholder reward. Microsoft pays a modest dividend yield of 0.65% with a sustainable payout ratio near 24%, backed by strong free cash flow (FCF) coverage of 1.54x. Its buybacks are consistent, enhancing total return. Gen Digital offers a higher dividend yield around 1.9%-2.3%, but with payout ratios above 48% and weaker cash flow coverage, indicating more strain. Gen’s heavy debt load (debt-to-equity >3.6) and limited buyback impact raise sustainability concerns. I conclude Microsoft’s balanced dividend and steady buybacks deliver a more reliable and attractive total shareholder return in 2026.
Comparative Score Analysis: The Strategic Profile
The radar chart reveals the fundamental DNA and trade-offs of Microsoft Corporation and Gen Digital Inc., highlighting their core financial strengths and weaknesses:
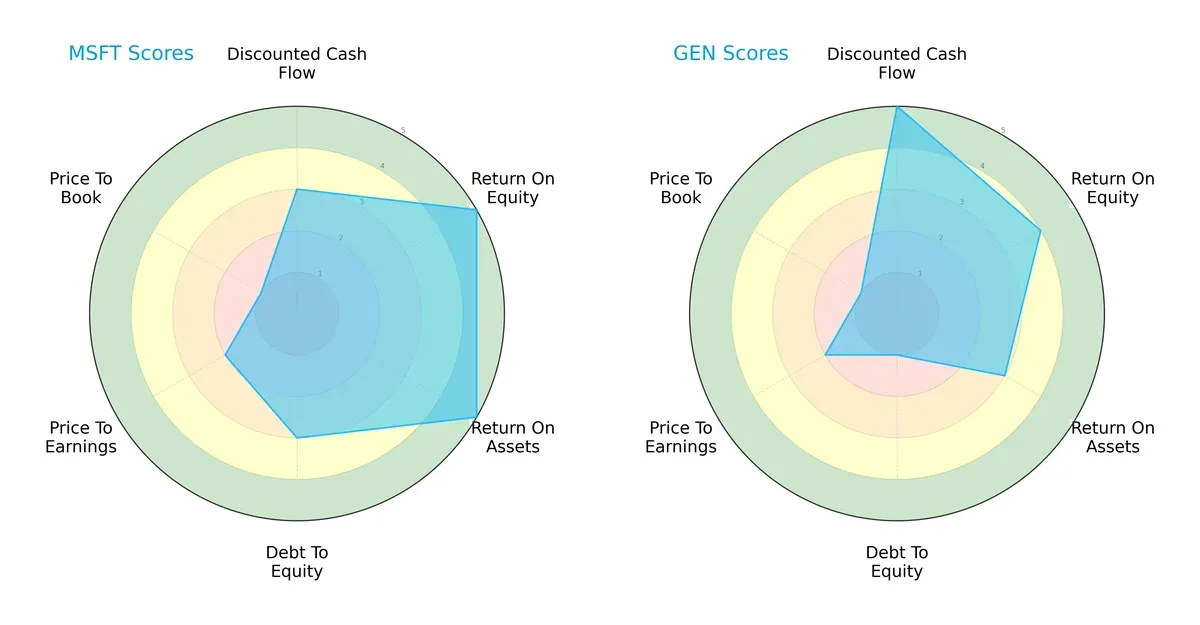
Microsoft shows superior efficiency in ROE and ROA, scoring 5 in both, indicating robust asset utilization and shareholder value creation. Gen Digital excels in discounted cash flow with a score of 5, suggesting better future cash flow prospects. However, Gen’s debt-to-equity score is notably weaker at 1, reflecting higher financial risk. Microsoft presents a more balanced profile across profitability and leverage, while Gen leans on its cash flow advantage but carries significant debt concerns.
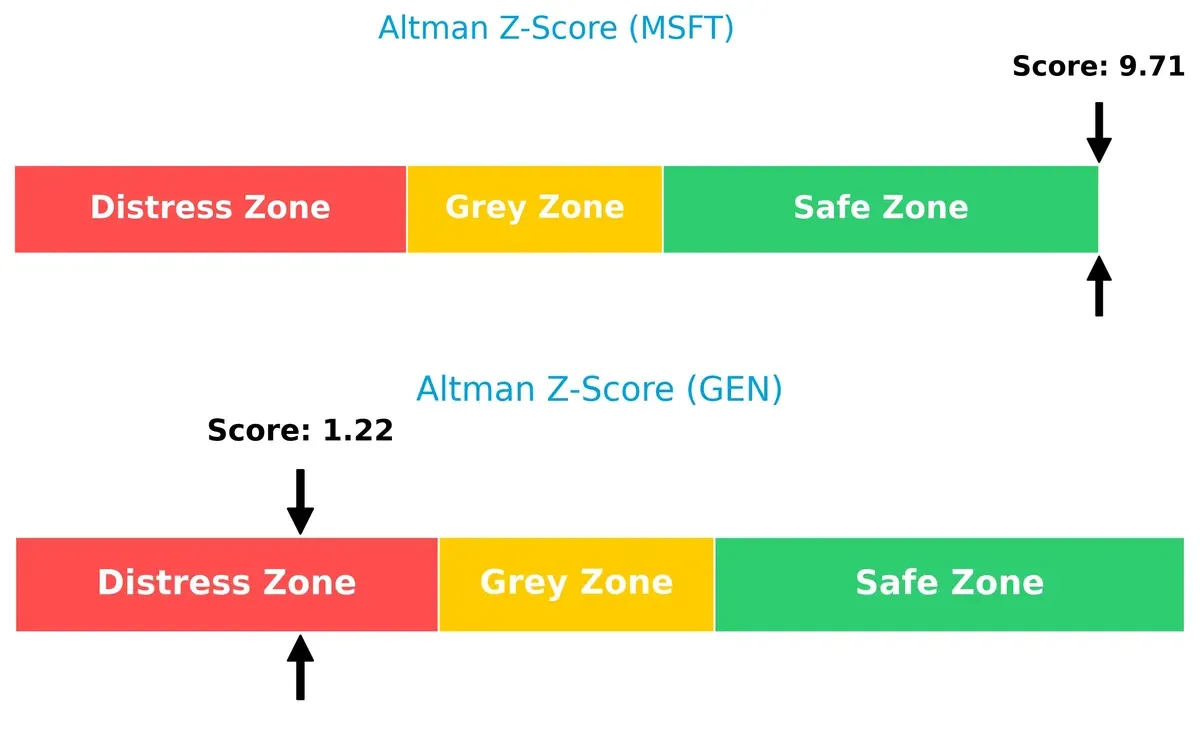
Bankruptcy Risk: Solvency Showdown
Microsoft’s Altman Z-Score of 9.7 places it securely in the safe zone, signaling strong financial stability and low bankruptcy risk. Gen Digital’s score of 1.2 falls in the distress zone, indicating heightened risk of financial distress and potential default. This Z-Score gap highlights Microsoft’s far superior long-term survival prospects in volatile markets:
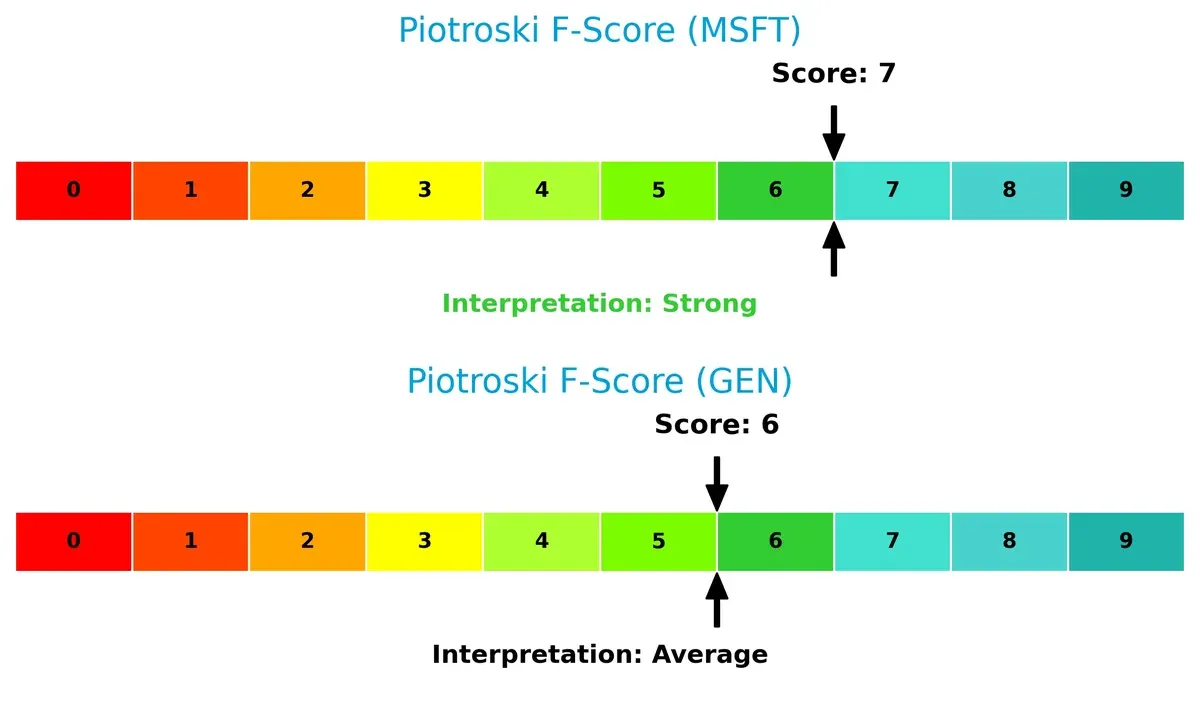
Financial Health: Quality of Operations
Microsoft’s Piotroski F-Score of 7 indicates strong financial health with solid profitability, liquidity, and operational efficiency. Gen Digital’s score of 6, while decent, suggests some weaknesses in internal metrics, potentially signaling caution for investors seeking peak financial quality. Microsoft clearly leads in operational robustness:
How are the two companies positioned?
This section dissects Microsoft and Gen Digital’s operational DNA by comparing revenue distribution and internal strengths and weaknesses. The goal is to confront their economic moats to reveal which model delivers the most resilient competitive advantage today.
Revenue Segmentation: The Strategic Mix
This visual comparison dissects how Microsoft Corporation and Gen Digital Inc. diversify their income streams and where their primary sector bets lie:
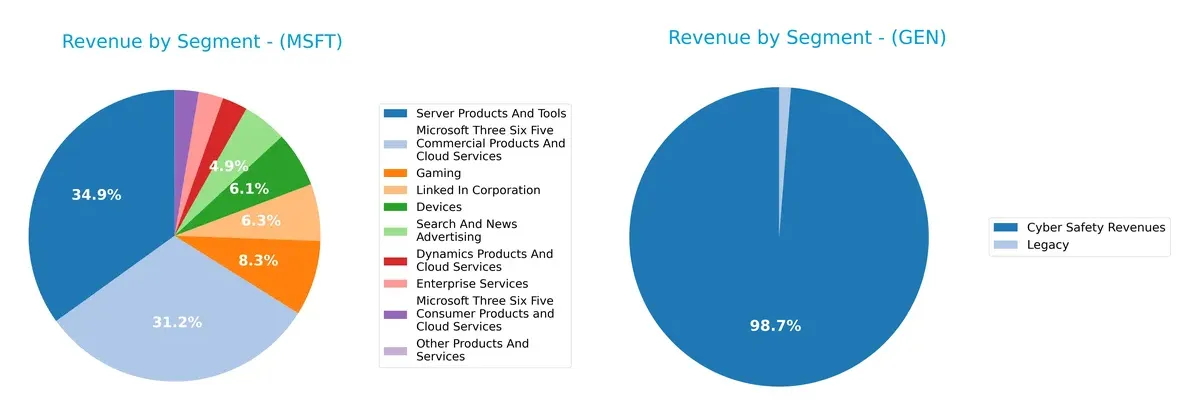
Microsoft dwarfs Gen Digital with a broad portfolio spanning cloud, productivity, gaming, and devices. Its top segments—Server Products and Tools ($98.4B), Microsoft 365 Commercial ($87.8B), and Gaming ($23.5B)—anchor a diversified ecosystem that reduces concentration risk. In contrast, Gen pivots heavily on Cyber Safety Revenues ($3.9B), exposing it to sector-specific risks but demonstrating clear focus on cybersecurity dominance. Microsoft’s mix signals infrastructure strength; Gen’s, niche specialization.
Strengths and Weaknesses Comparison
This table compares the Strengths and Weaknesses of Microsoft Corporation and Gen Digital Inc.:
Microsoft Strengths
- High net margin of 36.15%
- Strong ROE at 29.65%
- Favorable quick ratio and low debt-to-assets at 9.79%
- Large global presence with $282B revenue split nearly evenly US/non-US
- Diversified revenue streams across cloud, enterprise, gaming, and devices
- Robust interest coverage at 52.84
Gen Digital Strengths
- Favorable ROE of 28.34%
- Moderate net margin at 16.34%
- Favorable WACC at 7.74%
- Strong fixed asset turnover at 36.1
- Presence in Americas, EMEA, Asia Pacific regions
- Cyber safety and security focus with growing core consumer revenues
Microsoft Weaknesses
- Unfavorable P/E of 36.31 and P/B of 10.76 indicating high valuation
- Asset turnover is low at 0.46
- Dividend yield is low at 0.65%
- Neutral current ratio at 1.35
- Some segments show slower growth potential
Gen Digital Weaknesses
- Unfavorable current and quick ratios at 0.51 signal liquidity risks
- High debt-to-equity at 3.66 and debt-to-assets at 53.66%
- Unfavorable P/E and P/B ratios
- Low asset turnover at 0.25
- Interest coverage is only neutral at 2.78
Microsoft demonstrates robust profitability, diversified revenue, and strong global scale. Gen Digital shows solid profitability metrics and specialization in cyber safety but faces financial leverage and liquidity challenges. These contrasts reflect their strategic focus and financial health.
The Moat Duel: Analyzing Competitive Defensibility
A structural moat protects long-term profits from competition’s relentless erosion. Only it ensures durable value creation in dynamic markets:
Microsoft Corporation: Ecosystem Lock-in
Microsoft’s moat hinges on ecosystem lock-in via integrated cloud, productivity, and OS platforms. This drives high ROIC above WACC at 13.3%, underpinning margin stability. Expansion into AI and cloud in 2026 should deepen this lock-in.
Gen Digital Inc.: Subscription Switching Costs
Gen Digital relies on subscription-based switching costs in cyber safety. Its ROIC barely exceeds WACC by 0.03%, signaling weak value creation amid margin pressure. Growth in identity theft and VPN markets could disrupt its modest moat in 2026.
Moat Strength Battle: Ecosystem Lock-in vs. Subscription Switching Costs
Microsoft’s ecosystem lock-in delivers a wider, more durable moat than Gen Digital’s fragile subscription model. Microsoft is far better positioned to defend and expand market share in 2026.
Which stock offers better returns?
Over the past 12 months, Microsoft and Gen Digital both showed bullish trends with decelerating momentum, but recent months reveal notable downward pressure in both stocks’ prices.
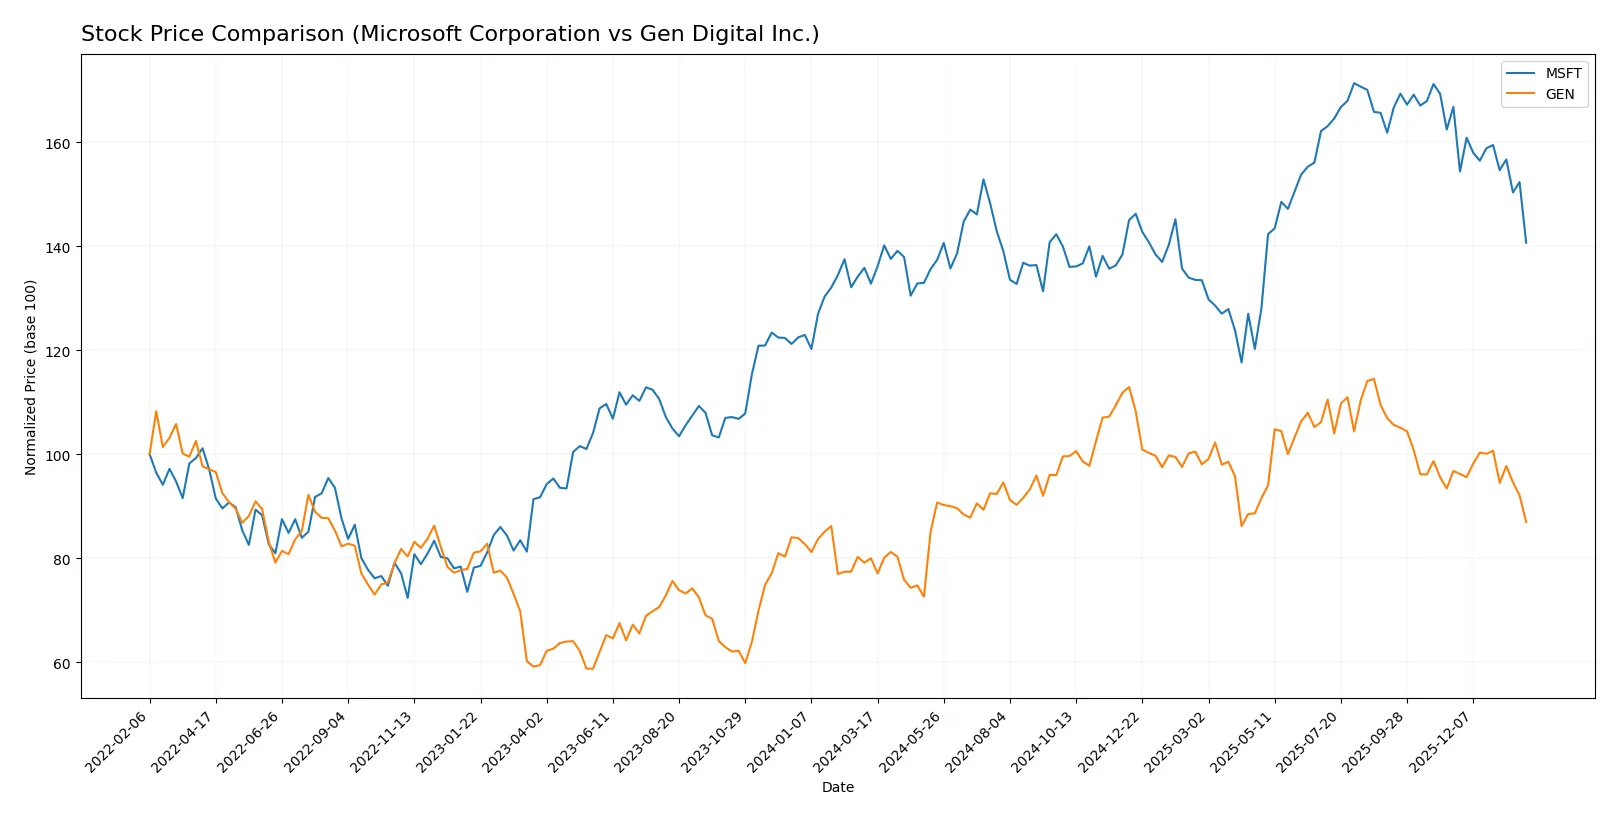
Trend Comparison
Microsoft’s stock rose 5.93% over the past year, marking a bullish trend with deceleration. It hit a high of 524.11 and a low of 359.84, showing significant volatility (std dev 41.93).
Gen Digital’s stock increased 8.7% over the same period, also bullish with deceleration. The price ranged from 20.03 to 31.58, with lower volatility (std dev 2.52) compared to Microsoft.
Both stocks fell recently: Microsoft declined 15.66%, Gen Digital dropped 10.15%. Gen Digital outperformed Microsoft with higher annual gains despite smaller recent losses.
Target Prices
Analysts present a clear bullish consensus for Microsoft Corporation and Gen Digital Inc.
| Company | Target Low | Target High | Consensus |
|---|---|---|---|
| Microsoft Corporation | 450 | 675 | 600.04 |
| Gen Digital Inc. | 31 | 32 | 31.5 |
Microsoft’s target consensus at 600 suggests significant upside from the current 430 price, reflecting strong growth expectations. Gen Digital’s targets near 31.5 also indicate upside potential versus its 24 current price.

Don’t Let Luck Decide Your Entry Point
Optimize your entry points with our advanced ProRealTime indicators. You’ll get efficient buy signals with precise price targets for maximum performance. Start outperforming now!
How do institutions grade them?
Here is a summary of the most recent institutional grades assigned to Microsoft Corporation and Gen Digital Inc.:
Microsoft Corporation Grades
The following table shows recent grades from major financial institutions for Microsoft:
| Grading Company | Action | New Grade | Date |
|---|---|---|---|
| Citigroup | Maintain | Buy | 2026-01-30 |
| Scotiabank | Maintain | Sector Outperform | 2026-01-29 |
| Wells Fargo | Maintain | Overweight | 2026-01-29 |
| RBC Capital | Maintain | Outperform | 2026-01-29 |
| Stifel | Maintain | Buy | 2026-01-29 |
| Evercore ISI Group | Maintain | Outperform | 2026-01-29 |
| Keybanc | Maintain | Overweight | 2026-01-29 |
| Piper Sandler | Maintain | Overweight | 2026-01-29 |
| DA Davidson | Maintain | Buy | 2026-01-29 |
| Cantor Fitzgerald | Maintain | Overweight | 2026-01-29 |
Gen Digital Inc. Grades
The following table shows recent grades from major financial institutions for Gen Digital:
| Grading Company | Action | New Grade | Date |
|---|---|---|---|
| RBC Capital | Maintain | Sector Perform | 2025-11-07 |
| Evercore ISI Group | Maintain | Outperform | 2025-11-07 |
| Morgan Stanley | Maintain | Equal Weight | 2025-09-02 |
| Barclays | Maintain | Equal Weight | 2025-08-08 |
| Wells Fargo | Maintain | Overweight | 2025-08-08 |
| RBC Capital | Maintain | Sector Perform | 2025-08-08 |
| Barclays | Maintain | Equal Weight | 2025-07-14 |
| RBC Capital | Maintain | Sector Perform | 2025-05-07 |
| Morgan Stanley | Maintain | Equal Weight | 2025-04-16 |
| RBC Capital | Maintain | Sector Perform | 2025-01-31 |
Which company has the best grades?
Microsoft consistently receives higher-tier grades such as Buy, Outperform, and Overweight from multiple top-tier banks. Gen Digital’s grades range mostly from Equal Weight to Sector Perform, with fewer Outperform or Overweight ratings. This divergence suggests Microsoft is viewed more favorably by analysts, potentially influencing investor confidence and capital allocation.
Risks specific to each company
The following categories identify critical pressure points and systemic threats facing both firms in the 2026 market environment:
1. Market & Competition
Microsoft Corporation
- Dominates with broad product ecosystem and cloud leadership but faces intense tech sector rivalry.
Gen Digital Inc.
- Operates in a crowded cybersecurity market with strong competitors and evolving threat landscape.
2. Capital Structure & Debt
Microsoft Corporation
- Maintains low debt-to-equity (0.18), strong interest coverage (52.8x), signaling financial stability.
Gen Digital Inc.
- High leverage with debt-to-equity of 3.66 and weaker interest coverage (2.78x), increasing financial risk.
3. Stock Volatility
Microsoft Corporation
- Beta near 1.07 indicates moderate volatility aligned with market; large market cap adds resilience.
Gen Digital Inc.
- Slightly higher beta (1.08) with smaller market cap, suggesting greater relative price swings and risk.
4. Regulatory & Legal
Microsoft Corporation
- Faces ongoing scrutiny on antitrust and privacy but has robust compliance frameworks.
Gen Digital Inc.
- Cybersecurity products subject to evolving data protection laws; regulatory shifts could impact operations.
5. Supply Chain & Operations
Microsoft Corporation
- Complex global supply chain but diversified and agile, mitigating disruption risks.
Gen Digital Inc.
- Smaller scale and reliance on third-party vendors increase vulnerability to operational interruptions.
6. ESG & Climate Transition
Microsoft Corporation
- Strong ESG commitments and targets that align with investor expectations and regulatory trends.
Gen Digital Inc.
- ESG initiatives less mature; potential pressure as climate-related risks grow in tech sector.
7. Geopolitical Exposure
Microsoft Corporation
- Broad international footprint exposes it to global trade tensions and compliance challenges.
Gen Digital Inc.
- Geographically diverse but smaller footprint; sensitive to regional political instability impacting cybersecurity demand.
Which company shows a better risk-adjusted profile?
Microsoft’s dominant market position, conservative capital structure, and strong financial scores provide a superior risk-adjusted profile. Gen Digital’s high leverage and financial distress signals weigh heavily despite its niche cybersecurity focus. Microsoft’s Altman Z-score of 9.7 versus Gen’s 1.2 highlights this stark contrast. Gen Digital’s debt burden and weaker liquidity raise red flags amid a competitive and regulatory environment. I view Microsoft as the safer investment with fewer systemic vulnerabilities in 2026.
Final Verdict: Which stock to choose?
Microsoft’s superpower lies in its unmatched ability to generate consistent cash flow and deliver strong returns on invested capital. Its slight decline in ROIC and premium valuation are points of vigilance. It fits well in portfolios seeking stable, long-term growth with a tolerance for high-quality tech exposure.
Gen Digital’s strategic moat is its focus on recurring revenue and niche software solutions. Although it carries higher leverage and weaker liquidity, it offers a different risk profile with potentially higher free cash flow yields. It suits investors looking for Growth at a Reasonable Price with a tolerance for operational risks.
If you prioritize durable economic moats and consistent value creation, Microsoft is the compelling choice due to its robust cash machine and market leadership. However, if you seek higher free cash flow yield and are comfortable with elevated financial risk, Gen Digital offers a scenario for aggressive growth with a differentiated business model.
Disclaimer: Investment carries a risk of loss of initial capital. The past performance is not a reliable indicator of future results. Be sure to understand risks before making an investment decision.
Go Further
I encourage you to read the complete analyses of Microsoft Corporation and Gen Digital Inc. to enhance your investment decisions: