Home > Comparison > Technology > FTNT vs WIX
The strategic rivalry between Fortinet, Inc. and Wix.com Ltd. shapes the Technology sector’s infrastructure software landscape. Fortinet, a cybersecurity powerhouse, focuses on integrated hardware and software security solutions. In contrast, Wix.com excels as a cloud-based web development platform offering scalable digital services. This analysis evaluates their distinct growth models to identify which company presents a superior risk-adjusted opportunity for a diversified portfolio.
Table of contents
Companies Overview
Fortinet and Wix.com stand as pivotal players in the software infrastructure market. Each commands attention through distinct value propositions and strategic trajectories.
Fortinet, Inc.: Cybersecurity Powerhouse
Fortinet dominates cybersecurity infrastructure with its broad portfolio of integrated, automated solutions worldwide. Its core revenue stems from FortiGate hardware and software licenses offering firewalls, VPNs, and endpoint protection. In 2026, Fortinet prioritizes expanding its security subscription services and scalable management tools to maintain its competitive edge in network defense.
Wix.com Ltd.: Cloud-Based Web Development Leader
Wix.com leads as a cloud platform enabling users to create websites and web apps globally through intuitive drag-and-drop tools. Revenue primarily flows from premium subscriptions and complementary services like Wix Payments and App Market. Wix’s 2026 focus is enhancing automation tools and vertical-specific applications to deepen user engagement and business growth opportunities.
Strategic Collision: Similarities & Divergences
Both firms operate in software infrastructure but diverge sharply in business philosophy—Fortinet builds a secure, closed ecosystem, while Wix fosters an open, user-driven platform. Their primary battleground is digital transformation, with Fortinet securing enterprises and Wix empowering small businesses. This contrast defines their distinct investment profiles: Fortinet as a cybersecurity staple, Wix as a disruptive web innovator.
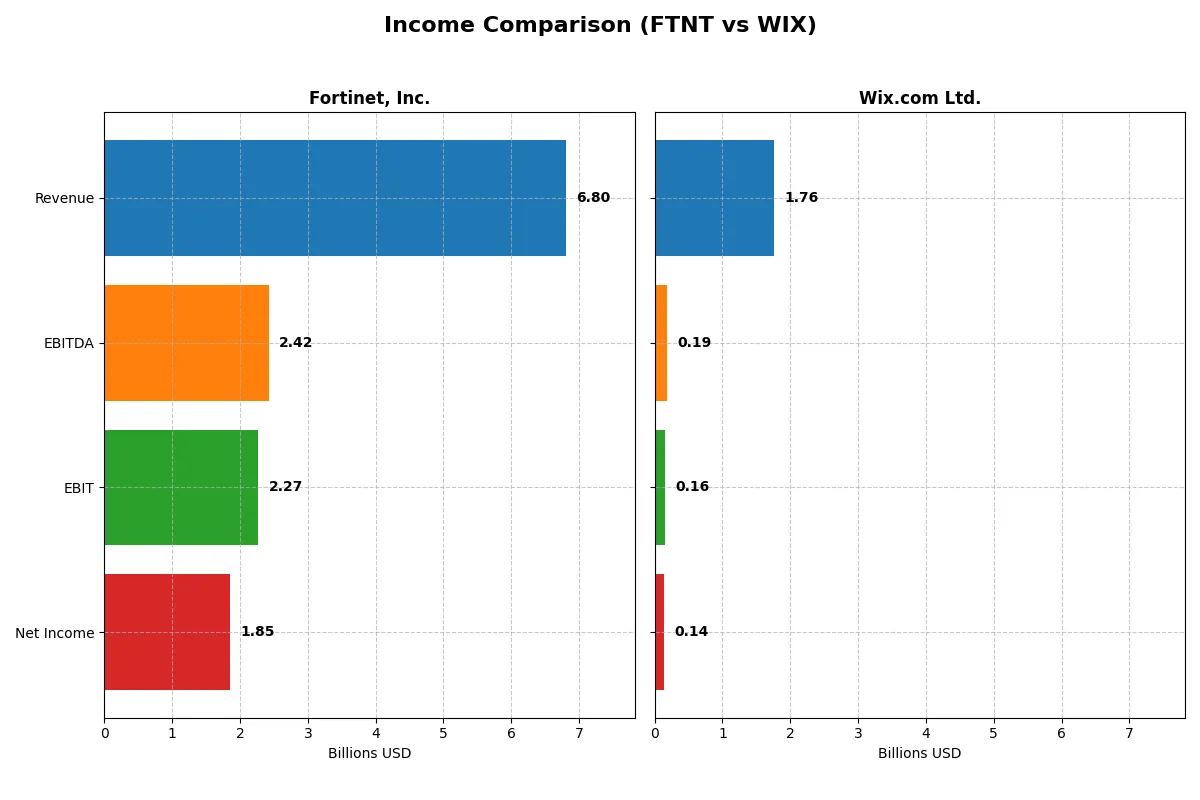
Income Statement Comparison
This data dissects the core profitability and scalability of both corporate engines to reveal who dominates the bottom line:
| Metric | Fortinet, Inc. (FTNT) | Wix.com Ltd. (WIX) |
|---|---|---|
| Revenue | 6.8B | 1.8B |
| Cost of Revenue | 1.3B | 565M |
| Operating Expenses | 3.4B | 1.1B |
| Gross Profit | 5.5B | 1.2B |
| EBITDA | 2.4B | 186M |
| EBIT | 2.3B | 155M |
| Interest Expense | 20M | 3.9M |
| Net Income | 1.9B | 138M |
| EPS | 2.44 | 2.49 |
| Fiscal Year | 2025 | 2024 |
Income Statement Analysis: The Bottom-Line Duel
This income statement comparison reveals which company drives stronger profitability and operational efficiency through their recent financial performance.
Fortinet, Inc. Analysis
Fortinet’s revenue grew from $3.34B in 2021 to $6.80B in 2025, more than doubling over five years. Net income surged from $607M to $1.85B, showcasing robust earnings momentum. Its gross margin remains strong at 80.8%, and net margin at 27.3%, reflecting efficient cost control and solid profitability. The 2025 results underline sustained operational leverage despite rising expenses.
Wix.com Ltd. Analysis
Wix’s revenue expanded from $984M in 2020 to $1.76B in 2024, a notable 79% increase. Net income rebounded sharply from a loss of $167M in 2020 to a profit of $138M in 2024. Its gross margin stands at a healthy 67.9%, but net margin is more modest at 7.9%. The latest year shows significant margin improvement and a strong earnings turnaround signaling operational progress.
Margin Dominance vs. Earnings Recovery
Fortinet clearly leads in scale and profitability with a commanding 27% net margin compared to Wix’s 8%. Both companies grew revenue at double-digit rates recently, but Fortinet’s superior margin profile and $1.85B net income dwarf Wix’s $138M profit. Fortinet’s high-margin, fast-growing model appeals to investors seeking robust earnings quality, while Wix’s trajectory suits those focused on emerging profitability improvements.
Financial Ratios Comparison
These vital ratios act as a diagnostic tool to expose the underlying fiscal health, valuation premiums, and capital efficiency of the companies compared below:
| Ratios | Fortinet, Inc. (FTNT) | Wix.com Ltd. (WIX) |
|---|---|---|
| ROE | 1.50 | -1.76 |
| ROIC | 0.29 | 0.09 |
| P/E | 32.48 | 86.21 |
| P/B | 48.64 | -151.35 |
| Current Ratio | 1.17 | 0.84 |
| Quick Ratio | 1.09 | 0.84 |
| D/E (Debt-to-Equity) | 0.81 | -12.31 |
| Debt-to-Assets | 0.10 | 0.51 |
| Interest Coverage | 103.72 | 25.92 |
| Asset Turnover | 0.65 | 0.92 |
| Fixed Asset Turnover | 4.20 | 3.33 |
| Payout ratio | 0 | 0 |
| Dividend yield | 0 | 0 |
| Fiscal Year | 2025 | 2024 |
Efficiency & Valuation Duel: The Vital Signs
Ratios decode a company’s DNA, exposing hidden risks and operational strengths essential for investment insight.
Fortinet, Inc.
Fortinet shines with a stellar 150% ROE and a robust 27.3% net margin, signaling strong profitability. However, its P/E ratio at 32.5 suggests the stock is somewhat expensive versus averages. Fortinet pays no dividend, instead channeling cash into growth and R&D, reflecting a strategic reinvestment approach.
Wix.com Ltd.
Wix shows a weak ROE of -176% and a modest 7.9% net margin, highlighting profitability challenges. Its P/E ratio at 86.2 marks the stock as highly stretched. Wix also yields no dividend, focusing heavily on R&D to fuel expansion, but its financial health signals caution with an unfavorable current ratio.
Operational Strength vs. Valuation Stretch
Fortinet offers superior profitability and a balanced risk profile despite a premium valuation. Wix struggles with returns and liquidity, making it a riskier bet. Investors seeking operational strength might prefer Fortinet’s profile, while those chasing growth at high cost face a tougher choice with Wix.
Which one offers the Superior Shareholder Reward?
Fortinet and Wix both forgo dividends, focusing on growth reinvestment. Fortinet’s free cash flow per share stands at 2.9, with disciplined capex and a strong buyback history, driving sustainable shareholder returns. Wix boasts higher free cash flow per share near 8.6 but leverages heavily with thin margins and weaker operating cash flow coverage, raising risk. Fortinet’s conservative capital allocation and steady operational leverage offer a more durable total return profile in 2026. I conclude Fortinet delivers superior shareholder reward through prudent buybacks and sustainable growth versus Wix’s aggressive but riskier model.
Comparative Score Analysis: The Strategic Profile
The radar chart reveals the fundamental DNA and trade-offs of Fortinet, Inc. and Wix.com Ltd., spotlighting their financial strengths and valuation challenges side by side:
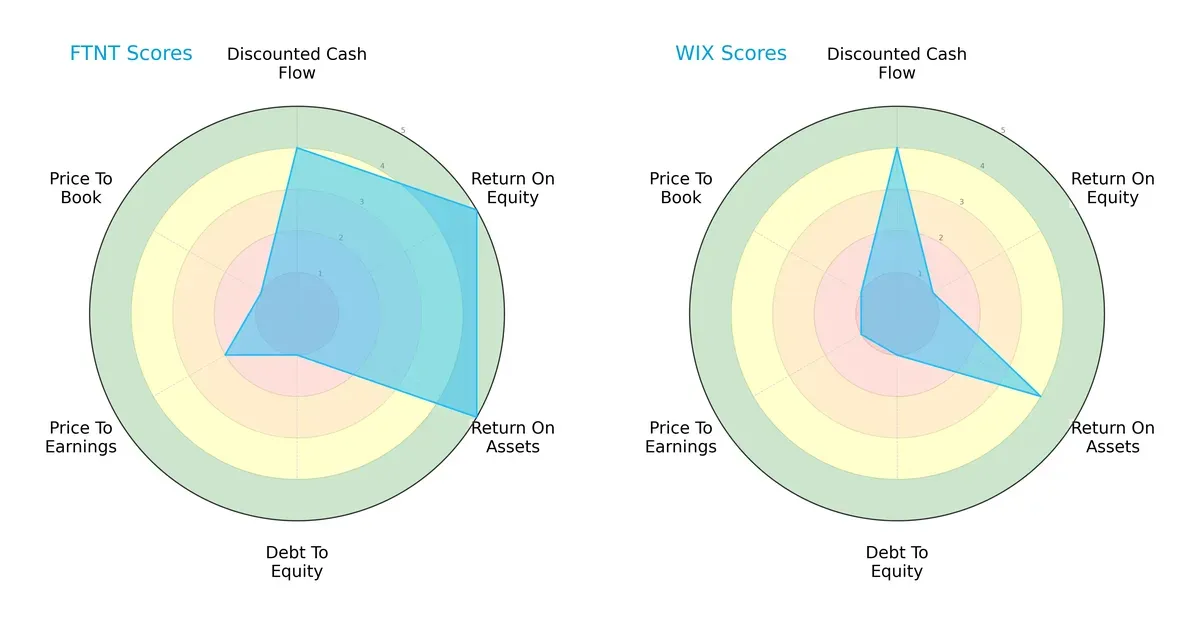
Fortinet exhibits a balanced profile with very favorable ROE and ROA scores, signaling efficient profit generation and asset use. Wix, by contrast, struggles on ROE, reflecting weaker equity returns. Both firms share unfavorable debt-to-equity and valuation scores, indicating leverage and pricing concerns. Fortinet’s stronger operational metrics give it a strategic edge over Wix’s narrower strengths.
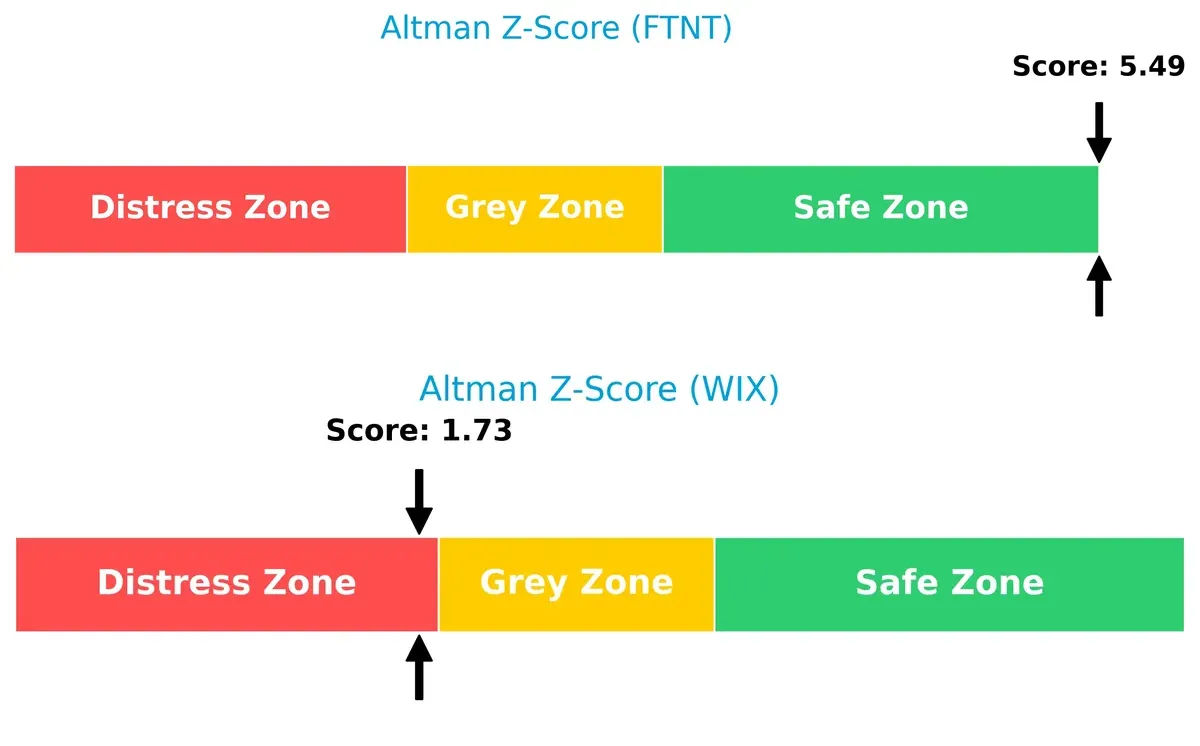
Bankruptcy Risk: Solvency Showdown
Fortinet’s Altman Z-Score (5.49) places it firmly in the safe zone, showcasing robust financial stability. Wix’s score (1.73) signals distress, raising red flags about its long-term survival prospects in this cycle:
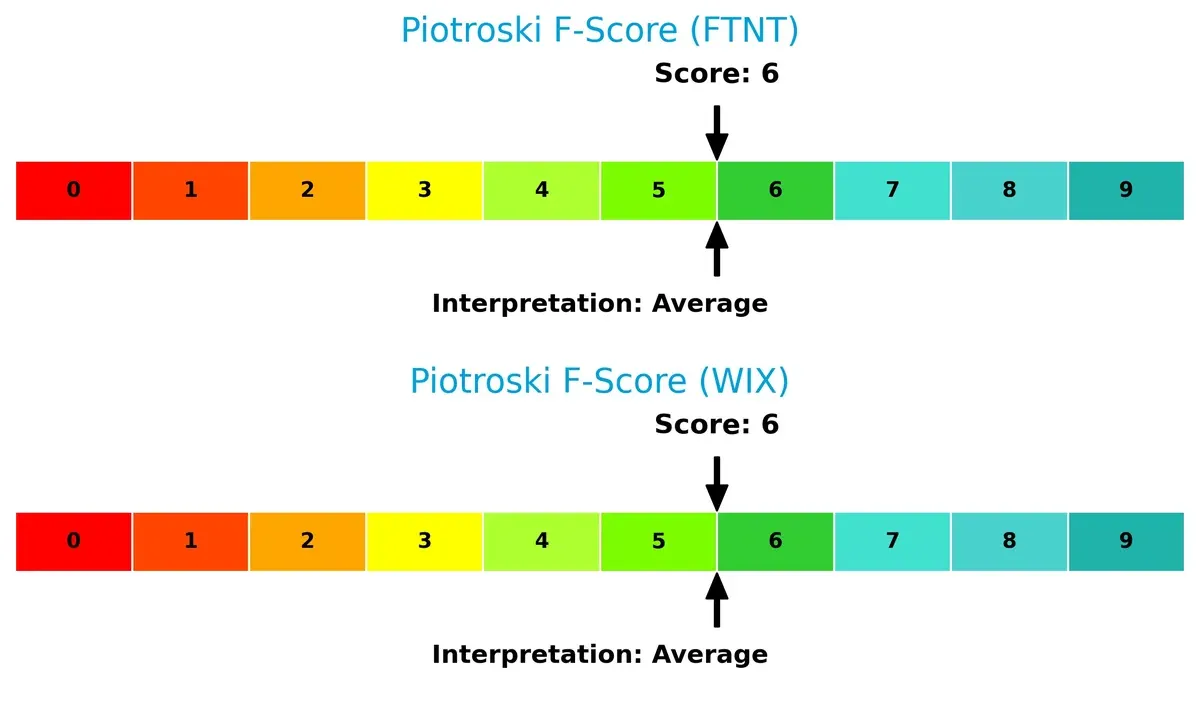
Financial Health: Quality of Operations
Both companies score a 6 on the Piotroski F-Score, indicating average financial health. Neither shows acute internal red flags, but neither reaches peak quality either:
How are the two companies positioned?
This section dissects Fortinet and Wix’s operational DNA by comparing revenue distribution, strengths, and weaknesses. The goal is to confront their economic moats to determine which model delivers the most resilient, sustainable advantage today.
Revenue Segmentation: The Strategic Mix
This comparison dissects how Fortinet and Wix diversify their income streams and reveals where their primary sector bets lie:
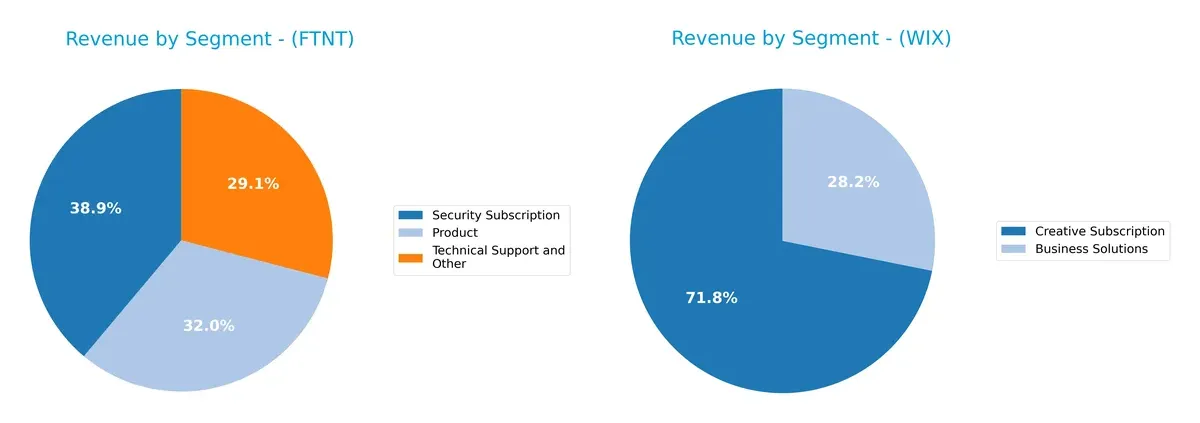
Fortinet anchors its revenue with three substantial segments: Security Subscription at $2.3B, Product at $1.9B, and Technical Support at $1.7B, showing a balanced diversification. Wix pivots mainly on Creative Subscription at $1.3B, with Business Solutions trailing at $496M, indicating heavier reliance on a dominant segment. Fortinet’s mix suggests robust ecosystem lock-in, while Wix faces greater concentration risk with less diversified revenue sources.
Strengths and Weaknesses Comparison
This table compares the strengths and weaknesses of Fortinet and Wix based on diversification, profitability, financials, innovation, global reach, and market share:
Fortinet Strengths
- Strong profitability with 27.26% net margin and 149.77% ROE
- Favorable debt-to-assets at 9.59% indicating low leverage
- Solid quick ratio of 1.09 supports liquidity
- Diverse revenue streams across products, subscriptions, and support
- Broad global presence, especially Americas and EMEA
- High fixed asset turnover at 4.2 reflects efficient asset use
Wix Strengths
- Favorable book value despite negative ROE
- Reasonable interest coverage at 40.14 supports debt servicing
- Higher asset turnover at 0.92 suggests efficient asset use
- Revenue growth in business solutions and creative subscriptions
- Global revenue diversification with strong North America presence
- Favorable fixed asset turnover at 3.33
Fortinet Weaknesses
- High price-to-book ratio at 48.64 may signal overvaluation
- Elevated P/E of 32.48 considered unfavorable
- Zero dividend yield limits income appeal
- Neutral current ratio at 1.17 suggests modest short-term liquidity
- Moderate debt-to-equity at 0.81
- Asset turnover at 0.65 is average and limits growth leverage
Wix Weaknesses
- Negative ROE at -175.57% highlights profitability challenges
- Unfavorable current ratio at 0.84 raises liquidity concerns
- High debt-to-assets at 50.7% increases financial risk
- Elevated P/E at 86.21 implies expensive valuation
- Zero dividend yield limits shareholder returns
- Quick ratio at 0.84 indicates weaker liquidity
Fortinet demonstrates strong profitability and conservative leverage, supporting a solid financial foundation. Wix faces profitability and liquidity hurdles, indicating pressure on capital structure and operational efficiency. Both companies show global reach but differ in financial stability and valuation metrics, impacting strategic flexibility.
The Moat Duel: Analyzing Competitive Defensibility
A structural moat is the critical barrier protecting long-term profits from relentless competition erosion. Let’s dissect the competitive fortresses of Fortinet and Wix:
Fortinet, Inc.: Integrated Cybersecurity Network Moat
Fortinet’s moat stems from its broad, integrated cybersecurity platform, creating strong switching costs and network effects. This manifests in an 80.8% gross margin and a robust 33.4% EBIT margin. In 2026, expanding into AI-enhanced security could deepen its moat amidst rising cyber threats.
Wix.com Ltd.: User-Centric Platform Lock-in
Wix leverages a user-friendly, cloud-based website builder platform with embedded services, forming moderate switching costs. Its 67.9% gross margin and improving EBIT margin reflect growing operational leverage. Wix’s moat is narrower but expanding via AI-driven automation and payment integrations.
Fortinet’s Enterprise Security vs. Wix’s Platform Convenience
Fortinet holds a wider, deeper moat with a 20%+ ROIC premium over WACC, signaling sustainable value creation. Wix shows a positive ROIC trend but remains close to WACC, indicating a developing moat. Fortinet is better equipped to defend and grow its market share in the evolving tech landscape.
Which stock offers better returns?
The chart highlights Fortinet’s strong 24% gain over the past year amid decelerating momentum. Wix, by contrast, endured a sharp 44% decline with heightened volatility and accelerating losses.
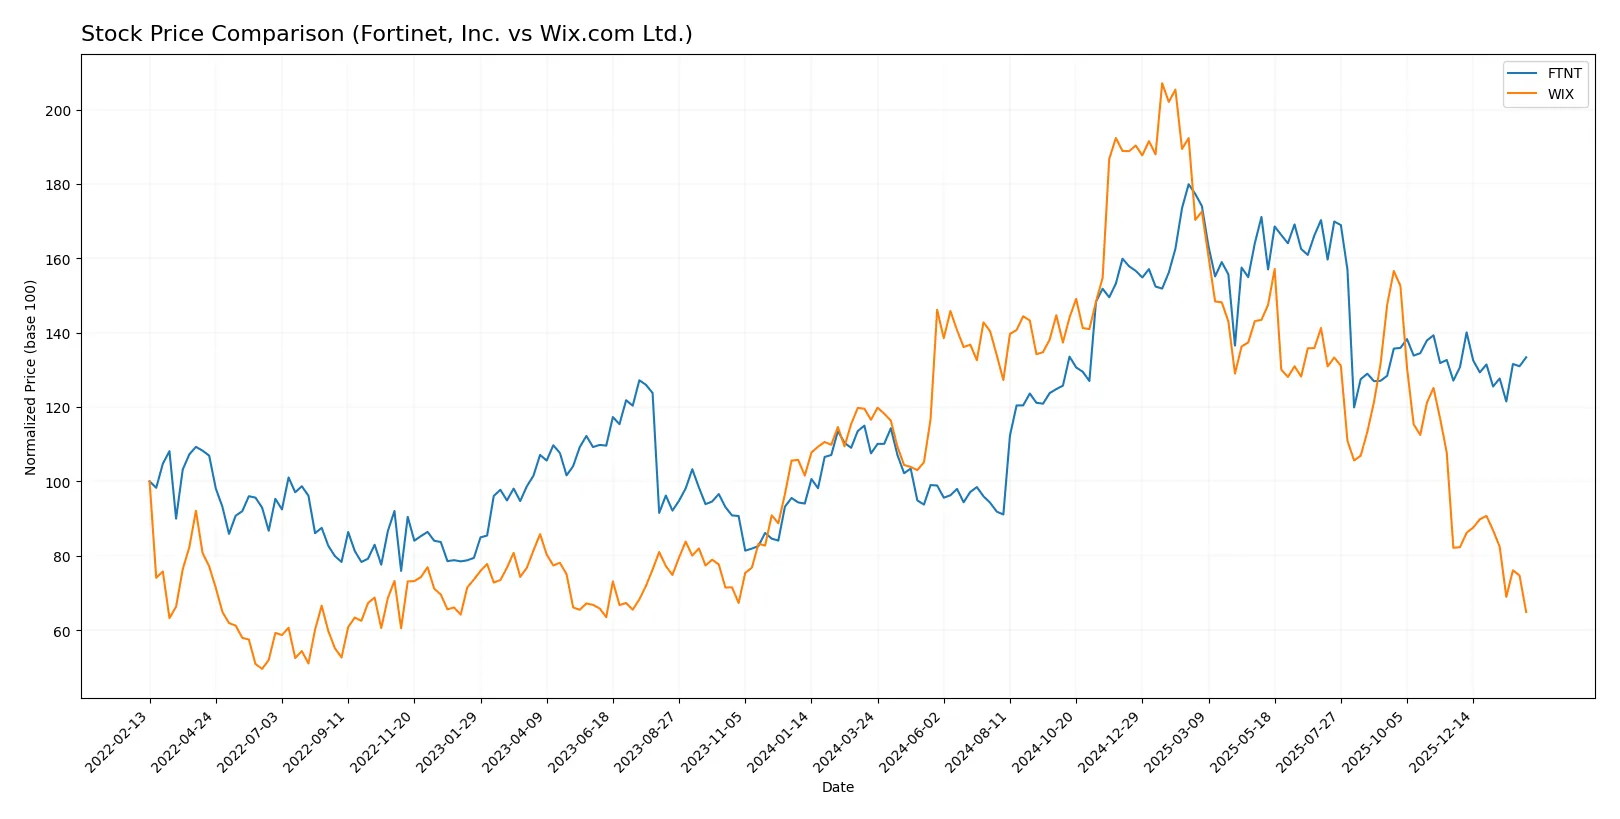
Trend Comparison
Fortinet’s stock rose 24.04% over the last 12 months, marking a bullish trend despite decelerating gains. The price ranged from 56.51 to a 111.64 peak, reflecting robust but slowing upward momentum.
Wix’s stock fell 44.37% in the same period, signaling a bearish trend with decelerating losses. Volatility remained high, with prices oscillating between 75.42 and 240.89, confirming steep downward pressure.
Fortinet clearly outperformed Wix, delivering the highest market returns over the past year with a positive price trend versus Wix’s significant decline.
Target Prices
Analysts present a bullish consensus for Fortinet, Inc. and Wix.com Ltd., reflecting confidence in their growth prospects.
| Company | Target Low | Target High | Consensus |
|---|---|---|---|
| Fortinet, Inc. | 70 | 90 | 85 |
| Wix.com Ltd. | 70 | 210 | 154.09 |
Fortinet’s target consensus at 85 slightly exceeds its current 82.76 price, signaling moderate upside. Wix’s consensus target of 154.09 implies substantial growth potential versus its current 75.42 price.

Don’t Let Luck Decide Your Entry Point
Optimize your entry points with our advanced ProRealTime indicators. You’ll get efficient buy signals with precise price targets for maximum performance. Start outperforming now!
How do institutions grade them?
Here are the latest institutional grades for Fortinet, Inc. and Wix.com Ltd.:
Fortinet, Inc. Grades
The following table summarizes recent grades assigned to Fortinet by major financial institutions.
| Grading Company | Action | New Grade | Date |
|---|---|---|---|
| Rosenblatt | Maintain | Buy | 2026-02-06 |
| Mizuho | Maintain | Underperform | 2026-02-06 |
| JP Morgan | Maintain | Underweight | 2026-02-06 |
| RBC Capital | Maintain | Sector Perform | 2026-02-06 |
| Wedbush | Maintain | Outperform | 2026-02-06 |
| Scotiabank | Downgrade | Sector Perform | 2026-02-02 |
| JP Morgan | Maintain | Underweight | 2026-01-30 |
| Rosenblatt | Upgrade | Buy | 2026-01-29 |
| TD Cowen | Upgrade | Buy | 2026-01-23 |
| Citigroup | Maintain | Neutral | 2026-01-13 |
Wix.com Ltd. Grades
This table displays recent grades for Wix.com Ltd. from reputable grading firms.
| Grading Company | Action | New Grade | Date |
|---|---|---|---|
| Oppenheimer | Maintain | Outperform | 2026-02-02 |
| Citizens | Maintain | Market Outperform | 2026-01-22 |
| Barclays | Maintain | Overweight | 2026-01-21 |
| Morgan Stanley | Maintain | Overweight | 2026-01-15 |
| Wells Fargo | Maintain | Overweight | 2025-12-19 |
| Cantor Fitzgerald | Maintain | Overweight | 2025-12-11 |
| Benchmark | Maintain | Buy | 2025-11-20 |
| Needham | Maintain | Buy | 2025-11-20 |
| Barclays | Maintain | Overweight | 2025-11-20 |
| Wells Fargo | Maintain | Overweight | 2025-11-20 |
Which company has the best grades?
Wix.com Ltd. consistently receives higher ratings such as Outperform and Overweight, indicating stronger institutional confidence. Fortinet’s grades vary widely, including Underperform and Buy, reflecting mixed sentiment. Investors may interpret Wix’s steadier positive outlook as a sign of relative stability.
Risks specific to each company
The categories below identify critical pressure points and systemic threats facing Fortinet, Inc. and Wix.com Ltd. in the 2026 market environment:
1. Market & Competition
Fortinet, Inc.
- Operates in cybersecurity with strong competitive moat but faces intense innovation pressure.
Wix.com Ltd.
- Competes in website development with rapid new entrants and shifting user preferences.
2. Capital Structure & Debt
Fortinet, Inc.
- Moderate debt-to-equity (0.81) and low debt-to-assets (9.59%) indicate manageable leverage risk.
Wix.com Ltd.
- Negative debt-to-equity ratio and high debt-to-assets (50.7%) raise financial stability concerns.
3. Stock Volatility
Fortinet, Inc.
- Beta near market average (1.05) suggests moderate volatility relative to S&P 500.
Wix.com Ltd.
- Higher beta (1.37) signals greater stock price swings and sensitivity to market shifts.
4. Regulatory & Legal
Fortinet, Inc.
- Subject to global cybersecurity regulations, with compliance costs but strong governance.
Wix.com Ltd.
- Faces international data privacy laws and e-commerce regulations, increasing compliance complexity.
5. Supply Chain & Operations
Fortinet, Inc.
- Hardware-dependent supply chain vulnerable to semiconductor shortages and geopolitical tensions.
Wix.com Ltd.
- Cloud-based platform reduces physical supply risk but depends heavily on internet infrastructure stability.
6. ESG & Climate Transition
Fortinet, Inc.
- Increasing focus on sustainable operations and energy-efficient products amid rising ESG expectations.
Wix.com Ltd.
- Faces pressure to enhance ESG disclosures and reduce carbon footprint in data centers.
7. Geopolitical Exposure
Fortinet, Inc.
- Operates globally but US-centric, moderate exposure to trade tensions and export controls.
Wix.com Ltd.
- Israeli base creates added regional political risk, with international expansion complexities.
Which company shows a better risk-adjusted profile?
Fortinet’s strongest risk is capital structure resilience, supported by a healthy Altman Z-score (5.49, safe zone). Wix’s most pressing risk lies in financial distress signals, reflected by a low Altman Z-score (1.73, distress zone) and weaker capital structure. Fortinet’s moderate stock volatility and favorable profitability metrics outperform Wix’s higher volatility and negative return on equity. Hence, Fortinet shows a superior risk-adjusted profile, justified by its robust leverage management and consistent operational profitability.
Final Verdict: Which stock to choose?
Fortinet’s superpower lies in its robust value creation, consistently generating returns well above its cost of capital. This efficiency signals a durable competitive moat and strong cash flow generation. Its point of vigilance is a stretched valuation, which might pressure returns if growth slows. It suits investors focused on aggressive growth and high-quality profitability.
Wix.com’s strategic moat centers on rapid innovation and recurring customer revenues, fueling impressive top-line expansion. However, its balance sheet shows vulnerability with weaker liquidity and higher leverage compared to Fortinet, raising caution for risk-averse investors. Wix fits those seeking growth at a reasonable price with a tolerance for operational variability.
If you prioritize enduring value creation and operational strength, Fortinet outshines Wix due to its sustainable competitive advantage and superior profitability metrics. However, if you seek dynamic revenue growth with a tolerance for balance sheet risks, Wix offers a compelling growth story despite current financial fragility. Each stock appeals to distinct investor profiles navigating different risk-reward trade-offs.
Disclaimer: Investment carries a risk of loss of initial capital. The past performance is not a reliable indicator of future results. Be sure to understand risks before making an investment decision.
Go Further
I encourage you to read the complete analyses of Fortinet, Inc. and Wix.com Ltd. to enhance your investment decisions: