In today’s dynamic technology sector, The Trade Desk, Inc. (TTD) and Figma, Inc. (FIG) stand out as innovative software companies shaping digital experiences. While The Trade Desk specializes in data-driven digital advertising platforms, Figma leads in collaborative design tools for product development. Both operate in cutting-edge markets with overlapping emphasis on cloud-based solutions and user engagement. This article will help you decide which company presents the most compelling investment opportunity in 2026.
Table of contents
Companies Overview
I will begin the comparison between The Trade Desk and Figma by providing an overview of these two companies and their main differences.
The Trade Desk Overview
The Trade Desk, Inc. operates a self-service cloud-based platform enabling buyers to create, manage, and optimize data-driven digital advertising campaigns. It covers various ad formats and channels such as display, video, audio, native, and social on devices including computers, mobile, and connected TV. Founded in 2009 and headquartered in Ventura, California, The Trade Desk serves advertising agencies and other service providers worldwide.
Figma Overview
Figma, Inc. develops a browser-based collaborative design tool that supports user interface creation and product development. Its offerings include Figma Design, Dev Mode, FigJam, and AI-powered Figma Make, among others. Incorporated in 2012 and based in San Francisco, California, Figma targets design and development teams to streamline the creative and prototyping process across multiple platforms.
Key similarities and differences
Both The Trade Desk and Figma operate in the software application industry within the U.S. technology sector, focusing on cloud-based platforms. However, The Trade Desk specializes in digital advertising campaign management, while Figma provides design and collaboration tools for UI and product development teams. Their business models differ in target users—advertisers versus designers—and in core functionalities, advertising optimization versus creative design and prototyping.
Income Statement Comparison
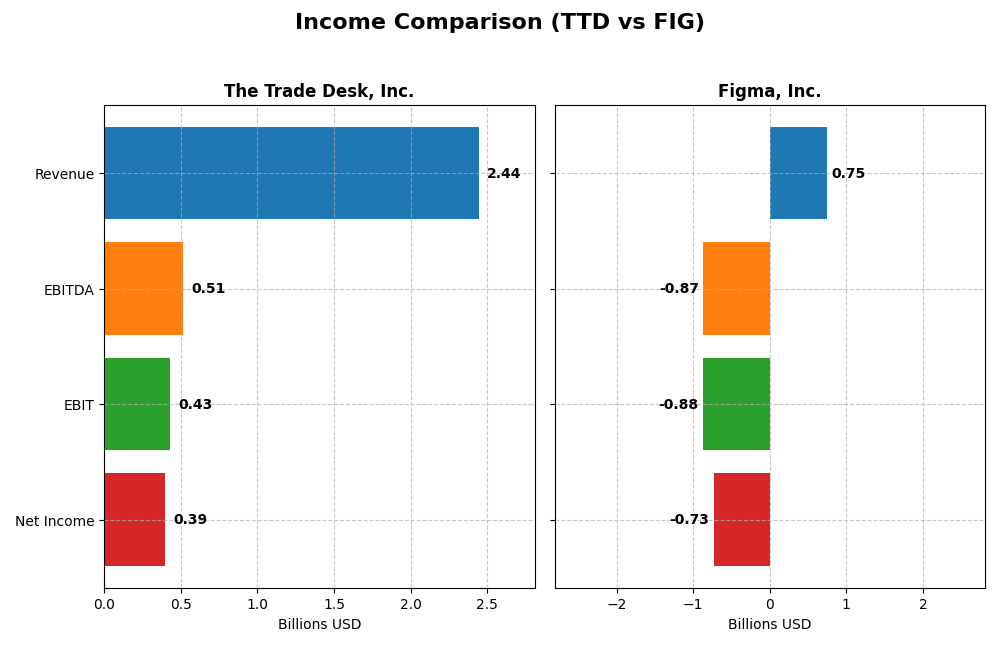
The table below presents the latest fiscal year income statement metrics for The Trade Desk, Inc. and Figma, Inc., offering a clear financial snapshot for comparison.
| Metric | The Trade Desk, Inc. (TTD) | Figma, Inc. (FIG) |
|---|---|---|
| Market Cap | 17.3B | 14.4B |
| Revenue | 2.44B | 749M |
| EBITDA | 515M | -870M |
| EBIT | 427M | -877M |
| Net Income | 393M | -732M |
| EPS | 0.80 | -3.11 |
| Fiscal Year | 2024 | 2024 |
Income Statement Interpretations
The Trade Desk, Inc.
The Trade Desk, Inc. has shown strong revenue growth from 2020 to 2024, nearly tripling its top line to $2.44B in 2024. Net income also rose substantially, reaching $393M in 2024, despite a slight decline in net margin over the period. In 2024, the company improved its EBIT margin to 17.47%, reflecting enhanced operational efficiency and robust profitability.
Figma, Inc.
Figma, Inc. reported rapid revenue growth from 2023 to 2024, increasing 48.36% to $749M. However, it posted significant net losses, with a net margin of -97.74% in 2024 and an EBIT margin deeply negative at -117.15%. The steep rise in operating expenses outpaced revenue growth, resulting in deteriorated profitability and a net loss of $732M in the latest year.
Which one has the stronger fundamentals?
The Trade Desk presents stronger fundamentals with consistent revenue and net income growth, favorable gross and EBIT margins, and positive net margin expansion in the latest year. Conversely, Figma struggles with high losses and negative margins despite revenue acceleration. The robust profitability and margin control of The Trade Desk contrast with Figma’s unfavorable income statement metrics.
Financial Ratios Comparison
The table below presents the most recent key financial ratios for The Trade Desk, Inc. and Figma, Inc., providing a snapshot of their financial health and market valuation as of fiscal year 2024.
| Ratios | The Trade Desk, Inc. (TTD) | Figma, Inc. (FIG) |
|---|---|---|
| ROE | 13.3% | -55.3% |
| ROIC | 10.0% | -59.7% |
| P/E | 147 | -70.7 |
| P/B | 19.6 | 39.1 |
| Current Ratio | 1.86 | 3.66 |
| Quick Ratio | 1.86 | 3.66 |
| D/E (Debt-to-Equity) | 0.11 | 0.02 |
| Debt-to-Assets | 5.1% | 1.6% |
| Interest Coverage | 0 (not reported) | 0 (not reported) |
| Asset Turnover | 0.40 | 0.42 |
| Fixed Asset Turnover | 5.17 | 17.1 |
| Payout ratio | 0 | 0 |
| Dividend yield | 0% | 0% |
Interpretation of the Ratios
The Trade Desk, Inc.
The Trade Desk shows generally strong financial ratios with favorable net margin at 16.08% and return on invested capital at 10.02%, though price multiples like PE at 146.77 and PB at 19.56 appear stretched. Liquidity and leverage indicators are solid, with a current ratio of 1.86 and low debt levels. The company does not pay dividends, likely focusing on reinvestment and growth.
Figma, Inc.
Figma’s ratios reveal significant weaknesses, including a negative net margin of -97.74% and poor returns on equity and capital, reflecting operational challenges. Despite a low debt ratio and a favorable weighted average cost of capital at 4.76%, its valuation multiples and liquidity metrics are mixed. Figma also does not pay dividends, consistent with a growth and reinvestment phase.
Which one has the best ratios?
The Trade Desk exhibits a predominantly favorable ratio profile, with strong profitability and manageable debt, despite high valuation multiples. Figma displays more unfavorable ratios, particularly in profitability and returns, reflecting a less mature financial state. Overall, The Trade Desk maintains a more balanced and favorable ratio set compared to Figma.
Strategic Positioning
This section compares the strategic positioning of The Trade Desk, Inc. and Figma, Inc. in terms of market position, key segments, and exposure to technological disruption:
The Trade Desk, Inc.
- Operates a cloud-based digital advertising platform facing competitive pressure in ad tech.
- Key business drivers include digital advertising across multiple formats and devices globally.
- Exposure includes evolving digital advertising technologies and data-driven marketing trends.
Figma, Inc.
- Develops browser-based collaborative design tools competing in software for UI design.
- Focuses on UI design, prototyping, and collaboration tools for design and development teams.
- Faces technological disruption from AI-enabled design tools and evolving collaborative software.
The Trade Desk, Inc. vs Figma, Inc. Positioning
The Trade Desk pursues a diversified approach targeting multiple ad formats and devices, while Figma concentrates on collaborative UI design tools. The Trade Desk benefits from broader market reach, whereas Figma focuses on innovation in design software, each with distinct competitive challenges.
Which has the best competitive advantage?
Based on MOAT evaluation, The Trade Desk shows a slightly unfavorable position with declining profitability, while Figma’s very unfavorable status indicates greater value destruction, suggesting The Trade Desk currently maintains a relatively stronger competitive advantage.
Stock Comparison
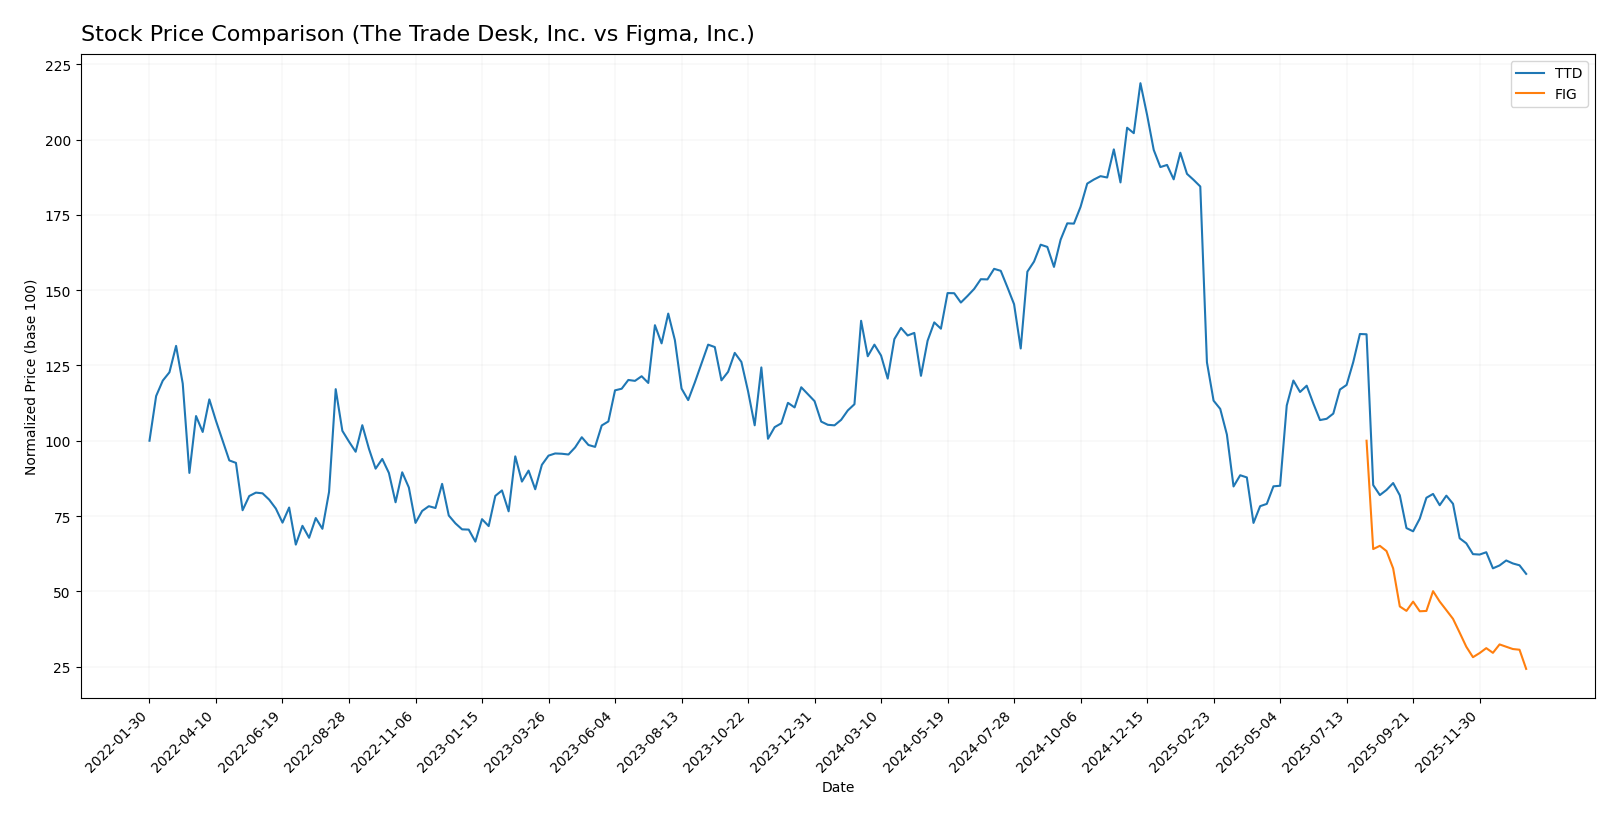
The stock prices of The Trade Desk, Inc. (TTD) and Figma, Inc. (FIG) have both exhibited significant declines over the past 12 months, with notable bearish trends and marked decreases in market valuation.
Trend Analysis
The Trade Desk, Inc. showed a bearish trend over the past year with a price decline of 56.43%, decelerating downward momentum, and a high volatility reflected by a 28.36 std deviation. Its highest price reached 139.11, while the lowest dropped to 35.48.
Figma, Inc. also experienced a bearish trend, with a steeper total price decrease of 75.76% over the year, accelerating losses, and lower volatility at a 19.95 std deviation. The stock fluctuated between 122.0 at its peak and 29.57 at its low.
Comparing both, The Trade Desk delivered a higher market performance than Figma during the analyzed period, despite both stocks facing sustained substantial declines.
Target Prices
Analysts provide a clear consensus on target prices for both The Trade Desk, Inc. and Figma, Inc.
| Company | Target High | Target Low | Consensus |
|---|---|---|---|
| The Trade Desk, Inc. | 98 | 39 | 56.73 |
| Figma, Inc. | 52 | 38 | 43.6 |
The Trade Desk’s consensus target price of 56.73 significantly exceeds its current price of 35.48, indicating potential upside. Similarly, Figma’s consensus target of 43.6 is above its current price of 29.57, suggesting bullish analyst sentiment.
Analyst Opinions Comparison
This section compares analysts’ ratings and grades for The Trade Desk, Inc. (TTD) and Figma, Inc. (FIG):
Rating Comparison
TTD Rating
- Rating: B, considered Very Favorable overall.
- Discounted Cash Flow Score: 4, Favorable, indicating good valuation outlook.
- ROE Score: 4, Favorable, showing efficient profit generation from equity.
- ROA Score: 4, Favorable, demonstrating effective asset utilization.
- Debt To Equity Score: 3, Moderate, reflecting balanced financial risk.
- Overall Score: 3, Moderate overall financial standing.
FIG Rating
- Rating: C+, also considered Very Favorable overall.
- Discounted Cash Flow Score: 4, Favorable, indicating good valuation outlook.
- ROE Score: 1, Very Unfavorable, indicating low efficiency in profit generation.
- ROA Score: 1, Very Unfavorable, suggesting poor asset utilization.
- Debt To Equity Score: 4, Favorable, indicating lower financial risk.
- Overall Score: 2, Moderate overall financial standing.
Which one is the best rated?
TTD holds a higher rating (B) and superior scores in ROE and ROA compared to FIG’s C+ rating and very unfavorable scores in those areas. FIG has a better debt-to-equity score, but TTD’s overall scores indicate a stronger financial profile based on the provided data.
Scores Comparison
Here is a comparison of the Altman Z-Score and Piotroski Score for The Trade Desk, Inc. (TTD) and Figma, Inc. (FIG):
TTD Scores
- Altman Z-Score: 4.30, indicating financial safety in the safe zone.
- Piotroski Score: 5, representing average financial strength.
FIG Scores
- Altman Z-Score: 14.34, indicating strong financial safety in the safe zone.
- Piotroski Score: 4, representing average financial strength.
Which company has the best scores?
FIG has a notably higher Altman Z-Score than TTD, suggesting stronger financial safety. Both companies have average Piotroski Scores, with TTD slightly higher by one point.
Grades Comparison
Here is a comparison of recent grades assigned to The Trade Desk, Inc. and Figma, Inc. by reputable grading companies:
The Trade Desk, Inc. Grades
The following table shows recent grades given by recognized financial institutions for The Trade Desk, Inc.:
| Grading Company | Action | New Grade | Date |
|---|---|---|---|
| Morgan Stanley | Maintain | Equal Weight | 2026-01-13 |
| Wells Fargo | Maintain | Equal Weight | 2026-01-12 |
| Cantor Fitzgerald | Maintain | Neutral | 2026-01-08 |
| Wolfe Research | Maintain | Outperform | 2026-01-06 |
| Guggenheim | Maintain | Buy | 2026-01-05 |
| Jefferies | Maintain | Hold | 2025-12-11 |
| Wedbush | Maintain | Neutral | 2025-12-08 |
| DA Davidson | Maintain | Buy | 2025-11-10 |
| Truist Securities | Maintain | Buy | 2025-11-07 |
| Wells Fargo | Maintain | Equal Weight | 2025-11-07 |
The Trade Desk’s grades range from Hold to Buy/Outperform, with the consensus rating indicating a Buy trend.
Figma, Inc. Grades
The following table presents recent grades assigned to Figma, Inc. by established grading firms:
| Grading Company | Action | New Grade | Date |
|---|---|---|---|
| Morgan Stanley | Maintain | Equal Weight | 2026-01-15 |
| Wells Fargo | Upgrade | Overweight | 2026-01-08 |
| RBC Capital | Maintain | Sector Perform | 2026-01-05 |
| Goldman Sachs | Maintain | Neutral | 2025-11-07 |
| JP Morgan | Maintain | Neutral | 2025-11-06 |
| Piper Sandler | Maintain | Overweight | 2025-11-06 |
| Wells Fargo | Maintain | Equal Weight | 2025-11-05 |
| Wells Fargo | Maintain | Equal Weight | 2025-09-04 |
| Morgan Stanley | Maintain | Equal Weight | 2025-09-04 |
| RBC Capital | Maintain | Sector Perform | 2025-09-04 |
Figma’s grades mostly cluster between Neutral and Overweight, with a consensus rating of Hold.
Which company has the best grades?
The Trade Desk, Inc. has predominantly Buy and Outperform grades, while Figma, Inc. mostly holds Neutral to Overweight ratings with a Hold consensus. This suggests stronger analyst confidence in The Trade Desk’s near-term prospects, which may influence investor sentiment accordingly.
Strengths and Weaknesses
Below is a comparative overview of key strengths and weaknesses for The Trade Desk, Inc. (TTD) and Figma, Inc. (FIG) based on the most recent financial and strategic data.
| Criterion | The Trade Desk, Inc. (TTD) | Figma, Inc. (FIG) |
|---|---|---|
| Diversification | Moderate; focused on digital ad tech | Limited; mainly design software |
| Profitability | Favorable net margin (16.08%), positive ROIC (10.02%) | Unfavorable net margin (-97.74%), negative ROIC (-59.68%) |
| Innovation | Strong in programmatic advertising tech | High innovation in collaborative design tools |
| Global presence | Established global footprint | Growing but less global reach |
| Market Share | Significant in ad tech market | Smaller, niche market player |
Key takeaways: The Trade Desk shows better profitability and financial stability with a moderate diversification and strong market position. Figma leads in innovation but faces serious profitability challenges and lower market penetration, indicating higher risk for investors.
Risk Analysis
Below is a comparison of key risks for The Trade Desk, Inc. (TTD) and Figma, Inc. (FIG) based on the most recent data from 2024.
| Metric | The Trade Desk, Inc. (TTD) | Figma, Inc. (FIG) |
|---|---|---|
| Market Risk | Moderate (Beta 1.11, volatile price range) | High (Beta -3.80, sharp recent price drops) |
| Debt Level | Low (Debt/Equity 0.11, favorable) | Very Low (Debt/Equity 0.02, favorable) |
| Regulatory Risk | Moderate (Tech sector scrutiny) | Moderate (Tech sector scrutiny) |
| Operational Risk | Moderate (Complex ad platform operations) | High (Early-stage, losses and negative margins) |
| Environmental Risk | Low (Limited direct impact reported) | Low (Limited direct impact reported) |
| Geopolitical Risk | Moderate (Global digital ad market exposure) | Moderate (Global software market exposure) |
The most impactful risk for Figma is operational and financial instability, given its negative margins and unfavorable profitability metrics, despite a strong Altman Z-score indicating low bankruptcy risk. The Trade Desk shows moderate market and operational risks but benefits from low debt and favorable financial health, making it comparatively more stable. Investors should weigh Figma’s growth potential against its current financial risks and The Trade Desk’s steadier profile with valuation concerns.
Which Stock to Choose?
The Trade Desk, Inc. (TTD) shows strong income growth with revenues up 192% over five years and a favorable net margin of 16.08%. Its financial ratios are mostly favorable, including solid liquidity and low debt levels, though valuation multiples appear stretched. Profitability remains decent with a return on equity at 13.3%, while its rating is very favorable overall.
Figma, Inc. (FIG) presents high revenue growth of 48% in the last year but suffers from negative profitability and unfavorable financial ratios such as a net margin of -97.74% and declining returns. Despite low debt and a strong current ratio, its overall rating is very favorable but reflects financial challenges and value destruction.
For investors prioritizing growth and income stability, TTD’s favorable rating and solid income statement might appear more suitable, while FIG’s profile could be more aligned with risk-tolerant investors seeking high revenue expansion despite profitability concerns. The choice could thus depend on one’s risk tolerance and investment focus.
Disclaimer: Investment carries a risk of loss of initial capital. The past performance is not a reliable indicator of future results. Be sure to understand risks before making an investment decision.
Go Further
I encourage you to read the complete analyses of The Trade Desk, Inc. and Figma, Inc. to enhance your investment decisions: