In the dynamic world of technology, Figma, Inc. and ServiceTitan, Inc. stand out as innovative leaders in software applications. While Figma revolutionizes collaborative design tools for product development, ServiceTitan streamlines field service management for residential and commercial infrastructure. Both companies share a commitment to innovation and market disruption, making their comparison essential. In this article, I will help you decide which company offers the most promising investment opportunity in 2026.
Table of contents
Companies Overview
I will begin the comparison between Figma and ServiceTitan by providing an overview of these two companies and their main differences.
Figma Overview
Figma, Inc. develops browser-based design tools aimed at enabling design and development teams to collaborate on user interface projects. The company offers a suite of products including Figma Design for prototyping, Dev Mode for code translation, and AI tools like Figma Make. Founded in 2012 and headquartered in San Francisco, Figma is positioned in the software application industry with a market cap of approximately 14.4B USD.
ServiceTitan Overview
ServiceTitan, Inc. provides software to manage field service operations for installing, maintaining, and servicing infrastructure in residential and commercial buildings. Founded in 2008 and based in Glendale, California, ServiceTitan serves the technology sector with a focus on field service management. It has a market cap of about 8.5B USD and employs over 3,000 full-time staff.
Key similarities and differences
Both companies operate in the software application industry within the technology sector, targeting specialized professional workflows through digital platforms. Figma focuses on collaborative design and prototyping tools primarily for creative teams, while ServiceTitan concentrates on field service management for physical infrastructure services. Their market caps show Figma as the larger entity, with ServiceTitan having a more established workforce by full-time employee count.
Income Statement Comparison
This table presents a side-by-side comparison of key income statement metrics for Figma, Inc. and ServiceTitan, Inc. based on their most recent fiscal year results.
| Metric | Figma, Inc. (FIG) | ServiceTitan, Inc. (TTAN) |
|---|---|---|
| Market Cap | 14.4B | 8.5B |
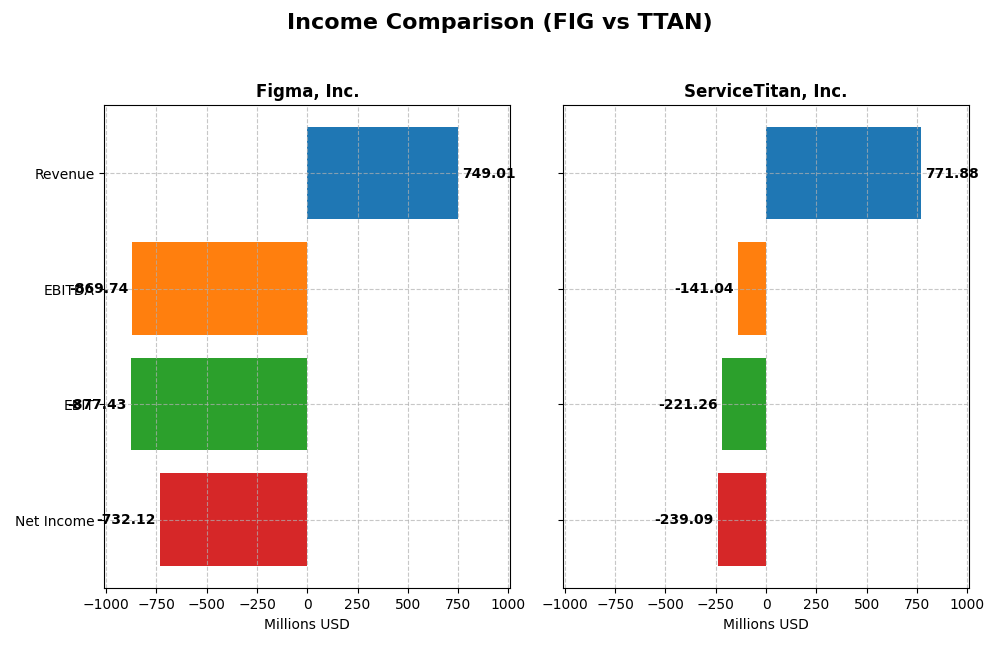
| Revenue | 749M | 772M |
| EBITDA | -870M | -141M |
| EBIT | -877M | -221M |
| Net Income | -732M | -239M |
| EPS | -3.11 | -8.53 |
| Fiscal Year | 2024 | 2025 |
Income Statement Interpretations
Figma, Inc.
Figma’s revenue increased significantly by 48.36% from 2023 to 2024, reaching $749M, while net income swung to a loss of $732M from a profit in the previous year. Gross margin remained highly favorable at 88.32%, but operating expenses grew disproportionately, leading to a negative EBIT margin of -117.15%. The 2024 results indicate slowing profitability despite strong top-line growth.
ServiceTitan, Inc.
ServiceTitan showed steady revenue growth over three years, reaching $772M in 2025, a 25.64% increase from 2024. Net income remained negative but improved overall by 11.29%. Gross margin was stable and favorable at 64.9%. Despite ongoing operating losses, net margin improved slightly, reflecting better cost control in the latest fiscal year compared to prior periods.
Which one has the stronger fundamentals?
ServiceTitan demonstrates relatively stronger fundamentals with consistent revenue growth, improving net income trends, and a favorable gross margin of 64.9%. Figma, while posting higher revenue growth and superior gross margins, faces significant operating losses and negative net margins. Overall, ServiceTitan’s more balanced income statement reflects a cautiously more favorable financial position.
Financial Ratios Comparison
The table below presents key financial ratios for Figma, Inc. (FIG) and ServiceTitan, Inc. (TTAN) based on their most recent fiscal year data, allowing for a straightforward comparison of their financial health and performance metrics.
| Ratios | Figma, Inc. (2024) | ServiceTitan, Inc. (2025) |
|---|---|---|
| ROE | -55.3% | -16.4% |
| ROIC | -59.7% | -14.1% |
| P/E | -70.7 | -18.1 |
| P/B | 39.1 | 3.0 |
| Current Ratio | 3.66 | 3.74 |
| Quick Ratio | 3.66 | 3.74 |
| D/E (Debt-to-Equity) | 0.022 | 0.114 |
| Debt-to-Assets | 1.6% | 9.4% |
| Interest Coverage | 0 | -14.8 |
| Asset Turnover | 0.42 | 0.44 |
| Fixed Asset Turnover | 17.1 | 9.6 |
| Payout Ratio | 0% | 0% |
| Dividend Yield | 0% | 0% |
Interpretation of the Ratios
Figma, Inc.
Figma shows several unfavorable ratios, including a deeply negative net margin (-97.74%), return on equity (-55.29%), and return on invested capital (-59.68%). While the weighted average cost of capital (WACC) and debt ratios are favorable, concerns arise from a high price-to-book ratio (39.1) and weak interest coverage. The company does not pay dividends, likely due to ongoing reinvestment and growth priorities, as indicated by negative profitability metrics.
ServiceTitan, Inc.
ServiceTitan’s ratios also reveal challenges, with negative net margin (-30.98%), return on equity (-16.44%), and return on invested capital (-14.11%). Favorable aspects include WACC, debt levels, and fixed asset turnover, though interest coverage is negative, signaling financial stress. Like Figma, ServiceTitan does not distribute dividends, suggesting a focus on reinvestment and expansion over shareholder payouts at this stage.
Which one has the best ratios?
Comparing both, Figma and ServiceTitan share a similar proportion of favorable ratios (around 43%), but Figma faces more severe profitability issues and valuation concerns. ServiceTitan exhibits slightly fewer unfavorable metrics and maintains better valuation multiples. Overall, both companies have predominantly unfavorable financial ratios, with ServiceTitan showing marginally less risk in its profile.
Strategic Positioning
This section compares the strategic positioning of Figma, Inc. and ServiceTitan, Inc., including their market position, key segments, and exposure to technological disruption:
Figma, Inc.
- Market position and competitive pressure: Browser-based UI design tool with significant market cap and high trading volume.
- Key segments and business drivers: Collaborative design and prototyping tools for development teams.
- Exposure to technological disruption: Focus on AI-enhanced design tools and integrated collaboration features.
ServiceTitan, Inc.
- Market position and competitive pressure: Field service software with smaller market cap and moderate trading volume.
- Key segments and business drivers: Platform and subscription revenues from field service management.
- Exposure to technological disruption: Software supporting field service operations in residential and commercial sectors.
Figma, Inc. vs ServiceTitan, Inc. Positioning
Figma’s strategic approach centers on diversified, AI-enabled design tools for creative teams, fostering collaboration and prototyping. ServiceTitan focuses on a more concentrated market in field service software, driven by platform and subscription revenue streams, with stable operational support.
Which has the best competitive advantage?
Both companies currently show unfavorable MOAT evaluations, indicating value destruction. Figma’s steeply declining ROIC contrasts with ServiceTitan’s stable but negative returns, suggesting neither holds a strong competitive advantage based on recent capital efficiency.
Stock Comparison
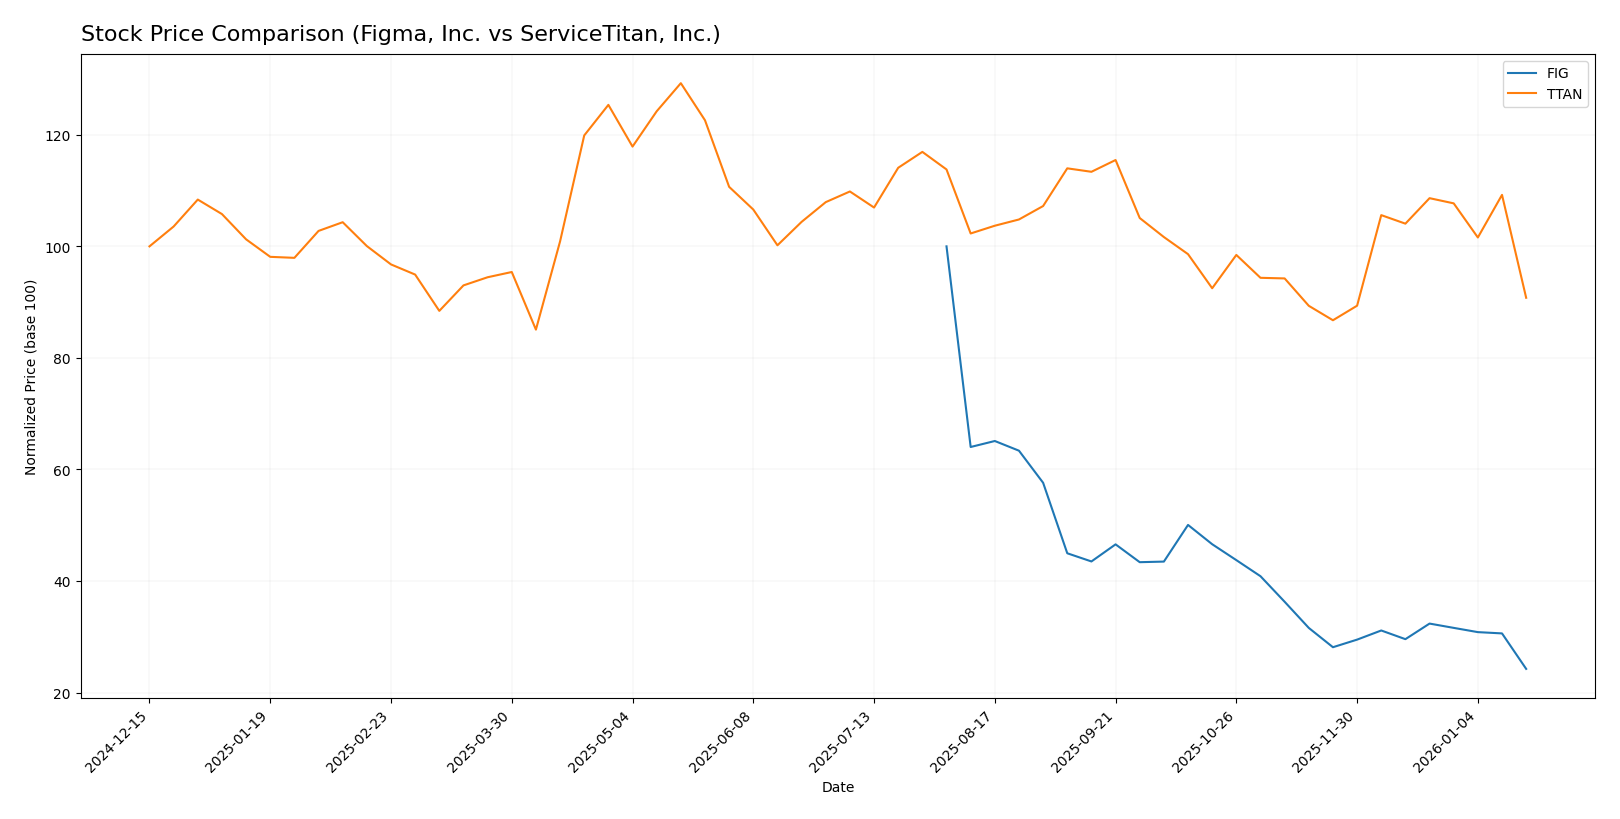
The stock price movements of Figma, Inc. and ServiceTitan, Inc. over the past 12 months reveal distinct bearish trends marked by significant declines and varying acceleration patterns in trading dynamics.
Trend Analysis
Figma, Inc. (FIG) experienced a sharp bearish trend with a 75.76% price decline over the last year, showing accelerating downward momentum and high volatility, ranging from a high of 122.0 to a low of 29.57.
ServiceTitan, Inc. (TTAN) also faced a bearish trend with a 9.22% drop in stock price over the same period, exhibiting accelerating decline but with lower volatility and a range between 129.26 and 85.07.
Comparing both, FIG’s stock delivered the weakest market performance with a much larger percentage loss than TTAN, which showed a less severe decline despite bearish conditions.
Target Prices
The current analyst consensus shows promising upside potential for both Figma, Inc. and ServiceTitan, Inc.
| Company | Target High | Target Low | Consensus |
|---|---|---|---|
| Figma, Inc. | 52 | 38 | 43.6 |
| ServiceTitan, Inc. | 145 | 117 | 132.44 |
Analysts expect Figma’s stock to rise significantly from its current price of $29.57, with consensus target well above. ServiceTitan also shows strong potential upside from $90.78, indicating favorable market sentiment.
Analyst Opinions Comparison
This section compares analysts’ ratings and grades for Figma, Inc. and ServiceTitan, Inc.:
Rating Comparison
Figma, Inc. Rating
- Rating: C+ with a very favorable status.
- Discounted Cash Flow Score: 4, rated favorable, indicating good future cash flow projections.
- Return on Equity Score: 1, very unfavorable, showing low efficiency in generating profit from equity.
- Return on Assets Score: 1, very unfavorable, indicating ineffective use of assets to generate earnings.
- Debt To Equity Score: 4, favorable, reflecting a strong balance sheet with low financial risk.
- Overall Score: 2, moderate, representing a middling financial standing.
ServiceTitan, Inc. Rating
- Rating: C- with a very favorable status.
- Discounted Cash Flow Score: 1, rated very unfavorable, indicating poor cash flow projection.
- Return on Equity Score: 1, very unfavorable, similarly low efficiency in profit generation.
- Return on Assets Score: 1, very unfavorable, also showing poor asset utilization.
- Debt To Equity Score: 3, moderate, indicating a higher financial risk compared to Figma.
- Overall Score: 1, very unfavorable, suggesting weaker overall financial health.
Which one is the best rated?
Based strictly on the provided data, Figma has a higher overall rating (C+ vs C-) and better scores in discounted cash flow and debt-to-equity, making it the better-rated company compared to ServiceTitan.
Scores Comparison
Here is a comparison of the Altman Z-Score and Piotroski Score for both companies:
FIG Scores
- Altman Z-Score: 14.34, indicating a safe zone with low bankruptcy risk.
- Piotroski Score: 4, showing average financial strength.
TTAN Scores
- Altman Z-Score: 15.74, indicating a safe zone with low bankruptcy risk.
- Piotroski Score: 6, showing average financial strength.
Which company has the best scores?
Both FIG and TTAN have Altman Z-Scores well within the safe zone, indicating low bankruptcy risk. TTAN has a higher Piotroski Score of 6 compared to FIG’s 4, suggesting relatively stronger financial health.
Grades Comparison
Here is a detailed comparison of the recent stock grades assigned to Figma, Inc. and ServiceTitan, Inc.:
Figma, Inc. Grades
The following table summarizes Figma’s latest grades from major financial institutions:
| Grading Company | Action | New Grade | Date |
|---|---|---|---|
| Morgan Stanley | Maintain | Equal Weight | 2026-01-15 |
| Wells Fargo | Upgrade | Overweight | 2026-01-08 |
| RBC Capital | Maintain | Sector Perform | 2026-01-05 |
| Goldman Sachs | Maintain | Neutral | 2025-11-07 |
| JP Morgan | Maintain | Neutral | 2025-11-06 |
| Piper Sandler | Maintain | Overweight | 2025-11-06 |
| Wells Fargo | Maintain | Equal Weight | 2025-11-05 |
| Wells Fargo | Maintain | Equal Weight | 2025-09-04 |
| Morgan Stanley | Maintain | Equal Weight | 2025-09-04 |
| RBC Capital | Maintain | Sector Perform | 2025-09-04 |
Overall, Figma’s grades show a stable consensus around “Equal Weight” to “Overweight,” indicating moderate confidence with no strong directional upgrades recently.
ServiceTitan, Inc. Grades
The following table shows ServiceTitan’s recent stock grades from recognized grading firms:
| Grading Company | Action | New Grade | Date |
|---|---|---|---|
| Piper Sandler | Maintain | Overweight | 2025-12-05 |
| BMO Capital | Maintain | Outperform | 2025-12-05 |
| TD Cowen | Maintain | Buy | 2025-12-05 |
| Morgan Stanley | Maintain | Equal Weight | 2025-12-05 |
| BMO Capital | Maintain | Outperform | 2025-11-20 |
| Wells Fargo | Maintain | Overweight | 2025-09-19 |
| Stifel | Maintain | Buy | 2025-09-19 |
| Piper Sandler | Maintain | Overweight | 2025-09-19 |
| Canaccord Genuity | Maintain | Buy | 2025-09-19 |
| Citigroup | Maintain | Neutral | 2025-09-09 |
ServiceTitan’s ratings consistently show a strong bias toward “Buy,” “Overweight,” and “Outperform,” reflecting a more positive market sentiment compared to Figma.
Which company has the best grades?
ServiceTitan holds superior grades overall, with multiple “Buy” and “Outperform” recommendations versus Figma’s mostly neutral and moderate “Hold” grades. This suggests investors perceive ServiceTitan’s outlook as more favorable, potentially implying stronger growth prospects or market positioning.
Strengths and Weaknesses
Below is a comparative overview of the main strengths and weaknesses of Figma, Inc. (FIG) and ServiceTitan, Inc. (TTAN) based on the most recent data available.
| Criterion | Figma, Inc. (FIG) | ServiceTitan, Inc. (TTAN) |
|---|---|---|
| Diversification | Limited product diversification; mainly design collaboration tools | Moderate diversification with platform and subscription revenues (739M and 566M USD respectively in 2025) |
| Profitability | Negative profitability; net margin -97.74%, ROIC -59.68%, value destroying | Negative profitability but less severe; net margin -30.98%, ROIC -14.11%, slightly unfavorable value destruction |
| Innovation | High innovation potential but currently struggling to convert to profits | Steady innovation with platform growth but profitability challenges remain |
| Global presence | Growing global user base but not yet fully matured | Established presence in North America with room for global expansion |
| Market Share | Strong position in collaborative design software | Significant share in service management software market |
Key takeaways: Both companies face profitability challenges with negative margins and ROIC below WACC, indicating value destruction. ServiceTitan shows more stable revenue streams and slightly better financial health, while Figma has stronger innovation appeal but struggles to monetize effectively. Caution is advised with both, emphasizing risk management.
Risk Analysis
Below is a comparison of key risks for Figma, Inc. (FIG) and ServiceTitan, Inc. (TTAN) based on the most recent data available in 2026:
| Metric | Figma, Inc. (FIG) | ServiceTitan, Inc. (TTAN) |
|---|---|---|
| Market Risk | High volatility, beta -3.8 indicates unusual market sensitivity | Moderate volatility, beta -0.85, less sensitive to market swings |
| Debt level | Very low debt (D/E 0.02), low debt-to-assets 1.6% | Low debt level (D/E 0.11), debt-to-assets 9.35% |
| Regulatory Risk | Moderate, tech sector subject to data/privacy laws | Moderate, service infrastructure regulations apply |
| Operational Risk | High, due to negative net margin (-97.7%) and poor ROE (-55%) | Moderate, negative net margin (-31%) but better than FIG |
| Environmental Risk | Low, primarily software-based with minimal environmental footprint | Low, software-driven, minimal direct environmental impact |
| Geopolitical Risk | Moderate, US-based with global customers, possible trade tensions | Moderate, US-based service software provider, exposed to regional policies |
The most significant risks are operational and market-related for both companies. Figma shows more severe operational challenges with a deeply negative profitability profile and high market volatility, posing a substantial risk for investors. ServiceTitan, while also unprofitable, displays relatively better financial stability and lower market sensitivity. Both firms face typical regulatory and geopolitical uncertainties inherent in their tech-driven sectors.
Which Stock to Choose?
Figma, Inc. (FIG) shows strong revenue growth of 48% in 2024 but suffers from steep declines in profitability metrics, with net margin at -97.74% and return on equity at -55.29%. Financial ratios reveal a modest debt level and a mixed liquidity position, while the company’s overall rating is moderate with a very favorable letter grade of C+.
ServiceTitan, Inc. (TTAN) experienced a 25.64% revenue increase in 2025 and a more favorable income statement overall. Despite negative profitability ratios like a net margin of -30.98% and a return on equity of -16.44%, TTAN maintains a favorable debt profile and a slightly unfavorable global ratio evaluation, paired with a very favorable rating of C-.
Investors focused on growth might see Figma’s rapid revenue expansion as attractive, though its declining profitability and unfavorable financial ratios suggest caution. Conversely, investors prioritizing stability could find ServiceTitan’s more moderate profitability declines and stable financial metrics more reassuring, despite its persistent value destruction.
Disclaimer: Investment carries a risk of loss of initial capital. The past performance is not a reliable indicator of future results. Be sure to understand risks before making an investment decision.
Go Further
I encourage you to read the complete analyses of Figma, Inc. and ServiceTitan, Inc. to enhance your investment decisions: