Home > Comparison > Technology > NOW vs FIG
The strategic rivalry between ServiceNow, Inc. and Figma, Inc. shapes the evolution of the software application sector. ServiceNow operates as a capital-intensive enterprise cloud computing powerhouse, delivering comprehensive IT workflow automation. In contrast, Figma is a nimble, high-growth collaborative design platform innovating user interface development. This analysis pits steady operational scale against disruptive innovation to identify which trajectory offers superior risk-adjusted returns for a diversified portfolio.
Table of contents
Companies Overview
ServiceNow and Figma are pivotal players reshaping enterprise and creative software landscapes.
ServiceNow, Inc.: Enterprise Workflow Automation Leader
ServiceNow dominates the enterprise cloud computing market with its Now platform, automating workflows using AI, machine learning, and robotic process automation. It generates revenue through its extensive IT service management suites and industry-specific solutions. In 2026, its strategic focus sharpens on expanding automation capabilities and strengthening partnerships like Celonis to drive process efficiency.
Figma, Inc.: Collaborative Design Innovator
Figma leads in browser-based design tools that unify UI design and development teams. Its core revenue comes from subscription fees for collaborative products like Figma Design and Dev Mode. In 2026, Figma prioritizes enhancing AI-powered prototyping and expanding its product ecosystem, including FigJam and Figma Slides, to streamline creative workflows.
Strategic Collision: Similarities & Divergences
ServiceNow emphasizes a closed ecosystem targeting enterprise automation, while Figma champions an open, collaborative platform for creative teams. Both compete indirectly by digitizing workflows but serve distinct markets—enterprise operations versus design collaboration. Their investment profiles diverge sharply: ServiceNow offers scale and stability, whereas Figma presents high-growth potential but with greater volatility.
Income Statement Comparison
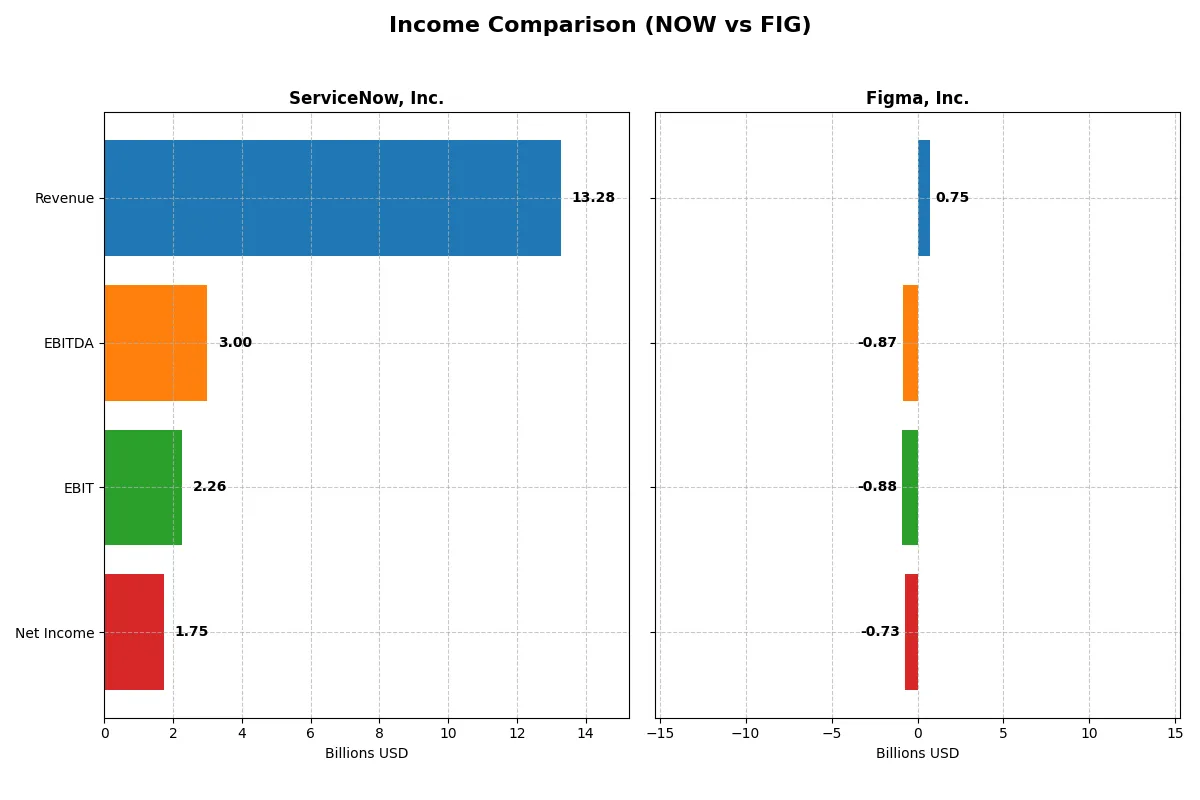
This data dissects the core profitability and scalability of both corporate engines to reveal who dominates the bottom line:
| Metric | ServiceNow, Inc. (NOW) | Figma, Inc. (FIG) |
|---|---|---|
| Revenue | 13.3B | 749M |
| Cost of Revenue | 3.0B | 88M |
| Operating Expenses | 8.5B | 1.54B |
| Gross Profit | 10.3B | 661M |
| EBITDA | 3.0B | -870M |
| EBIT | 2.3B | -877M |
| Interest Expense | 0 | 0 |
| Net Income | 1.75B | -732M |
| EPS | 1.69 | -3.11 |
| Fiscal Year | 2025 | 2024 |
Income Statement Analysis: The Bottom-Line Duel
This income statement comparison reveals which company runs a more efficient and profitable business engine through recent financial performance.
ServiceNow, Inc. Analysis
ServiceNow shows robust revenue growth from $5.9B in 2021 to $13.3B in 2025, with net income expanding sixfold to $1.75B. Its gross margin stays strong above 77%, and net margin improves steadily to 13.2%. In 2025, ServiceNow’s solid EBIT margin of 17% signals excellent operational efficiency and sustained momentum.
Figma, Inc. Analysis
Figma’s revenue rose sharply 48% from $505M in 2023 to $749M in 2024, with gross margin at an impressive 88%. However, it posted a net loss of $732M in 2024, reflecting a -97.7% net margin and heavy operating expenses. The negative EBIT margin of -117% indicates ongoing challenges in controlling costs despite strong top-line growth.
Margin Strength vs. Growth Struggles
ServiceNow clearly outperforms with consistent profit expansion and healthy margins, while Figma struggles to convert its rapid revenue gains into profitability. ServiceNow’s income statement reflects a well-managed, scalable business. Figma’s profile suits investors focused on growth but wary of persistent losses.
Financial Ratios Comparison
These vital ratios act as a diagnostic tool to expose the underlying fiscal health, valuation premiums, and capital efficiency of the companies compared below:
| Ratios | ServiceNow, Inc. (NOW) | Figma, Inc. (FIG) |
|---|---|---|
| ROE | 13.5% | -55.3% |
| ROIC | 9.0% | -59.7% |
| P/E | 90.9 | -70.7 |
| P/B | 12.3 | 39.1 |
| Current Ratio | 0.95 | 3.66 |
| Quick Ratio | 0.95 | 3.66 |
| D/E | 0.25 | 0.02 |
| Debt-to-Assets | 12.3% | 1.6% |
| Interest Coverage | 0 | 0 |
| Asset Turnover | 0.51 | 0.42 |
| Fixed Asset Turnover | 4.29 | 17.1 |
| Payout Ratio | 0 | 0 |
| Dividend Yield | 0 | 0 |
| Fiscal Year | 2025 | 2024 |
Efficiency & Valuation Duel: The Vital Signs
Financial ratios act as a company’s DNA, exposing hidden risks and revealing operational excellence critical for investment decisions.
ServiceNow, Inc.
ServiceNow posts a solid 13.5% ROE and a favorable 13.2% net margin, signaling steady profitability. However, its P/E ratio of nearly 91 marks the stock as expensive relative to earnings. It pays no dividends, instead reinvesting heavily in R&D, allocating over 22% of revenue to innovation to fuel growth.
Figma, Inc.
Figma displays negative profitability with a -55.3% ROE and a net margin of -97.7%, indicating operational challenges. Its P/E is negative, reflecting losses, while a high P/B of 39.1 flags an expensive valuation. Figma retains cash with no dividends, focusing on substantial R&D spend exceeding 100% of revenue to build future capabilities.
Premium Valuation vs. Operational Safety
ServiceNow balances neutral returns and high valuation, reflecting growth confidence but stretched multiples. Figma struggles with losses and steep valuation, increasing risk. Investors seeking operational stability may prefer ServiceNow, while those favoring high-risk growth align better with Figma’s profile.
Which one offers the Superior Shareholder Reward?
ServiceNow, Inc. (NOW) eschews dividends, focusing on robust buybacks funded by strong free cash flow, with a 2025 FCF/share of $4.41 and zero dividend payout. Figma, Inc. (FIG) neither pays dividends nor executes buybacks, instead investing heavily in growth despite persistent losses and negative free cash flow. Historically in tech, sustainable shareholder reward favors companies converting cash flow into buybacks or dividends. NOW’s intense buyback strategy and cash generation signal a superior, more durable total return profile compared to FIG’s growth-at-all-costs model. I conclude NOW offers the more attractive shareholder reward in 2026.
Comparative Score Analysis: The Strategic Profile
The radar chart reveals the fundamental DNA and trade-offs between ServiceNow, Inc. and Figma, Inc., highlighting their contrasting financial strengths and weaknesses:
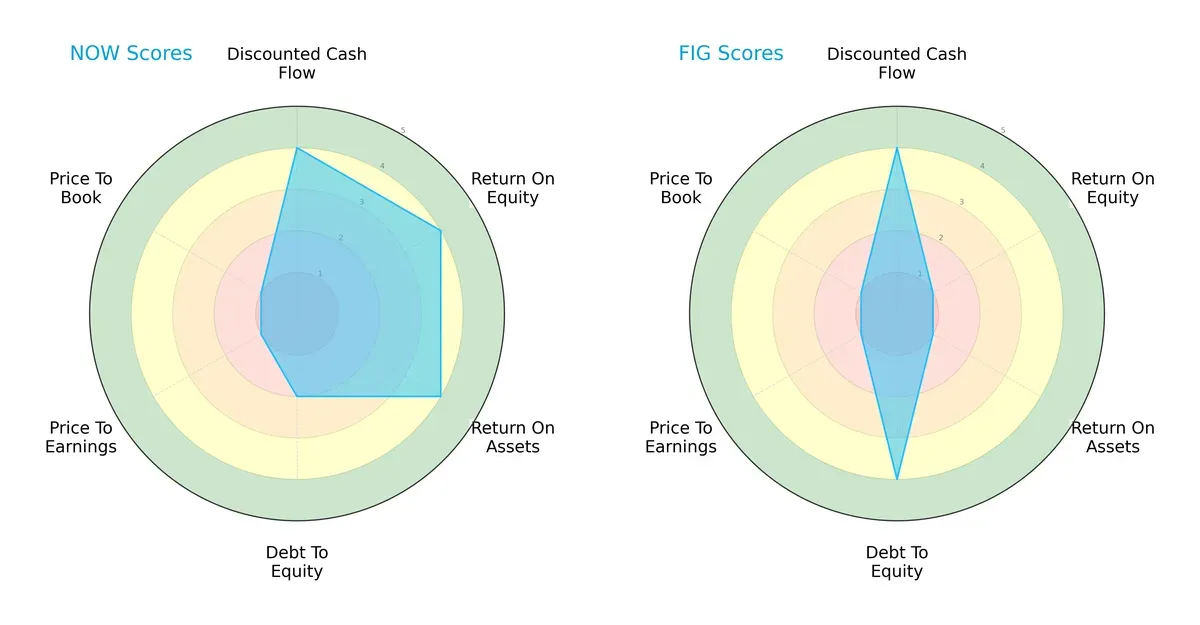
ServiceNow shows a balanced profile with strong DCF, ROE, and ROA scores, indicating efficient capital allocation and asset utilization. However, its moderate debt-to-equity score signals some leverage risk. Figma relies heavily on a low debt-to-equity ratio but struggles with weak profitability metrics (ROE and ROA). Both firms share unfavorable valuation scores, suggesting market skepticism.
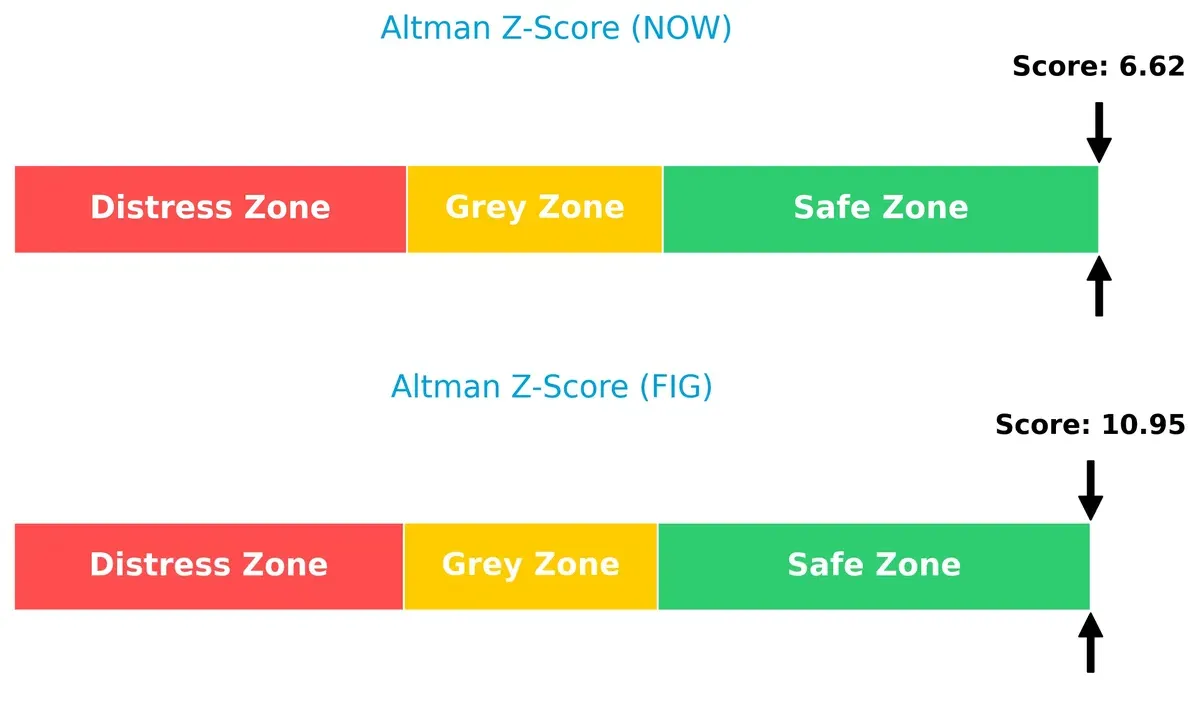
Bankruptcy Risk: Solvency Showdown
The Altman Z-Score gap favors Figma, which scores 10.95, compared to ServiceNow’s 6.62, both safely above the distress threshold, implying robust solvency and low bankruptcy risk in this cycle:
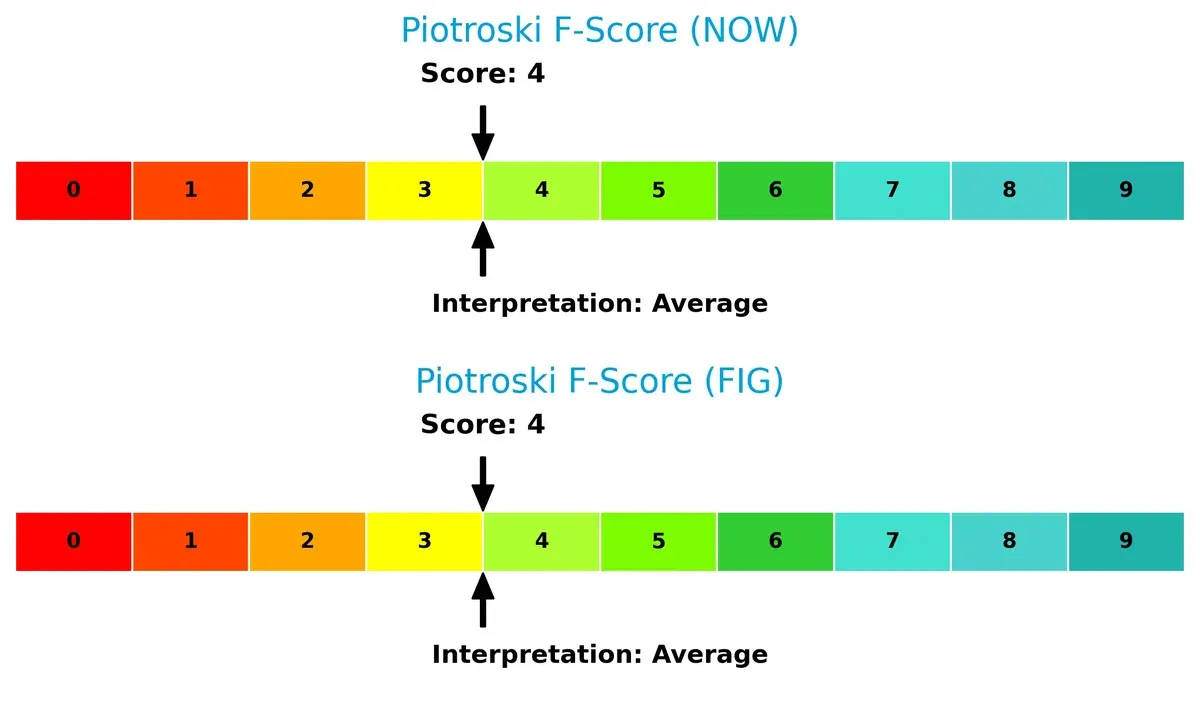
Financial Health: Quality of Operations
Both companies share an average Piotroski F-Score of 4, indicating moderate operational quality. Neither exhibits strong internal financial health, flagging caution for investors seeking peak stability:
How are the two companies positioned?
This section dissects the operational DNA of ServiceNow and Figma by comparing their revenue distribution across segments and analyzing their internal strengths and weaknesses. The final objective is to confront their economic moats to identify which business model offers the most resilient and sustainable competitive advantage in today’s market.
Revenue Segmentation: The Strategic Mix
This comparison dissects how ServiceNow, Inc. and Figma, Inc. diversify their income streams and where their primary sector bets lie:
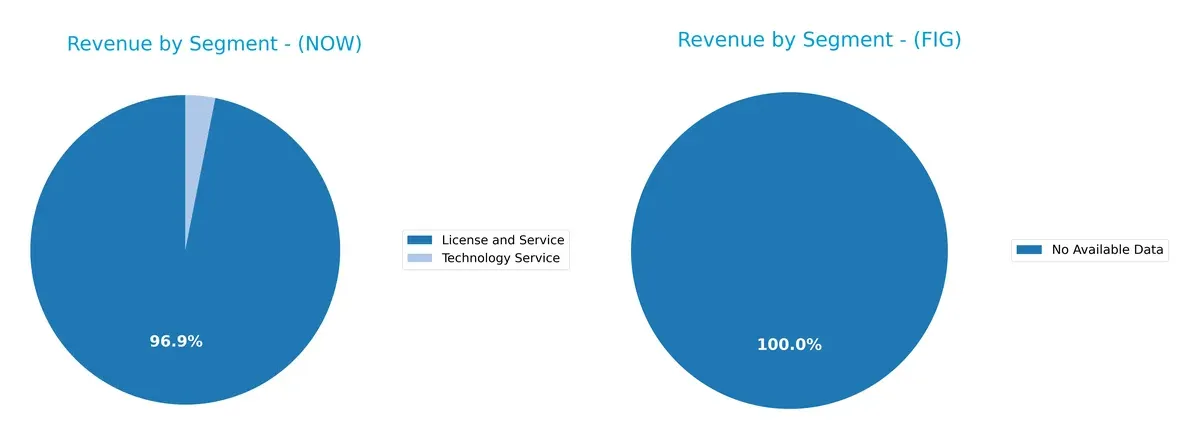
ServiceNow anchors revenue heavily in License and Service, reaching $12.9B in 2025, with Technology Service contributing a modest $414M. Figma lacks available data, preventing direct segmentation comparison. ServiceNow’s focus on Digital Workflow and ITOM products signals strong ecosystem lock-in, but also concentration risk. This contrasts with firms that diversify broadly, where single-segment reliance can amplify volatility in tech cycles.
Strengths and Weaknesses Comparison
This table compares the Strengths and Weaknesses of ServiceNow, Inc. and Figma, Inc.:
ServiceNow Strengths
- Diverse revenue from License, Service, Digital Workflow, and ITOM products
- Solid global presence across North America, EMEA, and Asia Pacific
- Favorable debt ratios and strong fixed asset turnover
- Positive net margin and neutral ROIC vs. WACC
Figma Strengths
- Very low debt-to-assets and debt-to-equity ratios
- Favorable weighted average cost of capital (WACC)
- High fixed asset turnover indicates asset efficiency
- Favorable quick ratio suggests liquidity strength
ServiceNow Weaknesses
- Elevated PE and PB ratios indicate expensive valuation
- Current ratio below 1 signals liquidity concerns
- Zero dividend yield limits income investors
- Neutral ROE and ROIC
- Moderate asset turnover
Figma Weaknesses
- Significant negative net margin and ROE reflect unprofitability
- Negative ROIC well below WACC
- Interest coverage at zero signals financial stress
- Unfavorable asset turnover and high PB ratio
- Current ratio surprisingly high but flagged unfavorable
ServiceNow shows balanced strengths in profitability and global diversification but faces valuation and liquidity red flags. Figma’s asset efficiency and low leverage contrast with its deep losses and profitability challenges. These profiles suggest different strategic priorities and risk exposures for each company.
The Moat Duel: Analyzing Competitive Defensibility
A structural moat is the only shield preserving long-term profits from competition’s relentless erosion. Let’s dissect the sources of durability for these two software leaders:
ServiceNow, Inc.: Workflow Automation with Expanding Profitability
ServiceNow’s moat stems from high switching costs embedded in its integrated IT service management platform. Its 77.5% gross margin and rising ROIC reveal increasing profitability. Expansion into AI-powered workflow automation in 2026 may deepen its competitive edge.
Figma, Inc.: Collaborative Design Innovator Facing Profitability Challenges
Figma leverages network effects from its collaborative UI design tools, contrasting ServiceNow’s enterprise focus. Despite 88.3% gross margin, Figma’s steep losses and declining ROIC signal value destruction. Growth in AI-assisted prototyping offers upside but risks intensifying competition.
Workflow Integration vs. Collaborative Network Effects
ServiceNow’s expanding profitability and growing ROIC indicate a wider, more durable moat than Figma’s fragile, loss-making position. I see ServiceNow better equipped to defend market share amid intensifying innovation pressure.
Which stock offers better returns?
Over the past year, both ServiceNow, Inc. and Figma, Inc. faced steep declines, with notable price drops and seller dominance shaping their trading dynamics.
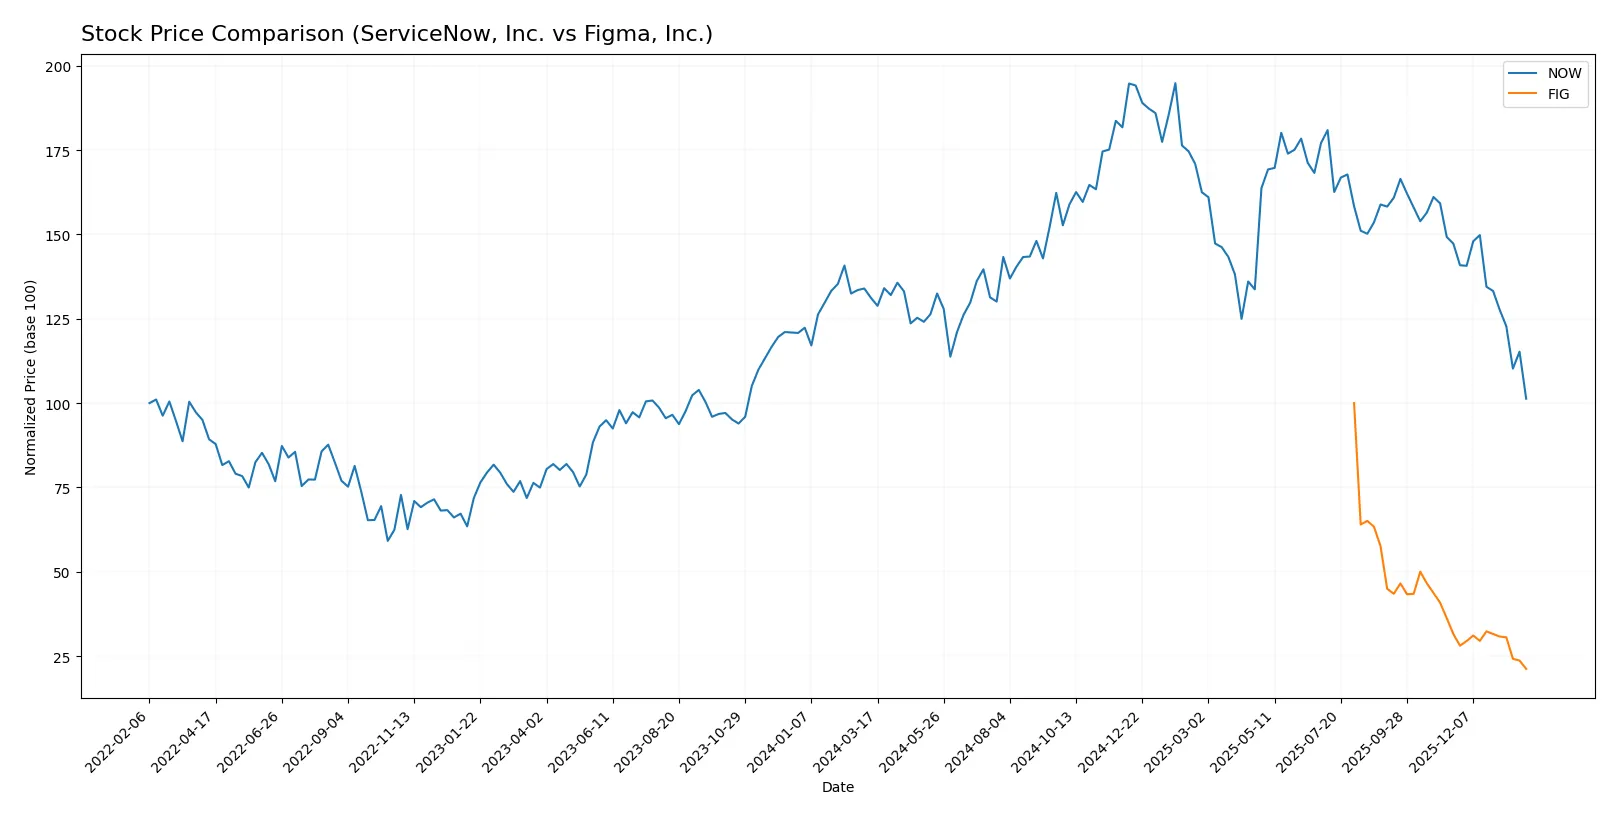
Trend Comparison
ServiceNow’s stock fell 22.79% over 12 months, marking a bearish trend with decelerating losses and high volatility, peaking at 225 and bottoming at 117.
Figma’s stock plunged 78.75% in the same period, showing a bearish trend with accelerating decline, lower volatility than ServiceNow, hitting a high of 122 and a low of 26.
Figma’s stock underperformed ServiceNow considerably, delivering the weakest market return and sharper loss acceleration over the last year.
Target Prices
Analysts present a wide range of target prices, reflecting diverse outlooks for these software application companies.
| Company | Target Low | Target High | Consensus |
|---|---|---|---|
| ServiceNow, Inc. | 115 | 1315 | 440.14 |
| Figma, Inc. | 38 | 52 | 43.6 |
ServiceNow’s consensus target of 440.14 far exceeds its current price of 117, indicating strong analyst optimism. Figma’s consensus target at 43.6 also suggests upside from the current 25.92 price, though with a narrower range.

Don’t Let Luck Decide Your Entry Point
Optimize your entry points with our advanced ProRealTime indicators. You’ll get efficient buy signals with precise price targets for maximum performance. Start outperforming now!
How do institutions grade them?
ServiceNow, Inc. Grades
The following table summarizes recent grades from well-known financial institutions for ServiceNow, Inc.:
| Grading Company | Action | New Grade | Date |
|---|---|---|---|
| Citigroup | Maintain | Buy | 2026-01-30 |
| BTIG | Maintain | Buy | 2026-01-29 |
| Stifel | Maintain | Buy | 2026-01-29 |
| RBC Capital | Maintain | Outperform | 2026-01-29 |
| Macquarie | Maintain | Neutral | 2026-01-29 |
| DA Davidson | Maintain | Buy | 2026-01-29 |
| Needham | Maintain | Buy | 2026-01-29 |
| Keybanc | Maintain | Underweight | 2026-01-29 |
| Evercore ISI Group | Maintain | Outperform | 2026-01-29 |
| Cantor Fitzgerald | Maintain | Overweight | 2026-01-29 |
Figma, Inc. Grades
Below are recent grades from established financial firms for Figma, Inc.:
| Grading Company | Action | New Grade | Date |
|---|---|---|---|
| Morgan Stanley | Maintain | Equal Weight | 2026-01-15 |
| Wells Fargo | Upgrade | Overweight | 2026-01-08 |
| RBC Capital | Maintain | Sector Perform | 2026-01-05 |
| Goldman Sachs | Maintain | Neutral | 2025-11-07 |
| JP Morgan | Maintain | Neutral | 2025-11-06 |
| Piper Sandler | Maintain | Overweight | 2025-11-06 |
| Wells Fargo | Maintain | Equal Weight | 2025-11-05 |
| Wells Fargo | Maintain | Equal Weight | 2025-09-04 |
| Morgan Stanley | Maintain | Equal Weight | 2025-09-04 |
| RBC Capital | Maintain | Sector Perform | 2025-09-04 |
Which company has the best grades?
ServiceNow, Inc. has received consistently stronger grades, including multiple “Buy” and “Outperform” ratings. Figma, Inc. maintains mostly “Equal Weight” and “Sector Perform” ratings, with fewer upgrades. Investors may view ServiceNow’s higher grades as a sign of greater institutional confidence.
Risks specific to each company
The following categories identify the critical pressure points and systemic threats facing both firms in the 2026 market environment:
1. Market & Competition
ServiceNow, Inc.
- Operates in a mature, highly competitive enterprise cloud software market with strong incumbents.
Figma, Inc.
- Faces intense competition in collaborative design tools with rapid innovation and newer startups.
2. Capital Structure & Debt
ServiceNow, Inc.
- Maintains a conservative debt-to-equity ratio of 0.25, ensuring financial stability.
Figma, Inc.
- Very low leverage with a debt-to-equity ratio of 0.02, minimizing financial risk.
3. Stock Volatility
ServiceNow, Inc.
- Beta near 1 (0.98) signals market-correlated volatility, typical for established tech firms.
Figma, Inc.
- Extremely high negative beta (-3.58) indicates erratic price swings and high investor uncertainty.
4. Regulatory & Legal
ServiceNow, Inc.
- Subject to data privacy and security regulations impacting cloud service providers globally.
Figma, Inc.
- Faces regulatory scrutiny related to AI tools and user data privacy in collaborative design software.
5. Supply Chain & Operations
ServiceNow, Inc.
- Relies on global cloud infrastructure partnerships; operational risk tied to service uptime.
Figma, Inc.
- Operates primarily browser-based; less supply chain risk but dependent on internet infrastructure.
6. ESG & Climate Transition
ServiceNow, Inc.
- Growing focus on sustainable IT operations; ESG compliance critical to enterprise clients.
Figma, Inc.
- Early-stage ESG programs; sustainability metrics less mature but important for brand reputation.
7. Geopolitical Exposure
ServiceNow, Inc.
- Global footprint exposes it to trade tensions and tech export restrictions.
Figma, Inc.
- Mainly US-based with limited global exposure but vulnerable to US regulatory shifts.
Which company shows a better risk-adjusted profile?
ServiceNow’s strongest risk lies in competitive pressures within a mature market, but its solid capital structure and moderate volatility inspire confidence. Figma’s biggest risk is extreme stock volatility and weak profitability despite low debt, reflecting early-stage operational challenges. ServiceNow displays a better risk-adjusted profile, bolstered by stable financials and a safe Altman Z-score of 6.6 versus Figma’s 10.9, which masks underlying profitability struggles. The stark contrast between ServiceNow’s consistent margin and Figma’s -97.7% net margin underlines my concern for Figma’s earnings sustainability.
Final Verdict: Which stock to choose?
ServiceNow, Inc. commands attention with its superpower: steadily improving profitability amid a challenging macro environment. Its growing ROIC hints at increasing value creation, though a subpar current ratio signals a liquidity watchpoint. It suits investors aiming for aggressive growth with tolerance for balance sheet nuances.
Figma, Inc. offers a strategic moat rooted in innovative product momentum and a strong liquidity cushion. However, its persistent value destruction and negative profitability paint a riskier picture compared to ServiceNow. It fits investors pursuing growth at a reasonable price, who can endure operational volatility and valuation uncertainty.
If you prioritize sustainable value creation and proven income growth, ServiceNow outshines with clearer profitability trends despite its liquidity caveat. However, if you seek high-growth potential cushioned by strong liquidity, Figma offers better stability but commands a premium for elevated risk. Both profiles require disciplined risk assessment given recent bearish price trends.
Disclaimer: Investment carries a risk of loss of initial capital. The past performance is not a reliable indicator of future results. Be sure to understand risks before making an investment decision.
Go Further
I encourage you to read the complete analyses of ServiceNow, Inc. and Figma, Inc. to enhance your investment decisions: