Home > Comparison > Technology > FICO vs TTD
The strategic rivalry between Fair Isaac Corporation and The Trade Desk, Inc. shapes the future of the technology sector’s software application landscape. Fair Isaac operates a data-driven analytics and decision management model, while The Trade Desk excels as a cloud-based digital advertising platform. This head-to-head pits established analytic depth against agile ad-tech innovation. This analysis seeks to identify which trajectory delivers superior risk-adjusted returns for a diversified portfolio in 2026.
Table of contents
Companies Overview
Fair Isaac Corporation and The Trade Desk stand as key players transforming software application markets globally.
Fair Isaac Corporation: Analytics Pioneer in Decision Management
Fair Isaac Corporation dominates as a provider of analytic software and data management solutions. Its core revenue flows from two segments—Scores and Software—that empower businesses to automate decisions in marketing, fraud detection, and customer engagement. In 2026, it focuses strategically on expanding its modular FICO Platform to address advanced analytic use cases across multiple industries.
The Trade Desk, Inc.: Digital Advertising Innovator
The Trade Desk leads as a cloud-based platform for data-driven digital advertising. It generates revenue by enabling clients to create and optimize campaigns across display, video, and connected TV formats. In 2026, the company emphasizes broadening its cross-channel advertising reach and enhancing value-added data services to support agencies and advertisers worldwide.
Strategic Collision: Similarities & Divergences
Both firms operate in application software but diverge sharply—Fair Isaac champions decision automation analytics, while The Trade Desk excels in programmatic advertising technology. Their primary competition unfolds in data utilization but in different verticals: financial services versus digital marketing. Investment profiles differ; Fair Isaac offers stability through mature analytics, while The Trade Desk targets growth in the dynamic ad tech sector.
Income Statement Comparison
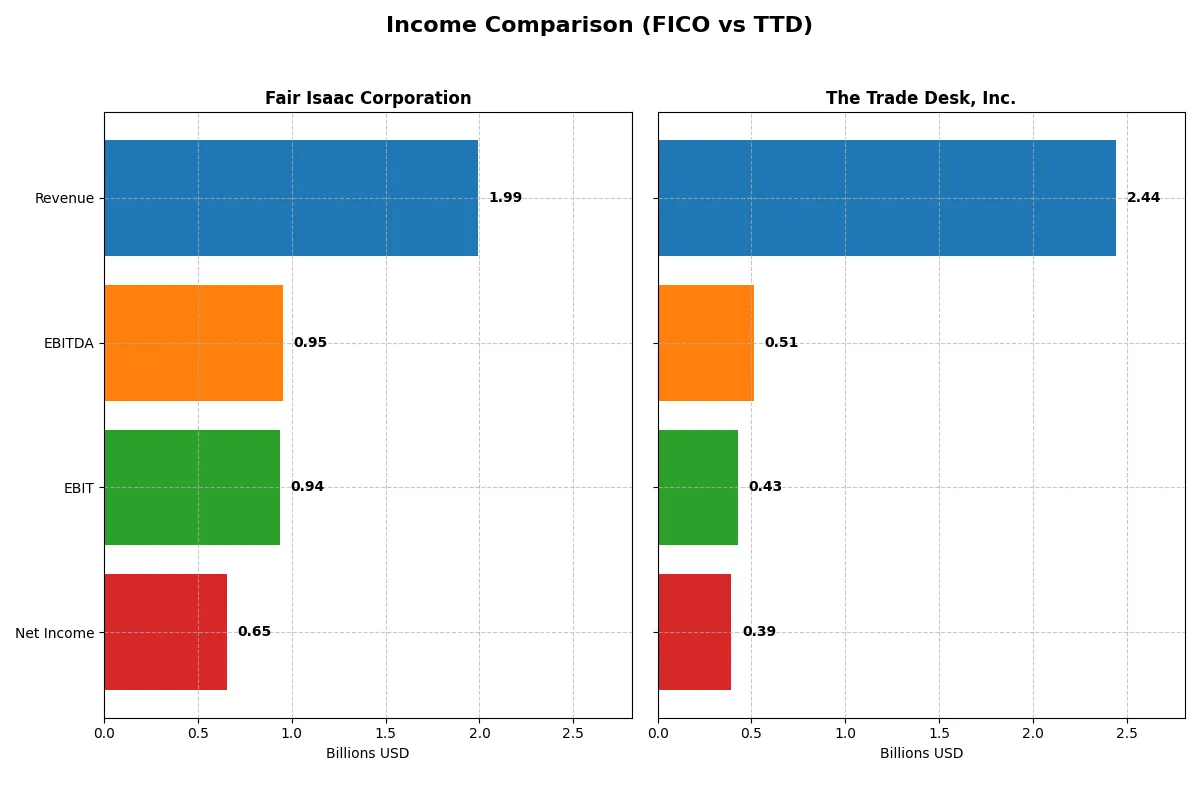
The following data dissects the core profitability and scalability of both corporate engines to reveal who dominates the bottom line:
| Metric | Fair Isaac Corporation (FICO) | The Trade Desk, Inc. (TTD) |
|---|---|---|
| Revenue | 1.99B | 2.44B |
| Cost of Revenue | 354M | 472M |
| Operating Expenses | 712M | 1.55B |
| Gross Profit | 1.64B | 1.97B |
| EBITDA | 951M | 515M |
| EBIT | 936M | 427M |
| Interest Expense | 134M | 0 |
| Net Income | 652M | 393M |
| EPS | 26.9 | 0.8 |
| Fiscal Year | 2025 | 2024 |
Income Statement Analysis: The Bottom-Line Duel
This income statement comparison reveals which company operates with superior revenue generation and profit efficiency over recent years.
Fair Isaac Corporation Analysis
Fair Isaac Corporation (FICO) shows steady revenue growth, reaching $1.99B in 2025, with net income climbing to $652M. Gross margin remains strong at 82.2%, while net margin holds a healthy 32.8%. Efficiency gains manifest in a 25% EBIT growth last year, reflecting disciplined cost control and robust profitability momentum.
The Trade Desk, Inc. Analysis
The Trade Desk (TTD) exhibits rapid revenue expansion, hitting $2.44B in 2024, with net income rising to $393M. Its gross margin stands at a commendable 80.7%, but net margin lags at 16.1%, indicating higher operating costs. Despite this, TTD’s EBIT more than doubled last year, signaling accelerating operational leverage and growth potential.
Margin Strength vs. Growth Velocity
FICO delivers superior profitability with margins twice TTD’s level, underpinned by consistent earnings and margin expansion. TTD outpaces in top-line growth and EBIT acceleration but sacrifices margin quality. Investors prioritizing stable, high-margin cash flow may favor FICO, while those drawn to aggressive growth might consider TTD’s scale and momentum.
Financial Ratios Comparison
These vital ratios act as a diagnostic tool to expose the underlying fiscal health, valuation premiums, and capital efficiency of the companies compared:
| Ratios | Fair Isaac Corporation (FICO) | The Trade Desk, Inc. (TTD) |
|---|---|---|
| ROE | -37.3% | 13.3% |
| ROIC | 52.9% | 10.0% |
| P/E | 55.6 | 146.8 |
| P/B | -20.8 | 19.6 |
| Current Ratio | 0.83 | 1.86 |
| Quick Ratio | 0.83 | 1.86 |
| D/E | -1.76 | 0.11 |
| Debt-to-Assets | 165.0% | 5.1% |
| Interest Coverage | 6.92 | 0 |
| Asset Turnover | 1.07 | 0.40 |
| Fixed Asset Turnover | 21.2 | 5.17 |
| Payout ratio | 0 | 0 |
| Dividend yield | 0 | 0 |
| Fiscal Year | 2025 | 2024 |
Efficiency & Valuation Duel: The Vital Signs
Financial ratios serve as a company’s DNA, unveiling hidden risks and operational strengths beyond surface-level numbers.
Fair Isaac Corporation
FICO displays strong operational efficiency with a robust ROIC of 53%, well above its 9.4% WACC, signaling value creation. Despite a negative ROE and stretched P/E at 55.6, its 32.8% net margin underpins profitability. The firm lacks dividends, instead channeling cash into R&D, supporting future growth amid liquidity concerns with a 0.83 current ratio.
The Trade Desk, Inc.
TTD shows moderate profitability, with a 13.3% ROE and a lower 10% ROIC, yet its valuation is highly stretched with a P/E of 146.8. The 16.1% net margin reflects operational discipline, and a strong balance sheet features a 1.86 current ratio. It reinvests heavily in R&D rather than paying dividends, fueling aggressive growth strategies.
Premium Valuation vs. Operational Safety
TTD offers a more favorable liquidity and moderate profitability profile but carries a steep valuation premium. FICO’s exceptional capital returns contrast with weaker equity returns and liquidity, creating risk. Investors focused on operational efficiency may prefer FICO, while those prioritizing balance sheet strength and growth reinvestment might lean toward TTD.
Which one offers the Superior Shareholder Reward?
Fair Isaac Corporation (FICO) and The Trade Desk, Inc. (TTD) both forego dividends, focusing on reinvestment and share buybacks. FICO sustains a robust free cash flow of $31.8/share with no dividend payout, fueling buybacks and growth. TTD reports lower free cash flow at $1.29/share but commits heavily to R&D and acquisitions. FICO’s higher operating margins (~47%) and near-complete free cash flow conversion support a more sustainable buyback-driven return. TTD’s growth focus demands capital, limiting immediate shareholder returns. I conclude FICO offers the superior total return profile for 2026 investors seeking steady capital appreciation and disciplined capital allocation.
Comparative Score Analysis: The Strategic Profile
The radar chart reveals the fundamental DNA and trade-offs of Fair Isaac Corporation and The Trade Desk, Inc., highlighting their core financial strengths and weaknesses:
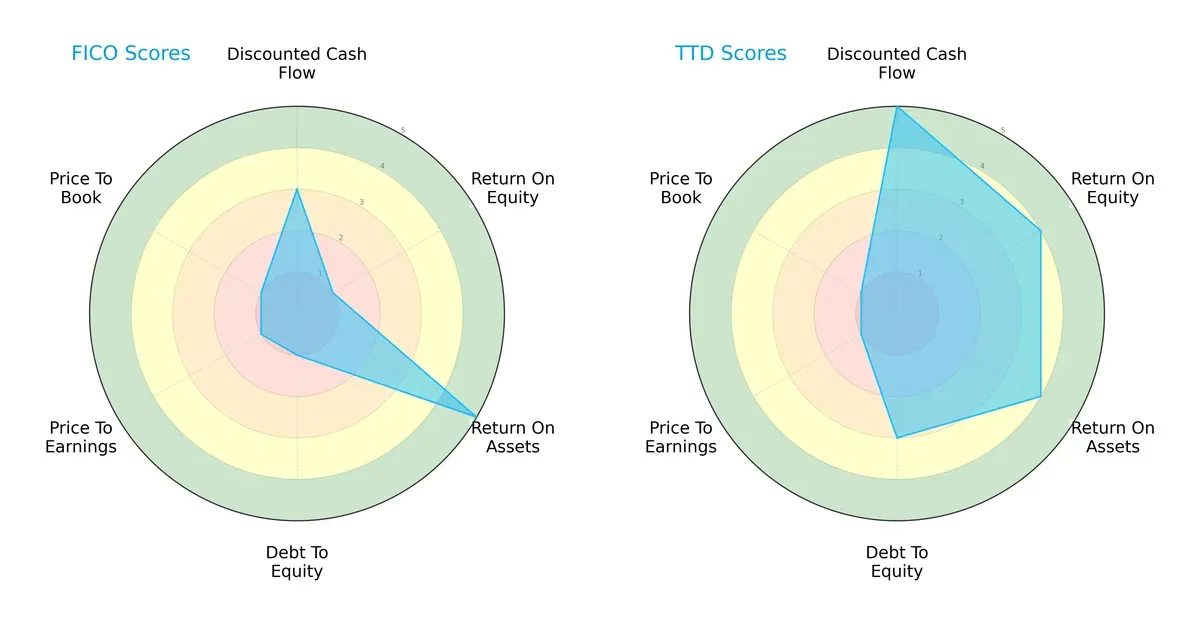
The Trade Desk stands out with a superior overall score (3 vs. 2) and excels in discounted cash flow (5 vs. 3) and return on equity (4 vs. 1). Fair Isaac shows a strong return on assets (5 vs. 4) but struggles with debt management and valuation metrics, scoring very unfavorably on debt-to-equity, P/E, and P/B ratios. The Trade Desk offers a more balanced financial profile, while Fair Isaac leans heavily on asset efficiency.
Bankruptcy Risk: Solvency Showdown
The Altman Z-Scores place Fair Isaac at 12.2 and The Trade Desk at 3.8, both safely above the distress threshold, signaling strong long-term solvency but with distinct risk margins:
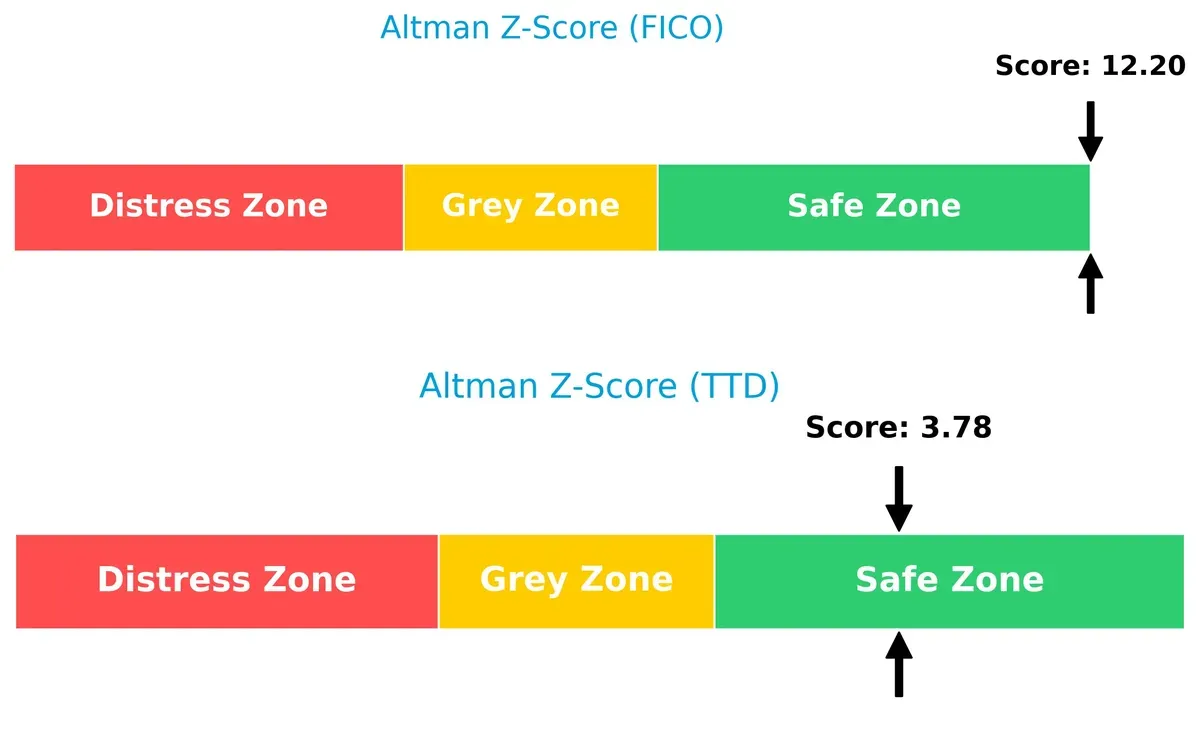
Fair Isaac’s exceptionally high Z-score implies a robust buffer against financial distress, reflecting conservative leverage and stable earnings. The Trade Desk, while also in the safe zone, shows more moderate safety margins, suggesting investors should monitor its evolving credit profile.
Financial Health: Quality of Operations
Fair Isaac’s Piotroski F-Score of 7 indicates strong financial health, outperforming The Trade Desk’s average score of 5, signaling notable operational and profitability advantages:
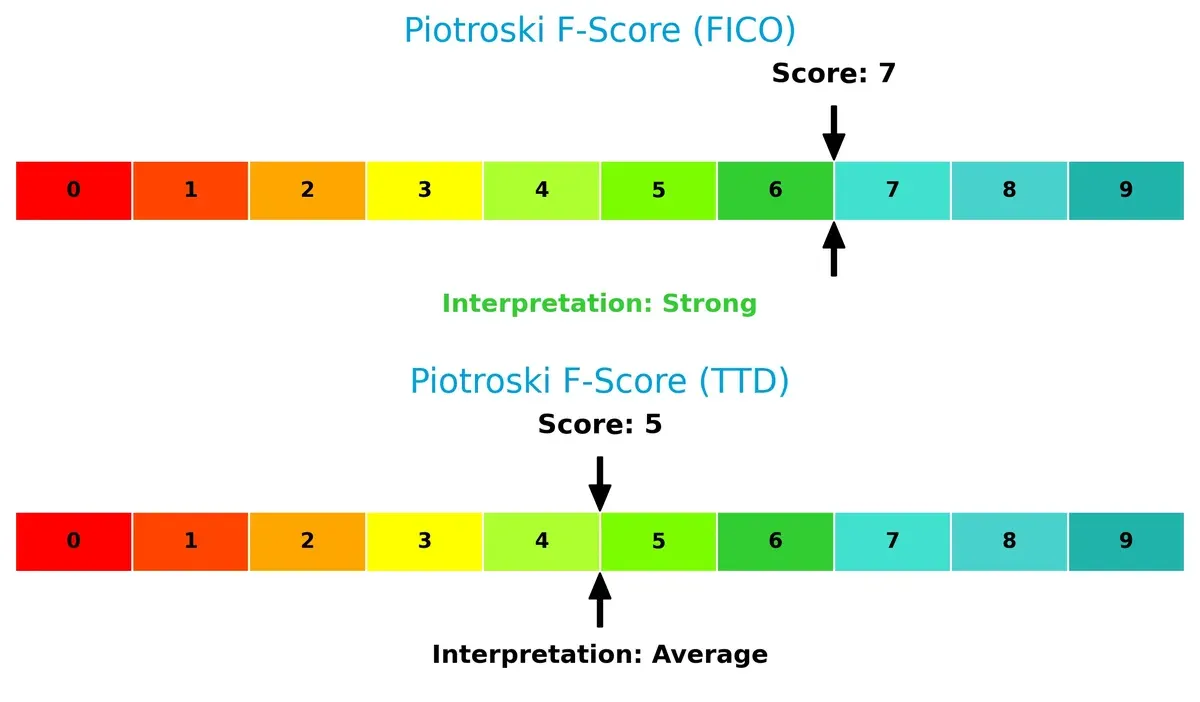
I see Fair Isaac demonstrating superior internal financial strength, with fewer red flags in profitability, leverage, and efficiency metrics. The Trade Desk’s average score suggests operational improvements are needed to match Fair Isaac’s quality of earnings and balance sheet discipline.
How are the two companies positioned?
This section dissects the operational DNA of FICO and TTD by comparing their revenue distribution and internal dynamics. The goal is to confront their economic moats to reveal which model delivers the most resilient competitive advantage today.
Revenue Segmentation: The Strategic Mix
The following visual comparison dissects how both firms diversify their income streams and where their primary sector bets lie:
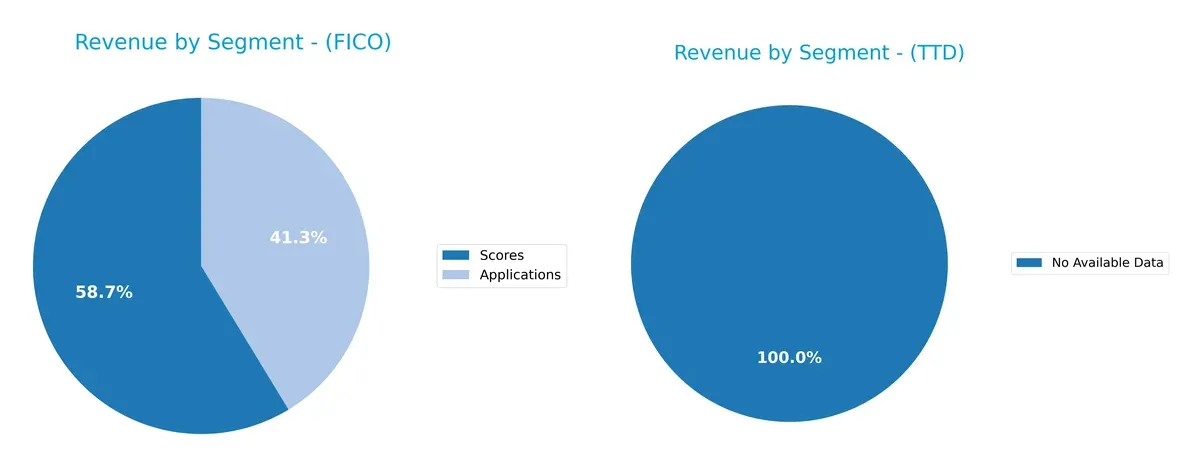
Fair Isaac Corporation (FICO) shows a balanced revenue split between Scores at $1.17B and Applications at $822M in 2025, reflecting a dual focus on credit scoring and decision management software. The Trade Desk, Inc. lacks available segment data for comparison, preventing a full strategic assessment. FICO’s mix reduces concentration risk and supports ecosystem lock-in through complementary offerings, enhancing long-term resilience.
Strengths and Weaknesses Comparison
This table compares the Strengths and Weaknesses of Fair Isaac Corporation (FICO) and The Trade Desk, Inc. (TTD):
FICO Strengths
- High net margin at 32.75%
- Exceptional ROIC at 52.96%, well above WACC
- Strong asset and fixed asset turnover
- Favorable interest coverage
- Diverse revenue from applications and scores
- Solid presence in Americas, Asia Pacific, and EMEA
TTD Strengths
- Positive net margin at 16.08%
- Favorable ROIC exceeding WACC
- Strong current and quick ratios indicating liquidity
- Low debt-to-assets ratio at 5.11%
- Infinite interest coverage
- Efficient fixed asset turnover
- Favorable global ratios evaluation
FICO Weaknesses
- Negative ROE at -37.34% indicates shareholder returns issues
- Unfavorable current ratio below 1.0, signaling liquidity risks
- Very high debt-to-assets ratio at 164.6%
- Elevated P/E ratio at 55.64 suggests overvaluation
- Negative price-to-book ratio
- No dividend yield
- Moderate global ratios unfavorable percentage
TTD Weaknesses
- High P/E ratio at 146.77 indicating potential overvaluation
- Unfavorable price-to-book ratio at 19.56
- Low asset turnover at 0.4, less efficient asset use
- No dividend yield
- Some unfavorable but fewer ratios compared to FICO
Both companies show strengths in profitability and capital efficiency, but FICO faces liquidity and leverage concerns. TTD’s strong liquidity and low leverage contrast with valuation risks and lower asset turnover. These factors influence each company’s strategic focus on financial stability and growth.
The Moat Duel: Analyzing Competitive Defensibility
A structural moat is the only reliable shield protecting long-term profits from relentless competitive erosion. Let’s dissect the moats of two tech innovators:
Fair Isaac Corporation: Data-Driven Switching Costs
Fair Isaac’s moat rests on switching costs driven by its credit scoring analytics deeply embedded in client workflows. This secures high ROIC (43.6%) and margin stability near 33%. Expansion into AI-enhanced decision software in 2026 could further cement its lead.
The Trade Desk, Inc.: Platform Network Effects
The Trade Desk’s competitive edge stems from network effects in its self-service digital advertising platform, enabling scale and data-driven targeting. However, its ROIC barely exceeds WACC by 1.1%, and the declining trend signals margin pressure. Growth in CTV and audio ads offers upside but with margin risk.
The Moat Battle: Switching Costs vs. Network Effects
Fair Isaac’s switching-cost moat is wider and more durable, reflected in a very favorable and growing ROIC. Trade Desk’s network effect moat is narrower, with declining profitability and value destruction signals. Fair Isaac stands better equipped to defend and expand its market share in 2026.
Which stock offers better returns?
Over the past year, Fair Isaac Corporation’s stock showed a notable overall gain despite recent weakness, while The Trade Desk, Inc. experienced a steep decline with accelerating negative momentum.
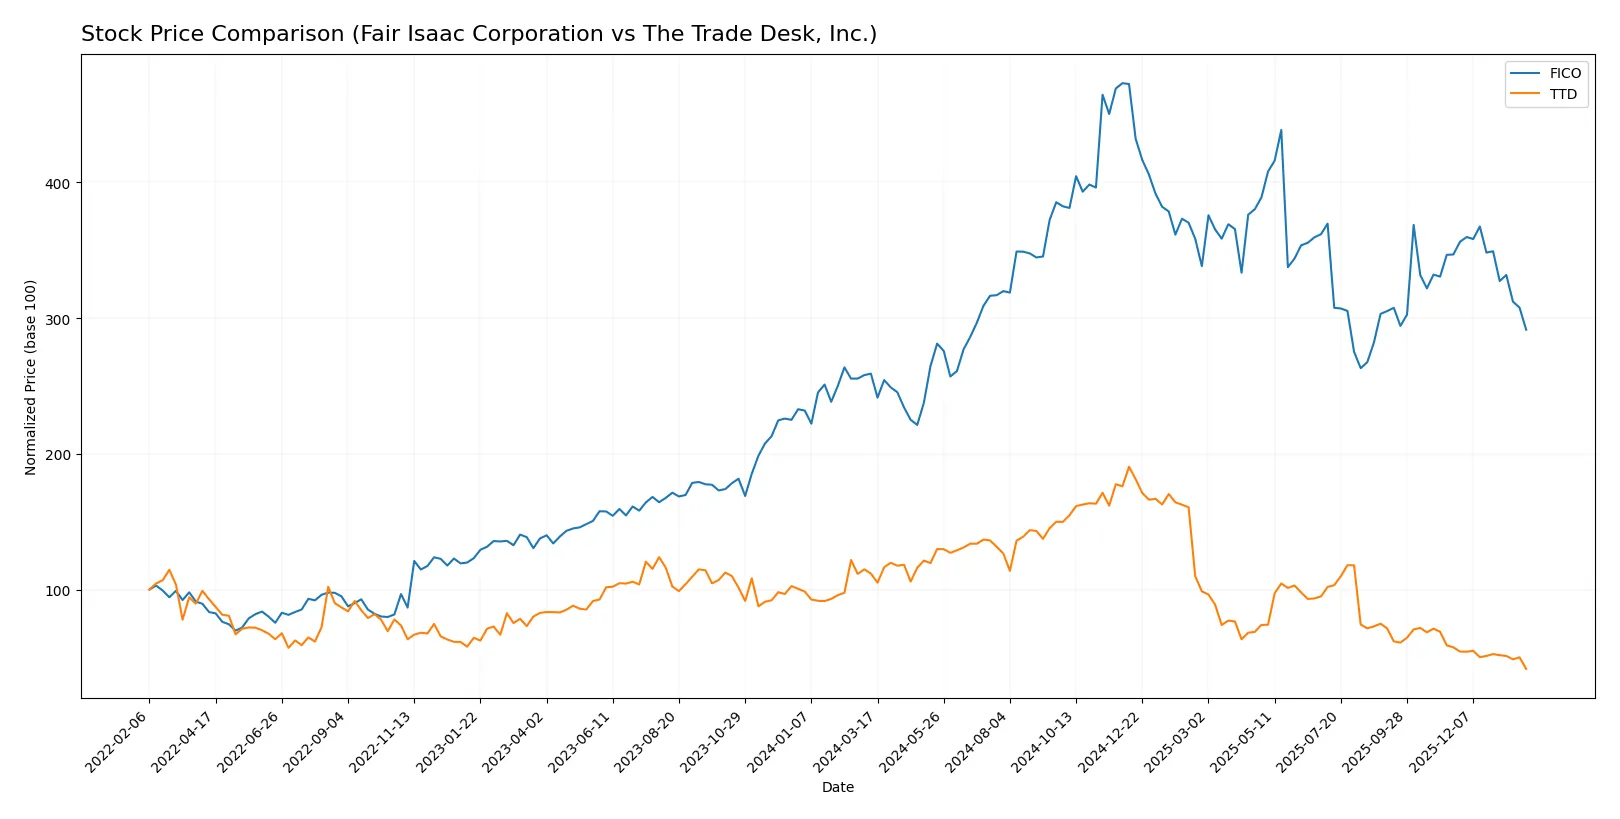
Trend Comparison
Fair Isaac Corporation’s stock rose 12.51% over the past 12 months, marking a bullish trend with decelerating gains and high volatility, peaking at 2375.03 and bottoming at 1110.85.
The Trade Desk, Inc. declined 62.83% in the same period, a bearish trend with accelerating losses, less volatility, hitting a high of 139.11 and a low of 30.33.
Fair Isaac’s stock delivered stronger market performance, outperforming The Trade Desk by a wide margin during the last year.
Target Prices
Analysts present a broad range but a clear upside potential consensus for these technology firms.
| Company | Target Low | Target High | Consensus |
|---|---|---|---|
| Fair Isaac Corporation | 1640 | 2400 | 2115 |
| The Trade Desk, Inc. | 39 | 98 | 56.53 |
Fair Isaac’s consensus target of 2115 sits substantially above its current 1463 price, signaling strong growth expectations. The Trade Desk’s consensus target of 56.53 also suggests significant upside from its 30.33 price, reflecting bullish analyst sentiment.

Don’t Let Luck Decide Your Entry Point
Optimize your entry points with our advanced ProRealTime indicators. You’ll get efficient buy signals with precise price targets for maximum performance. Start outperforming now!
How do institutions grade them?
Here is a summary of the recent institutional grades for Fair Isaac Corporation and The Trade Desk, Inc.:
Fair Isaac Corporation Grades
The table below details recent grades from reputable financial institutions for Fair Isaac Corporation.
| Grading Company | Action | New Grade | Date |
|---|---|---|---|
| Needham | Maintain | Buy | 2026-01-29 |
| Jefferies | Maintain | Buy | 2026-01-16 |
| Wells Fargo | Maintain | Overweight | 2026-01-14 |
| JP Morgan | Maintain | Neutral | 2025-11-06 |
| Baird | Maintain | Outperform | 2025-11-06 |
| Jefferies | Maintain | Buy | 2025-11-06 |
| BMO Capital | Maintain | Outperform | 2025-11-06 |
| Wells Fargo | Maintain | Overweight | 2025-10-14 |
| Barclays | Maintain | Overweight | 2025-10-02 |
| Needham | Maintain | Buy | 2025-10-02 |
The Trade Desk, Inc. Grades
Below are recent institutional grades for The Trade Desk, Inc. from recognized grading companies.
| Grading Company | Action | New Grade | Date |
|---|---|---|---|
| Citigroup | Maintain | Neutral | 2026-01-27 |
| Rosenblatt | Maintain | Buy | 2026-01-27 |
| Truist Securities | Maintain | Buy | 2026-01-27 |
| CFRA | Downgrade | Hold | 2026-01-27 |
| Citizens | Downgrade | Market Perform | 2026-01-23 |
| Stifel | Maintain | Buy | 2026-01-23 |
| UBS | Maintain | Buy | 2026-01-20 |
| B of A Securities | Maintain | Underperform | 2026-01-20 |
| Morgan Stanley | Maintain | Equal Weight | 2026-01-13 |
| Wells Fargo | Maintain | Equal Weight | 2026-01-12 |
Which company has the best grades?
Fair Isaac Corporation consistently receives stronger grades, predominantly Buy, Overweight, and Outperform from top firms. The Trade Desk shows mixed ratings, including downgrades and some Hold or Equal Weight grades. Investors might view Fair Isaac as having a more favorable institutional outlook.
Risks specific to each company
The following categories identify the critical pressure points and systemic threats facing both firms in the 2026 market environment:
1. Market & Competition
Fair Isaac Corporation
- Faces intense rivalry in analytics and decision software, with pricing pressure from agile SaaS competitors.
The Trade Desk, Inc.
- Competes in a fast-evolving digital advertising space, challenged by giants like Google and Meta and shifting consumer privacy norms.
2. Capital Structure & Debt
Fair Isaac Corporation
- High debt-to-assets ratio (165%) signals leverage risks despite good interest coverage.
The Trade Desk, Inc.
- Maintains low debt levels with a healthy current ratio, indicating stronger balance sheet resilience.
3. Stock Volatility
Fair Isaac Corporation
- Higher beta (1.29) suggests above-market volatility, increasing risk during downturns.
The Trade Desk, Inc.
- Slightly lower beta (1.11) implies moderate volatility, better cushioning market swings.
4. Regulatory & Legal
Fair Isaac Corporation
- Subject to compliance risks in financial services and data privacy regulations globally.
The Trade Desk, Inc.
- Faces scrutiny over ad targeting and data privacy, particularly with evolving digital advertising laws.
5. Supply Chain & Operations
Fair Isaac Corporation
- Relies on software development and professional services; operational risks include talent retention and platform integration.
The Trade Desk, Inc.
- Cloud-based platform depends on stable tech infrastructure and data partnerships, vulnerable to service disruptions.
6. ESG & Climate Transition
Fair Isaac Corporation
- Moderate exposure to ESG risks; must align analytics products with sustainability trends.
The Trade Desk, Inc.
- Increasing pressure to demonstrate sustainable ad practices and reduce operational carbon footprint.
7. Geopolitical Exposure
Fair Isaac Corporation
- Operates globally, exposed to geopolitical tensions affecting data flows and cross-border regulations.
The Trade Desk, Inc.
- International ad markets expose it to geopolitical volatility and regulatory fragmentation risks.
Which company shows a better risk-adjusted profile?
Fair Isaac’s largest risk lies in its excessive leverage, raising solvency concerns despite strong operating metrics. The Trade Desk faces significant market and regulatory pressures amid a disruptive ad tech landscape. However, TTD’s stronger balance sheet and lower volatility give it a superior risk-adjusted profile. Notably, FICO’s debt-to-assets ratio at 165% starkly contrasts with TTD’s conservative 5%, underscoring my concern about FICO’s financial stability.
Final Verdict: Which stock to choose?
Fair Isaac Corporation’s superpower lies in its exceptional capital efficiency, generating returns well above its cost of capital. This durable competitive advantage fuels strong profitability and cash flow, though its stretched balance sheet and low liquidity warrant close monitoring. It fits portfolios aiming for aggressive growth with a tolerance for leverage risk.
The Trade Desk stands out for its strategic moat rooted in digital advertising dominance and recurring revenue streams. It offers a safer financial profile with solid liquidity and manageable debt, though its declining ROIC signals caution. This stock appeals to investors seeking growth at a reasonable price with a preference for stability.
If you prioritize resilient value creation and high return on invested capital, Fair Isaac outshines with its robust profitability despite balance sheet risks. However, if you seek steadier financial footing and a moat in evolving digital markets, The Trade Desk offers better stability but at the cost of decreasing profitability. Both present distinct scenarios aligned with differing risk appetites.
Disclaimer: Investment carries a risk of loss of initial capital. The past performance is not a reliable indicator of future results. Be sure to understand risks before making an investment decision.
Go Further
I encourage you to read the complete analyses of Fair Isaac Corporation and The Trade Desk, Inc. to enhance your investment decisions: