Home > Comparison > Technology > FICO vs TTAN
The strategic rivalry between Fair Isaac Corporation and ServiceTitan, Inc. shapes the evolution of software application solutions. Fair Isaac operates as an established analytics and decision management powerhouse with a broad geographic footprint. In contrast, ServiceTitan specializes in field service software, focusing on infrastructure maintenance for residential and commercial clients. This analysis will evaluate which company’s operational model delivers superior risk-adjusted returns, guiding portfolio allocation amid shifting technology demands.
Table of contents
Companies Overview
Fair Isaac Corporation and ServiceTitan, Inc. hold significant roles in the software application sector, shaping industry innovation and customer solutions.
Fair Isaac Corporation: Leader in Predictive Analytics Software
Fair Isaac Corporation dominates with its analytic, software, and data management products. It earns revenue by providing decision management solutions and scoring services to businesses worldwide. In 2026, its strategic focus centers on expanding the FICO Platform and enhancing advanced analytic capabilities to meet evolving enterprise needs.
ServiceTitan, Inc.: Innovator in Field Service Software
ServiceTitan, Inc. specializes in software for field service management supporting installation and maintenance for residential and commercial infrastructure. Its core revenue comes from subscription-based software solutions. The company focuses strategically on scaling its platform to capture more market share and improve operational workflows in 2026.
Strategic Collision: Similarities & Divergences
Both companies compete in software but differ philosophically: Fair Isaac offers a modular analytics ecosystem, while ServiceTitan provides a specialized service management platform. Their battleground lies in digital transformation for business operations. Investors face distinct profiles—Fair Isaac with established market dominance and ServiceTitan as a growth-oriented challenger.
Income Statement Comparison
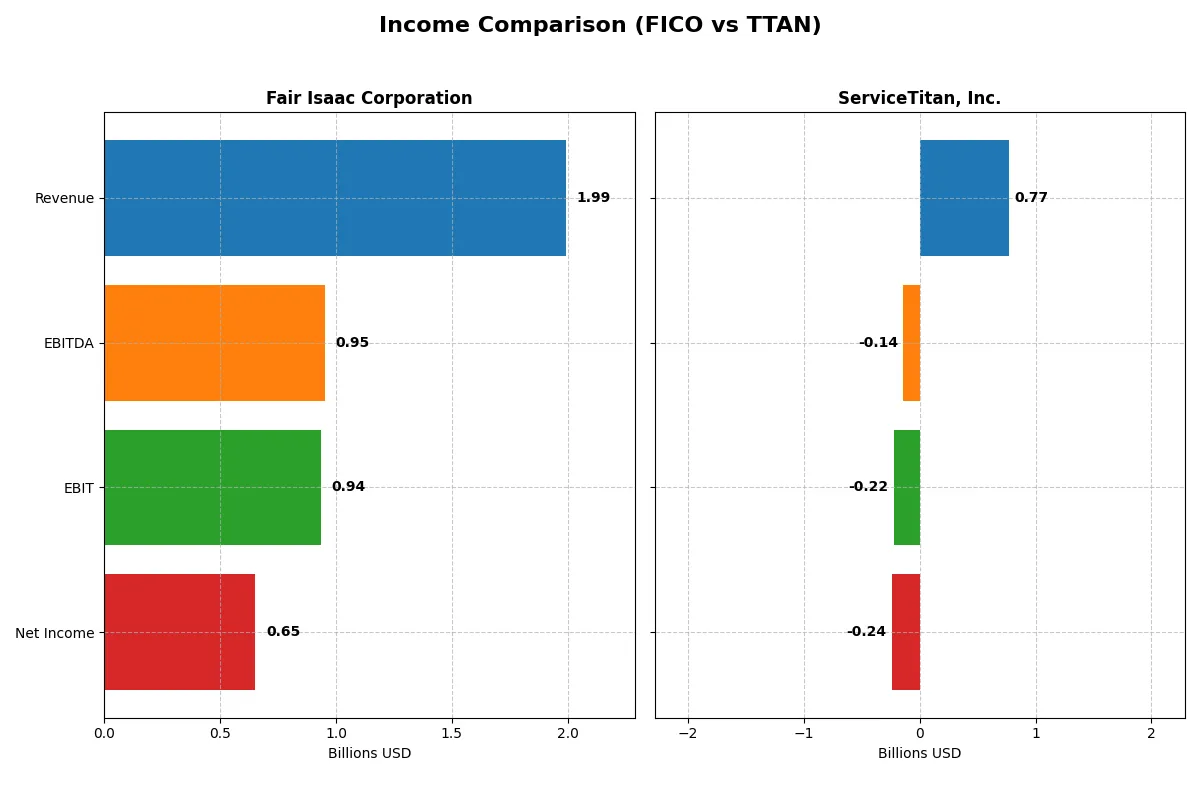
This table dissects the core profitability and scalability of both corporate engines to reveal who dominates the bottom line:
| Metric | Fair Isaac Corporation (FICO) | ServiceTitan, Inc. (TTAN) |
|---|---|---|
| Revenue | 1.99B | 772M |
| Cost of Revenue | 354M | 271M |
| Operating Expenses | 712M | 731M |
| Gross Profit | 1.64B | 501M |
| EBITDA | 951M | -141M |
| EBIT | 936M | -221M |
| Interest Expense | 134M | 16M |
| Net Income | 652M | -239M |
| EPS | 26.9 | -8.53 |
| Fiscal Year | 2025 | 2025 |
Income Statement Analysis: The Bottom-Line Duel
This income statement comparison reveals how efficiently each company converts sales into profit, exposing their operational strengths and weaknesses.
Fair Isaac Corporation (FICO) Analysis
FICO shows a steady revenue rise from $1.32B in 2021 to $1.99B in 2025, with net income surging 66% over five years to $652M. Its gross margin holds a robust 82.2%, while net margin expands to 32.8%, underlining exceptional profitability. The 2025 numbers reflect strong momentum and operational discipline.
ServiceTitan, Inc. (TTAN) Analysis
TTAN posts revenue growth from $468M in 2023 to $772M in 2025, a 65% increase. Despite a favorable gross margin of 64.9%, TTAN struggles with a deeply negative net margin near -31% in 2025, driven by high operating expenses. The latest year shows revenue momentum but persistent losses erode efficiency.
Margin Power vs. Revenue Scale
FICO leads with superior margins and consistent net income growth, delivering solid returns from expanding scale. TTAN grows revenue faster but remains unprofitable, burdened by operating costs. For investors prioritizing profitability and margin strength, FICO’s profile offers a clearer value proposition than TTAN’s high-growth yet loss-making model.
Financial Ratios Comparison
These vital ratios act as a diagnostic tool to expose the underlying fiscal health, valuation premiums, and capital efficiency of the companies compared below:
| Ratios | Fair Isaac Corporation (FICO) | ServiceTitan, Inc. (TTAN) |
|---|---|---|
| ROE | -37.3% | -16.4% |
| ROIC | 52.96% | -14.1% |
| P/E | 55.64 | -18.12 |
| P/B | -20.78 | 2.98 |
| Current Ratio | 0.83 | 3.74 |
| Quick Ratio | 0.83 | 3.74 |
| D/E | -1.76 | 0.11 |
| Debt-to-Assets | 164.6% | 9.4% |
| Interest Coverage | 6.92 | -14.82 |
| Asset Turnover | 1.07 | 0.44 |
| Fixed Asset Turnover | 21.20 | 9.57 |
| Payout ratio | 0% | 0% |
| Dividend yield | 0% | 0% |
| Fiscal Year | 2025 | 2025 |
Efficiency & Valuation Duel: The Vital Signs
Financial ratios form a company’s DNA, exposing hidden risks and operational strengths crucial to investor insight.
Fair Isaac Corporation
Fair Isaac delivers strong operational efficiency with a robust ROIC at 53%, yet suffers from a negative ROE of -37%. Its P/E ratio at 56 signals an expensive valuation. The absence of dividends highlights a strategy focused on reinvestment in R&D, supporting future growth despite a concerning current ratio below 1.
ServiceTitan, Inc.
ServiceTitan struggles with profitability, posting negative ROE and ROIC, reflecting operational challenges. The company’s P/E is negative, indicating losses, but a favorable WACC of 5% suggests cost-effective capital. High current and quick ratios show liquidity strength, while heavy R&D investment replaces shareholder payouts amid ongoing losses.
Premium Valuation vs. Operational Safety
Fair Isaac commands a premium valuation with strong capital returns but faces liquidity and shareholder yield concerns. ServiceTitan offers better liquidity and capital cost control but lacks profitability. Investors prioritizing operational resilience may lean toward Fair Isaac; those focusing on liquidity and growth potential might consider ServiceTitan’s risk profile.
Which one offers the Superior Shareholder Reward?
Fair Isaac Corporation (FICO) and ServiceTitan, Inc. (TTAN) both forgo dividends, focusing instead on reinvestment and buybacks. FICO delivers a robust free cash flow per share of $31.8 with a near 100% FCF to operating cash flow conversion, enabling a strong buyback program that supports its lofty valuation (P/FCF of 47). TTAN, meanwhile, posts negative net margins and free cash flow of only $0.37 per share, reflecting heavy reinvestment and operational challenges. FICO’s high operating margins and consistent cash generation underpin a more sustainable capital allocation. I conclude FICO offers superior total shareholder return potential through disciplined buybacks and cash flow, compared to TTAN’s riskier growth reinvestment model.
Comparative Score Analysis: The Strategic Profile
The radar chart reveals the fundamental DNA and trade-offs of Fair Isaac Corporation and ServiceTitan, Inc., highlighting their financial strengths and vulnerabilities side by side:
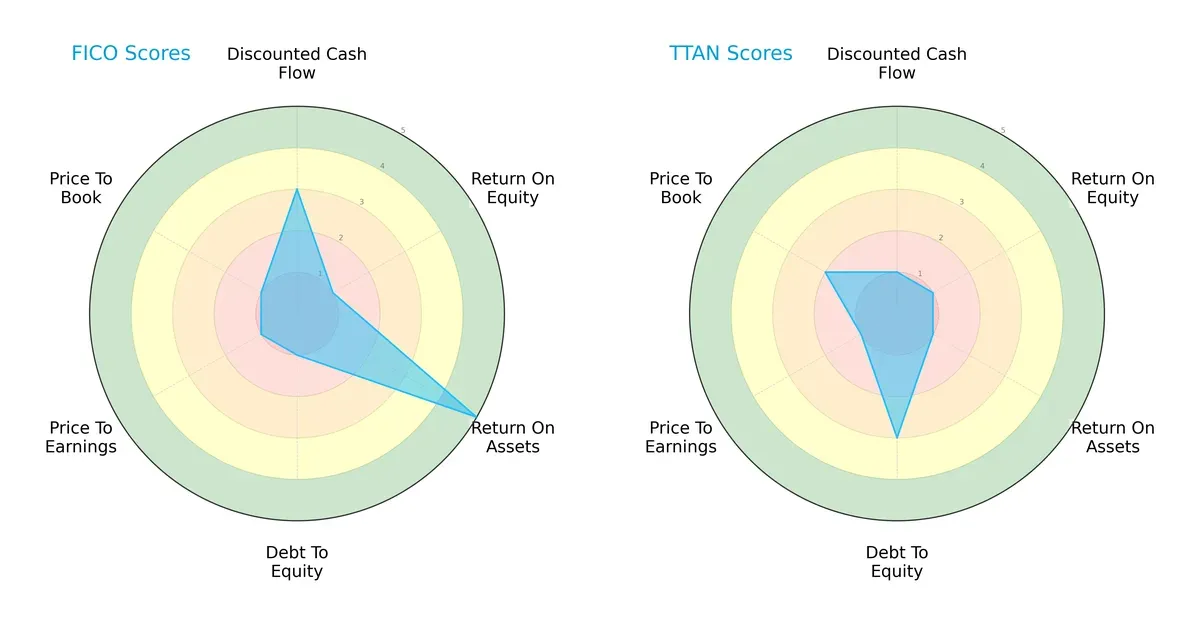
Fair Isaac (FICO) exhibits a more balanced profile with moderate DCF and very favorable ROA, but suffers from weak ROE, debt management, and valuation metrics. ServiceTitan (TTAN) relies heavily on moderate debt-to-equity discipline but lags across DCF, ROE, ROA, and valuation scores. FICO’s strength in asset utilization contrasts TTAN’s broader financial weaknesses.
—
Bankruptcy Risk: Solvency Showdown
The Altman Z-Scores place both firms well into the safe zone, indicating strong long-term survival prospects amid current market uncertainties:
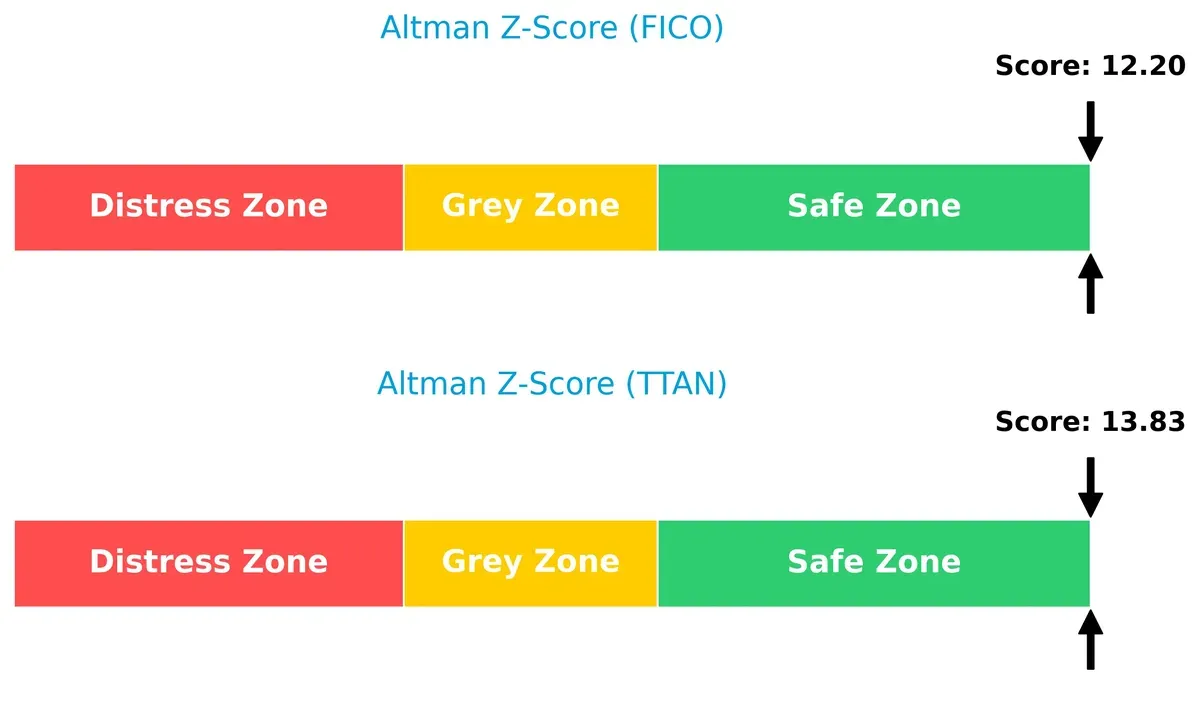
Fair Isaac scores 12.2 and ServiceTitan 13.8, both far above the distress threshold. This suggests robust solvency and low bankruptcy risk for investors focused on stability.
—
Financial Health: Quality of Operations
Fair Isaac’s Piotroski F-Score of 7 signals strong financial health, outperforming ServiceTitan’s average score of 6 and showing fewer red flags in profitability and efficiency metrics:
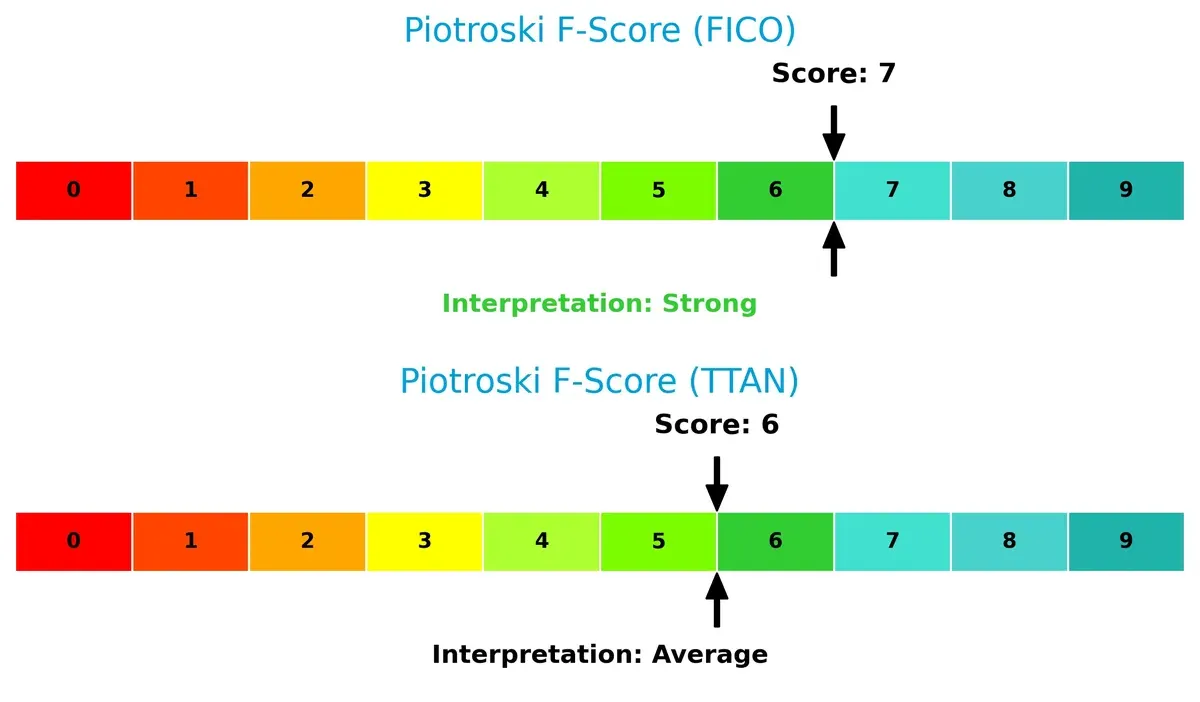
This gap underscores FICO’s superior operational quality and internal financial discipline, providing a safer margin for value investors.
How are the two companies positioned?
This section dissects FICO and TTAN’s operational DNA by comparing revenue distribution and internal dynamics. The goal is to confront their economic moats to reveal which model offers the most resilient competitive advantage today.
Revenue Segmentation: The Strategic Mix
This visual comparison dissects how Fair Isaac Corporation and ServiceTitan diversify their income streams and where their primary sector bets lie:
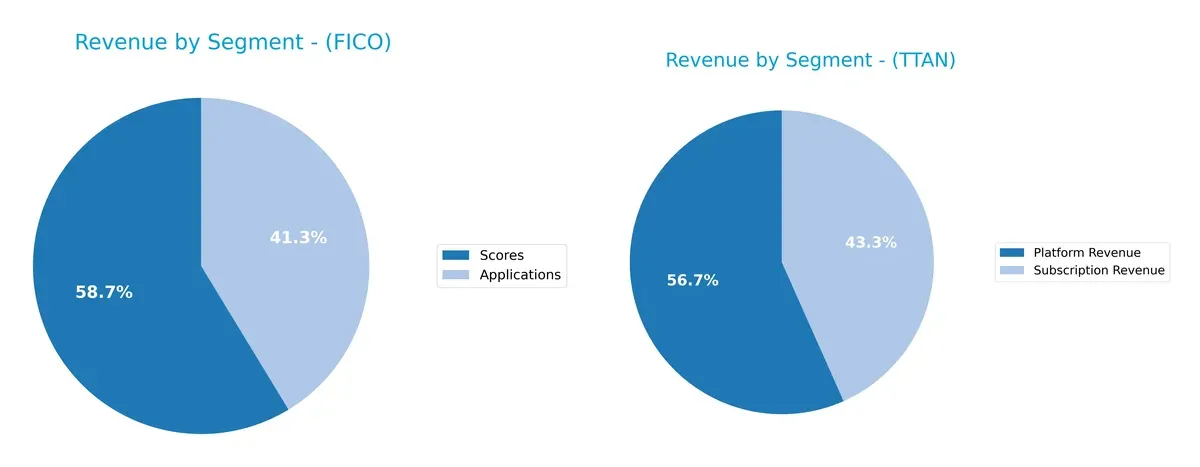
Fair Isaac Corporation balances revenue between Scores at $1.17B and Applications at $822M in 2025, reflecting a dual focus on credit scoring and application software. ServiceTitan leans heavily on Platform Revenue with $739M, anchored by $566M from Subscriptions. FICO’s diversified mix mitigates concentration risk, while ServiceTitan’s reliance on platform and subscription revenues signals strong ecosystem lock-in but potential exposure to market shifts in those lines.
Strengths and Weaknesses Comparison
This table compares the strengths and weaknesses of Fair Isaac Corporation (FICO) and ServiceTitan, Inc. (TTAN):
FICO Strengths
- High net margin of 32.75%
- Strong ROIC at 52.96% well above WACC
- Favorable asset turnover and fixed asset turnover
- Low debt-to-equity ratio with good interest coverage
- Diversified revenue from Applications and Scores segments
- Significant global presence, especially Americas
TTAN Strengths
- Favorable WACC at 4.95% indicating low capital cost
- Favorable PE ratio despite negative earnings
- Strong quick ratio at 3.74 supports liquidity
- Low debt-to-assets at 9.35%
- Favorable fixed asset turnover of 9.57
- Solid subscription and platform revenue streams
FICO Weaknesses
- Negative ROE at -37.34% signals shareholder return issues
- Current ratio below 1 at 0.83, a liquidity red flag
- Very high debt-to-assets at 164.6% poses solvency risk
- Unfavorable PE ratio at 55.64 suggests overvaluation
- No dividend yield limits income appeal
- Heavy reliance on Americas region, limited geographic diversification
TTAN Weaknesses
- Negative net margin at -30.98% reflects unprofitability
- Negative ROE and ROIC show poor capital efficiency
- Unfavorable current ratio despite quick ratio strength
- Negative interest coverage indicates difficulty servicing debt
- Weak asset turnover at 0.44 lowers operating efficiency
- No dividend yield, limiting income potential
FICO demonstrates strong profitability and efficient capital use but faces liquidity and solvency concerns. TTAN struggles with profitability and operational efficiency despite solid liquidity and low leverage. Their contrasting profiles suggest differing strategic priorities in growth and risk management.
The Moat Duel: Analyzing Competitive Defensibility
A structural moat is the only barrier that protects long-term profits from relentless competition erosion. Let’s dissect the moats of two software firms:
Fair Isaac Corporation (FICO): Precision Analytics with Intangible Asset Moat
FICO’s primary moat lies in its proprietary analytics and scoring models—intangible assets that generate high ROIC and margin stability. Its 47% EBIT margin and 43.6% ROIC premium over WACC prove durable value creation. Expansion into new markets and AI-enhanced decision tools in 2026 should deepen this moat.
ServiceTitan, Inc. (TTAN): Emerging Platform with Network Effects
ServiceTitan’s moat relies on network effects from its field service software ecosystem, contrasting FICO’s data-centric moat. However, negative EBIT margin (-28.7%) and ROIC below WACC indicate value destruction. Growth opportunities exist, but operational inefficiencies and scaling challenges threaten moat durability.
Moat Strength Showdown: Intangible Assets vs. Network Effects
FICO’s wider and deeper moat stems from its proven ability to generate excess returns and stable profitability. ServiceTitan’s network effects remain nascent and financially fragile. I see FICO as better equipped to defend and expand its market share amid intensifying competition.
Which stock offers better returns?
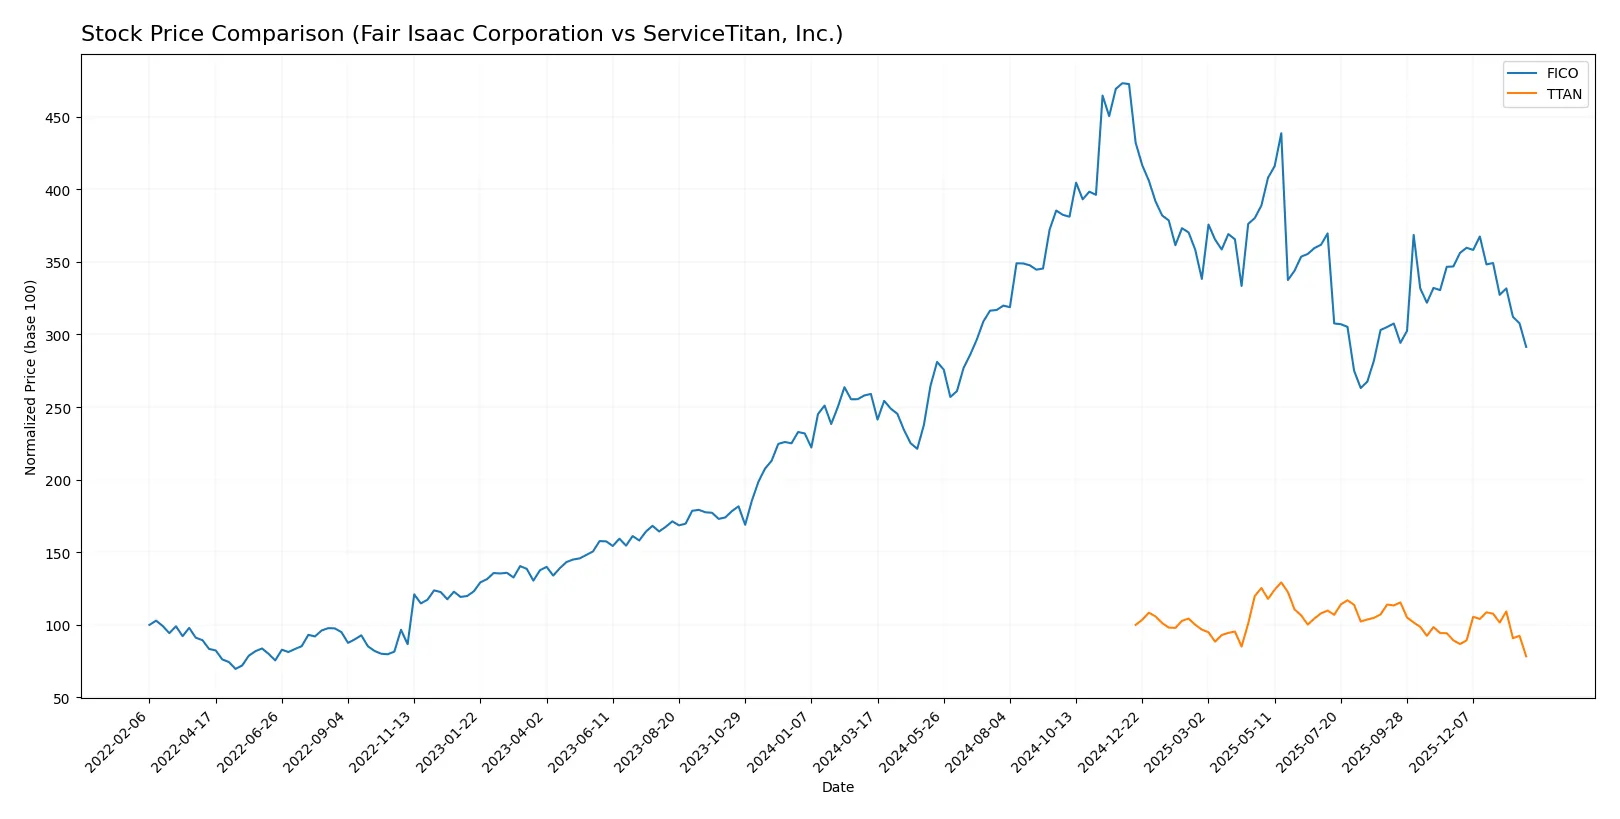
The past year reveals contrasting paths: Fair Isaac Corporation (FICO) gained 12.51%, showing a bullish but decelerating trend, while ServiceTitan, Inc. (TTAN) declined 21.66%, marking a bearish and slowing slide.
Trend Comparison
FICO’s stock rose 12.51% over the past 12 months, indicating a bullish trend with decelerating momentum. It peaked at 2375.03 and bottomed at 1110.85 during this period.
TTAN’s stock fell 21.66% in the last year, confirming a bearish trend with deceleration. Its highest price was 129.26, and the lowest hit 78.34, showing persistent decline.
Comparatively, FICO outperformed TTAN with positive returns, making it the stronger performer over the analyzed 12-month span.
Target Prices
Analysts present a bullish consensus for both Fair Isaac Corporation and ServiceTitan, Inc.
| Company | Target Low | Target High | Consensus |
|---|---|---|---|
| Fair Isaac Corporation | 1,640 | 2,400 | 2,115 |
| ServiceTitan, Inc. | 117 | 145 | 133.11 |
The consensus targets imply substantial upside from current prices: FICO trades at 1,463 while TTAN sits at 78.34. Analysts expect both to outperform their recent market levels.

Don’t Let Luck Decide Your Entry Point
Optimize your entry points with our advanced ProRealTime indicators. You’ll get efficient buy signals with precise price targets for maximum performance. Start outperforming now!
How do institutions grade them?
Fair Isaac Corporation Grades
Here are the recent grades assigned to Fair Isaac Corporation by various firms:
| Grading Company | Action | New Grade | Date |
|---|---|---|---|
| Needham | Maintain | Buy | 2026-01-29 |
| Jefferies | Maintain | Buy | 2026-01-16 |
| Wells Fargo | Maintain | Overweight | 2026-01-14 |
| JP Morgan | Maintain | Neutral | 2025-11-06 |
| Baird | Maintain | Outperform | 2025-11-06 |
| Jefferies | Maintain | Buy | 2025-11-06 |
| BMO Capital | Maintain | Outperform | 2025-11-06 |
| Wells Fargo | Maintain | Overweight | 2025-10-14 |
| Barclays | Maintain | Overweight | 2025-10-02 |
| Needham | Maintain | Buy | 2025-10-02 |
ServiceTitan, Inc. Grades
These are the latest grades assigned to ServiceTitan, Inc. from key grading companies:
| Grading Company | Action | New Grade | Date |
|---|---|---|---|
| BMO Capital | Maintain | Outperform | 2025-12-05 |
| Piper Sandler | Maintain | Overweight | 2025-12-05 |
| TD Cowen | Maintain | Buy | 2025-12-05 |
| Morgan Stanley | Maintain | Equal Weight | 2025-12-05 |
| BMO Capital | Maintain | Outperform | 2025-11-20 |
| Wells Fargo | Maintain | Overweight | 2025-09-19 |
| Stifel | Maintain | Buy | 2025-09-19 |
| Piper Sandler | Maintain | Overweight | 2025-09-19 |
| Canaccord Genuity | Maintain | Buy | 2025-09-19 |
| Citigroup | Maintain | Neutral | 2025-09-09 |
Which company has the best grades?
Fair Isaac Corporation consistently earns Buy and Overweight ratings from top firms. ServiceTitan also holds strong Outperform and Buy grades but includes some Equal Weight and Neutral ratings. Investors may view FICO’s grades as reflecting steadier analyst confidence.
Risks specific to each company
The following categories identify critical pressure points and systemic threats facing Fair Isaac Corporation and ServiceTitan, Inc. in the 2026 market environment:
1. Market & Competition
Fair Isaac Corporation
- Established leader in analytic software with broad global reach. Faces mature market saturation risks.
ServiceTitan, Inc.
- Newer entrant focused on field service software, competing in a niche with rapid innovation demands.
2. Capital Structure & Debt
Fair Isaac Corporation
- High debt-to-assets ratio (165%) signals leverage risk despite favorable interest coverage.
ServiceTitan, Inc.
- Low debt-to-assets (9.35%) and manageable debt-to-equity ratio indicate conservative leverage.
3. Stock Volatility
Fair Isaac Corporation
- Beta at 1.29 shows above-market volatility, raising risk in turbulent markets.
ServiceTitan, Inc.
- Negative beta (-0.85) suggests defensive characteristics but also unusual market sensitivity.
4. Regulatory & Legal
Fair Isaac Corporation
- Operates in heavily regulated financial software sector with compliance costs and legal scrutiny.
ServiceTitan, Inc.
- Faces regulatory scrutiny tied to data security in field service and infrastructure markets.
5. Supply Chain & Operations
Fair Isaac Corporation
- Relies on software development and cloud infrastructure; moderate operational risks.
ServiceTitan, Inc.
- Dependent on hardware integration and field service logistics, exposing it to operational disruptions.
6. ESG & Climate Transition
Fair Isaac Corporation
- Increasing pressure to align analytics products with ESG compliance standards.
ServiceTitan, Inc.
- Must adapt operations for sustainable practices amid growing climate-related regulations.
7. Geopolitical Exposure
Fair Isaac Corporation
- Global presence exposes it to geopolitical risks in multiple regions, including trade tensions.
ServiceTitan, Inc.
- Primarily US-focused, limiting direct geopolitical risk but vulnerable to domestic policy shifts.
Which company shows a better risk-adjusted profile?
Fair Isaac’s leverage and volatile stock price present significant risks, but strong profitability and global scale bolster resilience. ServiceTitan’s conservative debt and operational niche reduce financial risk but its negative margins and stock performance flag profitability concerns. Fair Isaac offers a more balanced risk-adjusted profile due to its strong cash flow and higher Altman Z-score, despite leverage concerns.
Final Verdict: Which stock to choose?
Fair Isaac Corporation’s superpower lies in its durable competitive advantage, demonstrated by a robust and growing ROIC well above its cost of capital. Its ability to generate exceptional profitability and solid cash flow underscores operational excellence. The key point of vigilance is its weak liquidity position, which could challenge short-term flexibility. FICO suits investors targeting aggressive growth with a tolerance for cyclical balance sheet risks.
ServiceTitan’s strategic moat centers on its cloud-based recurring revenue model, offering predictable top-line growth. It carries a safer liquidity profile than FICO but struggles with persistent profitability issues and value destruction, reflecting an early-stage or turnaround scenario. TTAN fits investors focused on GARP—growth at a reasonable price—who accept higher volatility for potential market share gains.
If you prioritize sustained value creation and operational efficiency, Fair Isaac outshines with superior profitability and a strong moat. However, if you seek growth driven by innovation and recurring revenue with more conservative liquidity, ServiceTitan offers better stability despite its earnings challenges. Both present distinct risk-reward profiles aligned with different investor strategies.
Disclaimer: Investment carries a risk of loss of initial capital. The past performance is not a reliable indicator of future results. Be sure to understand risks before making an investment decision.
Go Further
I encourage you to read the complete analyses of Fair Isaac Corporation and ServiceTitan, Inc. to enhance your investment decisions: