Home > Comparison > Technology > MSFT vs FFIV
The strategic rivalry between Microsoft Corporation and F5, Inc. shapes the Technology sector’s software infrastructure landscape. Microsoft operates as a diversified tech giant with cloud, productivity, and device ecosystems, while F5 specializes in multi-cloud application security and delivery solutions. This head-to-head contrasts scale and breadth against niche expertise. This analysis will determine which trajectory offers superior risk-adjusted returns for a diversified portfolio in an evolving digital economy.
Table of contents
Companies Overview
Microsoft and F5 represent pivotal players in the software infrastructure market, each shaping cloud and application delivery landscapes distinctly.
Microsoft Corporation: Technology Giant with Diverse Software Ecosystem
Microsoft dominates as a technology leader with a broad software portfolio. Its core revenue stems from cloud services like Azure, productivity tools including Office 365, and Windows licensing. In 2026, Microsoft sharpens its strategic focus on expanding Intelligent Cloud offerings while integrating AI and enhancing enterprise productivity solutions globally.
F5, Inc.: Specialist in Multi-Cloud Application Security
F5 stands out as a specialist provider of multi-cloud application security and delivery solutions. It generates revenue through products like BIG-IP appliances, NGINX software, and advanced firewall services. In 2026, F5 prioritizes strengthening its multi-cloud partnerships and advancing application security, targeting enterprises needing robust, adaptable network protection.
Strategic Collision: Similarities & Divergences
Microsoft and F5 both operate in software infrastructure but diverge in scope—Microsoft pursues a broad platform ecosystem, while F5 focuses on specialized application security. Their main battleground lies in cloud service integration and security layers. Investors face contrasting profiles: Microsoft offers expansive scale and diversification; F5 provides niche expertise with targeted growth prospects.
Income Statement Comparison
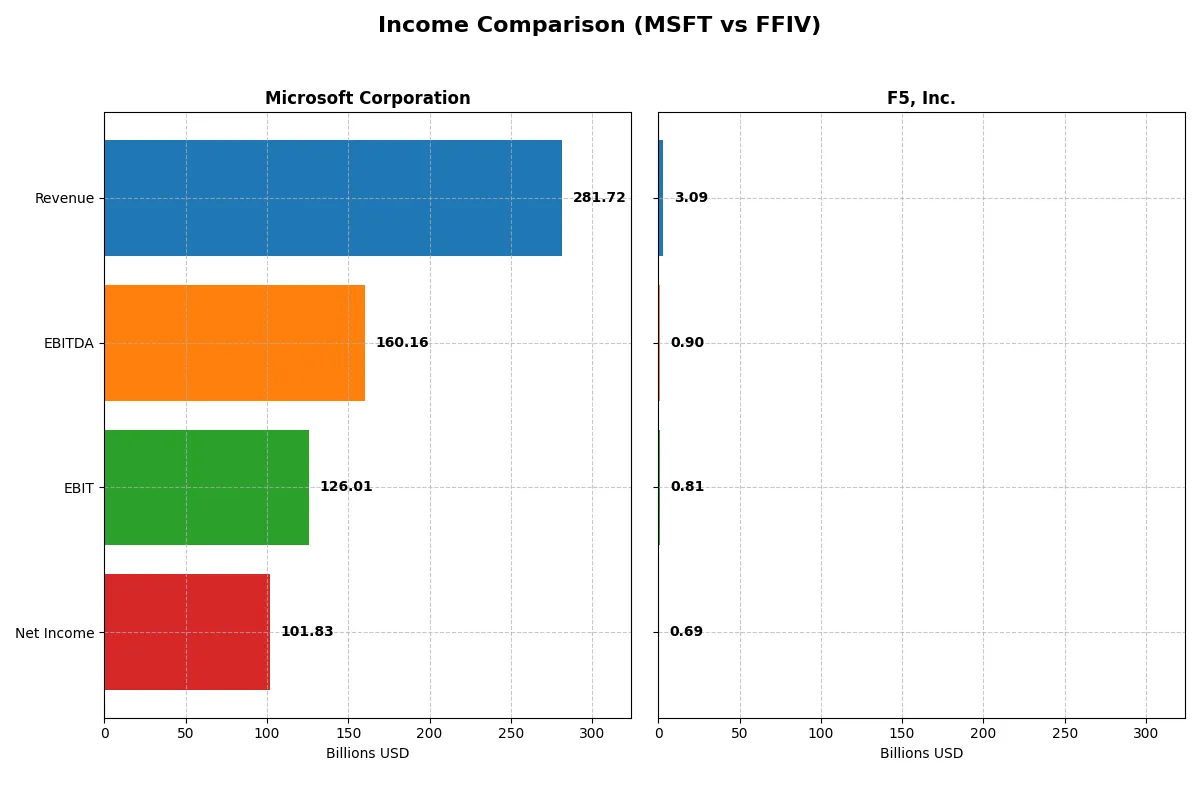
This data dissects the core profitability and scalability of both corporate engines to reveal who dominates the bottom line:
| Metric | Microsoft Corporation (MSFT) | F5, Inc. (FFIV) |
|---|---|---|
| Revenue | 282B | 3.1B |
| Cost of Revenue | 88B | 564M |
| Operating Expenses | 65.4B | 1.76B |
| Gross Profit | 194B | 2.52B |
| EBITDA | 160.2B | 901M |
| EBIT | 126B | 808M |
| Interest Expense | 2.39B | 0 |
| Net Income | 101.8B | 692M |
| EPS | 13.7 | 11.95 |
| Fiscal Year | 2025 | 2025 |
Income Statement Analysis: The Bottom-Line Duel
This income statement comparison exposes the true operational strength and margin discipline of two distinct corporate engines.
Microsoft Corporation Analysis
Microsoft’s revenue climbed from $168B in 2021 to $282B in 2025, showing robust growth. Net income surged from $61B to $102B, reflecting solid earnings power. Gross margin holds steady at 68.8%, while net margin remains healthy at 36.2%. The 2025 fiscal year highlights strong momentum with a 15% EPS increase, underscoring operational efficiency.
F5, Inc. Analysis
F5’s revenue grew from $2.6B in 2021 to $3.1B in 2025, a moderate expansion. Net income more than doubled from $331M to $692M, driven by margin improvements. Gross margin impresses at 81.7%, while net margin climbed to 22.4%. The latest year shows a sharp 24% EPS growth, signaling accelerating profitability despite slower top-line gains.
Margin Dominance vs. Earnings Growth
Microsoft dominates with scale and superior net margins, delivering steady, high-margin profits that investors covet. F5 impresses with faster net income growth and expanding margins, but on a far smaller base. For investors prioritizing consistent margin power and scale, Microsoft’s profile offers greater reliability and financial muscle.
Financial Ratios Comparison
These vital ratios act as a diagnostic tool to expose the underlying fiscal health, valuation premiums, and capital efficiency of each company:
| Ratios | Microsoft Corporation (MSFT) | F5, Inc. (FFIV) |
|---|---|---|
| ROE | 29.6% | 19.3% |
| ROIC | 22.0% | 14.0% |
| P/E | 36.3 | 26.9 |
| P/B | 10.8 | 5.2 |
| Current Ratio | 1.35 | 1.56 |
| Quick Ratio | 1.35 | 1.51 |
| D/E (Debt-to-Equity) | 0.18 | 0.06 |
| Debt-to-Assets | 9.8% | 3.7% |
| Interest Coverage | 53.9 | N/A |
| Asset Turnover | 0.46 | 0.49 |
| Fixed Asset Turnover | 1.23 | 9.02 |
| Payout Ratio | 23.6% | 0% |
| Dividend Yield | 0.65% | 0% |
| Fiscal Year | 2025 | 2025 |
Efficiency & Valuation Duel: The Vital Signs
Financial ratios serve as a company’s DNA, revealing hidden risks and operational excellence through key measures of profitability, valuation, and liquidity.
Microsoft Corporation
Microsoft posts a robust 29.65% ROE and a strong 36.15% net margin, signaling high profitability. Its P/E of 36.31 and P/B of 10.76 suggest the stock trades at a premium, indicating it is somewhat expensive. Dividend yield is low at 0.65%, reflecting a modest payout amid strong reinvestment in R&D and growth initiatives.
F5, Inc.
F5 delivers solid profitability with a 19.28% ROE and a 22.42% net margin, though below Microsoft’s levels. Its valuation is more moderate with a P/E of 26.91 and P/B of 5.19, yet still stretched relative to peers. The company pays no dividend, focusing cash flow on capital expenditures and product development to fuel expansion.
Premium Valuation vs. Operational Safety
Microsoft commands a higher valuation justified by superior profitability and reinvestment capacity, but offers lower yield. F5 trades cheaper with a healthier liquidity profile and no dividend. Investors seeking growth with operational stability may lean toward Microsoft. Those emphasizing capital preservation and moderate valuation might prefer F5’s profile.
Which one offers the Superior Shareholder Reward?
I compare Microsoft Corporation (MSFT) and F5, Inc. (FFIV) on dividend yield, payout ratios, and buyback intensity to gauge total shareholder return. Microsoft pays a modest 0.65% yield with a 24% payout ratio, covered comfortably by free cash flow (FCF). Its buybacks are substantial, enhancing shareholder value sustainably. F5 skips dividends entirely, reinvesting aggressively in growth and acquisitions, supported by a strong free cash flow margin and minimal debt. However, its buyback program is less pronounced. I conclude Microsoft offers a more balanced and reliable shareholder reward in 2026, combining steady income and capital return, while F5’s all-in growth strategy carries higher risk and uncertain payoff.
Comparative Score Analysis: The Strategic Profile
The radar chart reveals the fundamental DNA and trade-offs of Microsoft Corporation and F5, Inc., highlighting their core financial strengths and valuation nuances:
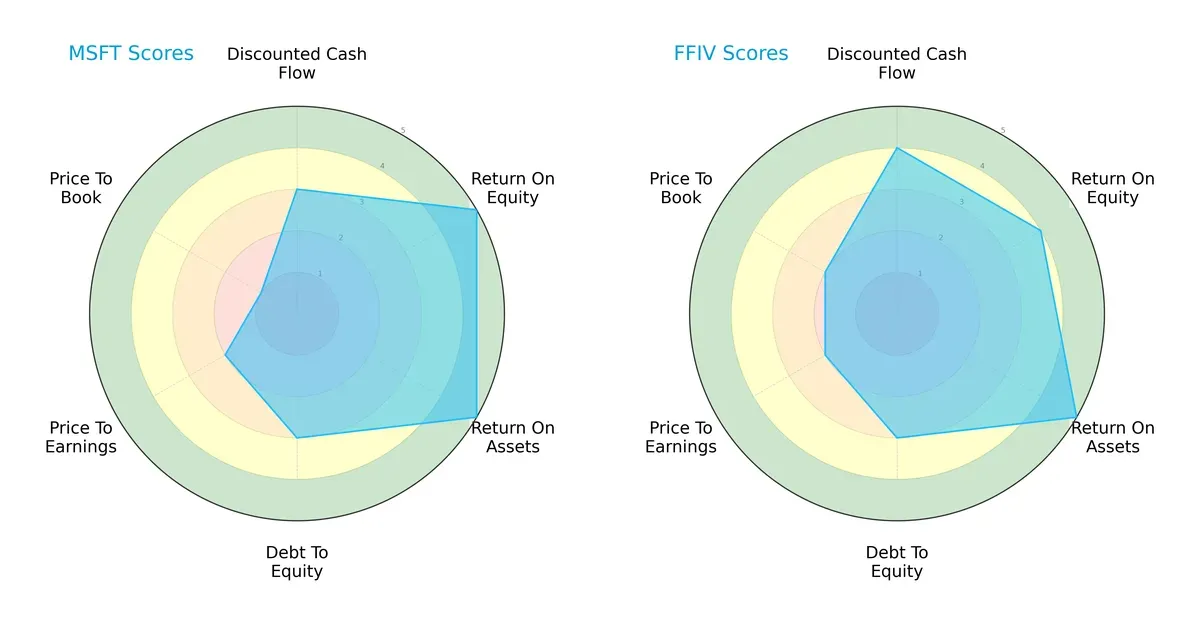
Microsoft shows top-tier efficiency with perfect ROE and ROA scores (5 each), signaling superior asset and equity profitability. F5 shines with a slightly better overall (4 vs. 3) and discounted cash flow score (4 vs. 3), indicating stronger valuation support. Both firms share moderate leverage (Debt/Equity score 3), but Microsoft’s valuation metrics lag, especially its price-to-book score (1 vs. 2), suggesting potential overpricing risks. Overall, F5 presents a more balanced profile, while Microsoft relies heavily on operational efficiency.
Bankruptcy Risk: Solvency Showdown
Microsoft’s Altman Z-Score of 9.71 far exceeds F5’s 5.32, placing both well within the safe zone but underscoring Microsoft’s superior long-term solvency:
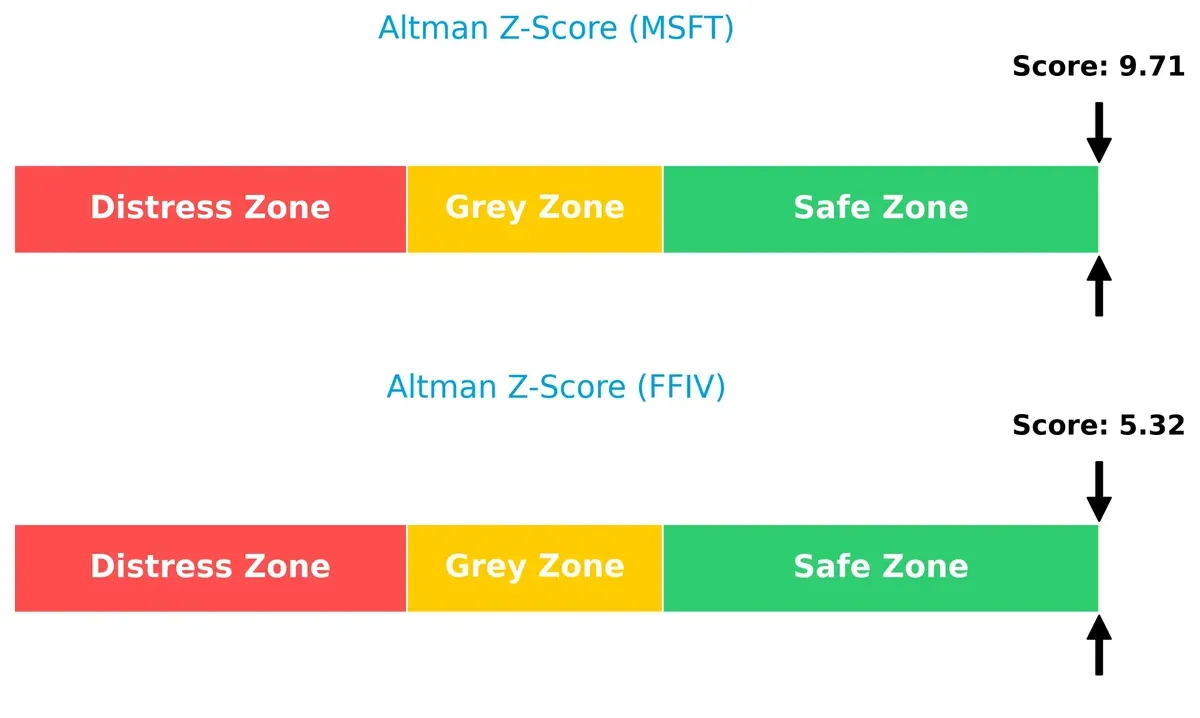
This significant gap reflects Microsoft’s stronger buffer against bankruptcy risk amid evolving market cycles. Investors should favor Microsoft in terms of financial stability, especially during economic downturns.
Financial Health: Quality of Operations
Both Microsoft and F5 score a robust 7 on the Piotroski F-Score scale, indicating strong financial health with no glaring red flags in profitability, leverage, or liquidity metrics:
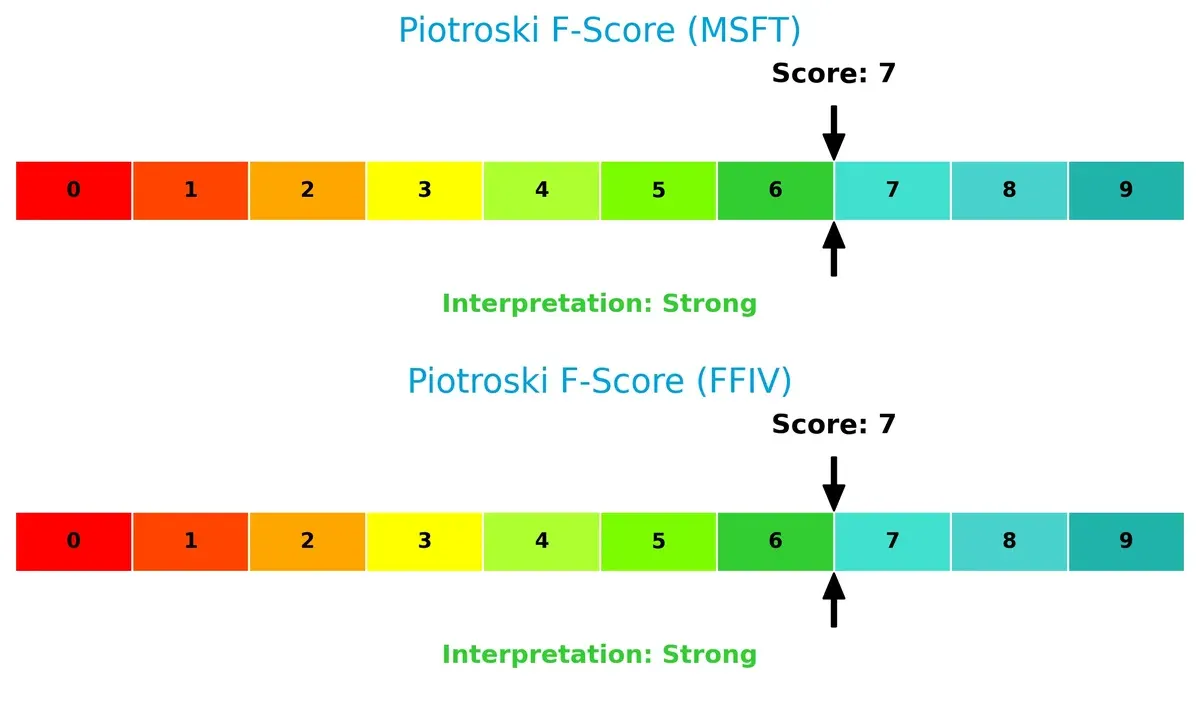
This parity suggests both companies maintain disciplined internal operations, supporting sustainable value creation despite their different market positions.
How are the two companies positioned?
This section dissects Microsoft and F5’s operational DNA by comparing their revenue distribution and internal strengths and weaknesses. The objective is to confront their economic moats and reveal which business model delivers the most resilient competitive advantage today.
Revenue Segmentation: The Strategic Mix
This comparison dissects how Microsoft Corporation and F5, Inc. diversify their income streams and where their primary sector bets lie:
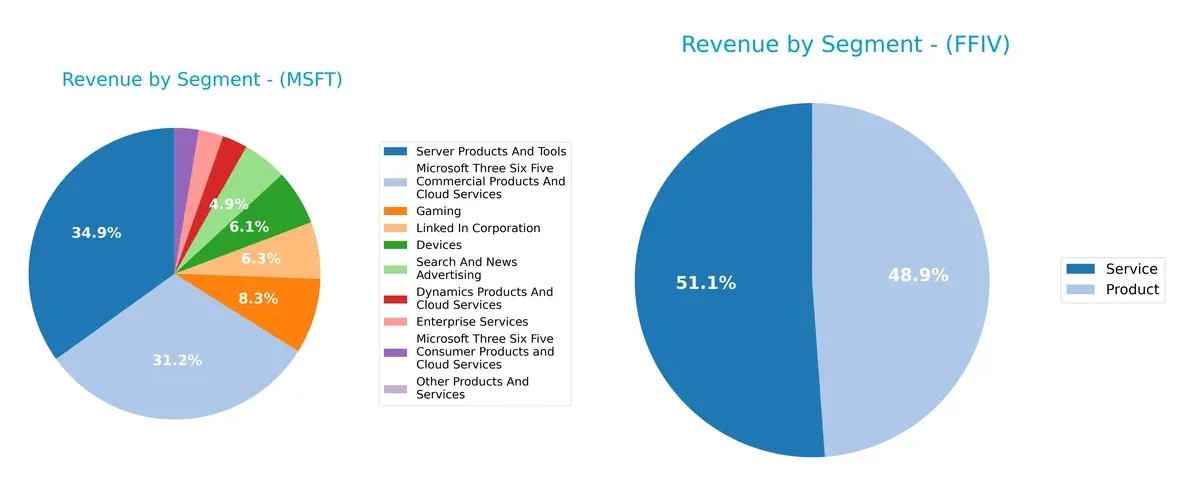
Microsoft dominates with a deeply diversified portfolio spanning Server Products ($98B), Microsoft 365 Commercial ($88B), and Gaming ($23B). In contrast, F5, Inc. balances fairly evenly between Product ($1.5B) and Service ($1.6B) revenues. Microsoft’s broad ecosystem locks in clients across software, cloud, and devices, reducing concentration risk. F5’s simpler split suggests focus but higher vulnerability to single-market shifts.
Strengths and Weaknesses Comparison
This table compares the Strengths and Weaknesses of Microsoft Corporation and F5, Inc.:
Microsoft Corporation Strengths
- Highly diversified revenue streams across cloud, gaming, enterprise services, and devices
- Robust global presence with $144B US and $137B non-US revenue
- Strong profitability metrics: 36% net margin, 30% ROE, 22% ROIC
- Favorable leverage with low debt-to-assets at 9.8% and high interest coverage
- Consistent innovation in cloud and software products
F5, Inc. Strengths
- Favorable profitability with 22% net margin, 19% ROE, and 14% ROIC
- Solid balance sheet with low debt-to-assets at 3.7% and infinite interest coverage
- Strong asset efficiency with 9.02 fixed asset turnover
- Favorable liquidity ratios, including 1.56 current ratio
- Balanced geographic revenue from Americas, EMEA, and Asia Pacific
Microsoft Corporation Weaknesses
- Relatively high valuation multiples: PE 36.3 and PB 10.8, which may limit upside
- Moderate asset turnover at 0.46, indicating less efficient asset use
- Dividend yield low at 0.65%, possibly less attractive for income investors
- Neutral current ratio at 1.35 suggests moderate short-term liquidity
- Some reliance on US market despite global footprint
F5, Inc. Weaknesses
- Elevated valuation multiples despite smaller scale: PE 26.9 and PB 5.2
- Unfavorable asset turnover at 0.49, indicating room for operational efficiency gains
- Zero dividend yield limits income potential
- Geographic concentration risk with majority revenue from Americas
- Smaller scale and less diversification compared to larger peers
Microsoft’s strengths lie in its diversified global footprint and excellent profitability, despite its high valuation. F5 enjoys favorable profitability and liquidity but faces challenges with scale and valuation as it competes in a more concentrated market. These factors shape their strategic priorities going forward.
The Moat Duel: Analyzing Competitive Defensibility
A structural moat is the sole shield protecting long-term profits from relentless competition’s erosion. Let’s dissect the core competitive advantages of these two tech firms:
Microsoft Corporation: Ecosystem Lock-In
Microsoft’s moat stems from its vast ecosystem and high switching costs across cloud, productivity, and OS platforms. Its 13.3% ROIC premium over WACC confirms strong value creation, despite a slight profitability decline in 2026. Expansion in AI and cloud markets may deepen this advantage but requires vigilance against cloud-native disruptors.
F5, Inc.: Specialized Network Security Excellence
F5’s moat relies on niche application delivery and security solutions with a rising ROIC trend (+52%) signaling growing profitability. Unlike Microsoft’s broad ecosystem, F5’s focused innovation in multi-cloud security strengthens its market foothold. The firm’s agility in adapting to emerging cloud threats positions it well for expansion in high-growth security segments.
Ecosystem Lock-In vs. Niche Specialization: Who Defends Market Share Better?
Microsoft’s wider moat benefits from entrenched platform integration and massive scale, but its declining ROIC trend signals caution. F5 boasts a deeper, more durable moat with accelerating returns. For pure moat durability and growth, F5 currently stands better equipped to defend its niche market share.
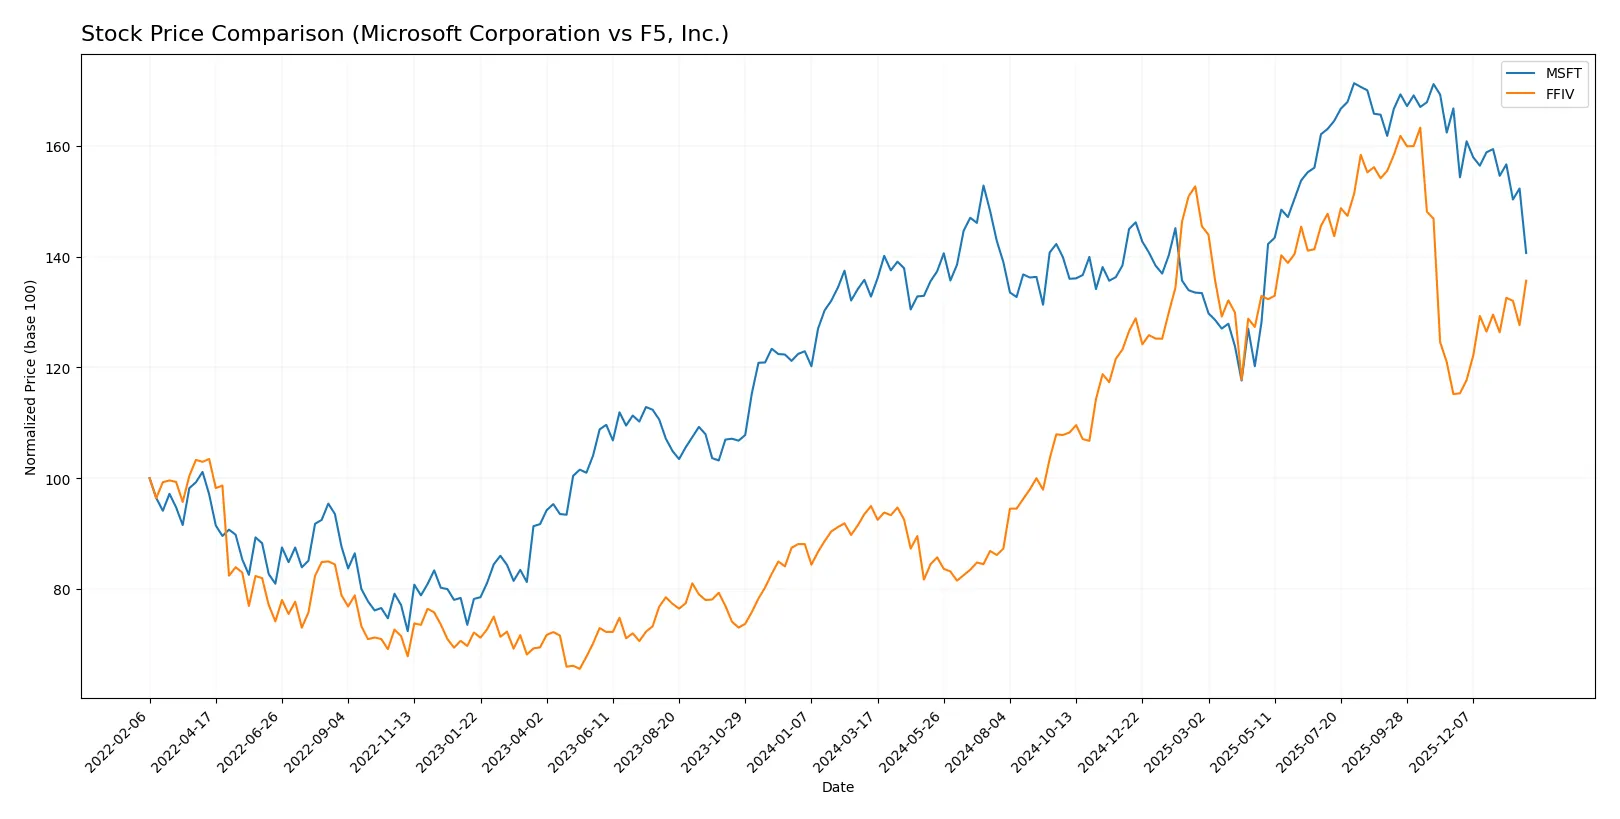
Which stock offers better returns?
The stock prices of Microsoft Corporation and F5, Inc. reveal contrasting dynamics over the past year, with F5 showing stronger gains and Microsoft experiencing a recent pullback despite overall positive returns.
Trend Comparison
Microsoft’s stock rose 5.93% over the past 12 months, indicating a bullish trend with decelerating momentum. The price ranged between 360 and 524, showing notable volatility (std dev 41.93).
F5’s stock surged 42.85% in the same period, reflecting a bullish trend with accelerating gains. Its price fluctuated from 166 to 332, with higher volatility than Microsoft (std dev 48.51).
F5 outperformed Microsoft, delivering the highest market return over the past year, driven by accelerating price gains and stronger buyer dominance.
Target Prices
Analysts project a robust upside for both Microsoft Corporation and F5, Inc., reflecting strong sector confidence.
| Company | Target Low | Target High | Consensus |
|---|---|---|---|
| Microsoft Corporation | 450 | 675 | 600.04 |
| F5, Inc. | 295 | 352 | 330.67 |
Microsoft’s consensus target of 600.04 implies a 40% premium to its current 430.29 price, signaling strong growth expectations. F5’s target consensus of 330.67 suggests a 20% upside from its 275.61 price, indicating solid confidence despite recent volatility.

Don’t Let Luck Decide Your Entry Point
Optimize your entry points with our advanced ProRealTime indicators. You’ll get efficient buy signals with precise price targets for maximum performance. Start outperforming now!
How do institutions grade them?
Microsoft Corporation Grades
The following table summarizes recent institutional grades for Microsoft Corporation:
| Grading Company | Action | New Grade | Date |
|---|---|---|---|
| Citigroup | maintain | Buy | 2026-01-30 |
| Scotiabank | maintain | Sector Outperform | 2026-01-29 |
| Wells Fargo | maintain | Overweight | 2026-01-29 |
| RBC Capital | maintain | Outperform | 2026-01-29 |
| Stifel | maintain | Buy | 2026-01-29 |
| Evercore ISI Group | maintain | Outperform | 2026-01-29 |
| Keybanc | maintain | Overweight | 2026-01-29 |
| Piper Sandler | maintain | Overweight | 2026-01-29 |
| DA Davidson | maintain | Buy | 2026-01-29 |
| Cantor Fitzgerald | maintain | Overweight | 2026-01-29 |
F5, Inc. Grades
The following table summarizes recent institutional grades for F5, Inc.:
| Grading Company | Action | New Grade | Date |
|---|---|---|---|
| Needham | maintain | Hold | 2026-01-28 |
| Piper Sandler | maintain | Overweight | 2026-01-28 |
| Goldman Sachs | maintain | Neutral | 2026-01-28 |
| Barclays | maintain | Equal Weight | 2026-01-28 |
| RBC Capital | maintain | Outperform | 2026-01-28 |
| JP Morgan | upgrade | Overweight | 2026-01-15 |
| Piper Sandler | upgrade | Overweight | 2026-01-05 |
| RBC Capital | upgrade | Outperform | 2026-01-05 |
| Morgan Stanley | maintain | Equal Weight | 2025-12-17 |
| Morgan Stanley | maintain | Equal Weight | 2025-10-28 |
Which company has the best grades?
Microsoft consistently earns buy and outperform ratings from top firms, indicating strong institutional confidence. F5’s grades are more mixed, with several hold and equal weight ratings, suggesting more cautious sentiment. This contrast may influence investor perception and portfolio positioning.
Risks specific to each company
The following categories identify the critical pressure points and systemic threats facing both firms in the 2026 market environment:
1. Market & Competition
Microsoft Corporation
- Dominates with expansive cloud and software ecosystems but faces intense competition from peers like Amazon and Google.
F5, Inc.
- Competes in niche multi-cloud security but contends with larger cloud providers expanding in security services.
2. Capital Structure & Debt
Microsoft Corporation
- Maintains low debt-to-equity (0.18) with strong interest coverage (52.84), signaling financial stability.
F5, Inc.
- Exhibits very low leverage (0.06 D/E) and infinite interest coverage, reflecting a conservative capital structure.
3. Stock Volatility
Microsoft Corporation
- Beta of 1.073 indicates moderate sensitivity to market swings, typical for a large tech giant.
F5, Inc.
- Slightly lower beta (0.975) suggests marginally less volatility and risk exposure.
4. Regulatory & Legal
Microsoft Corporation
- Faces ongoing antitrust scrutiny globally due to market dominance and data practices.
F5, Inc.
- Regulatory risk is moderate, mostly linked to cybersecurity compliance and cloud regulations.
5. Supply Chain & Operations
Microsoft Corporation
- Complex global supply chains for hardware and software delivery could expose it to disruption risks.
F5, Inc.
- Smaller scale but reliant on key suppliers for hardware appliances and cloud partnerships.
6. ESG & Climate Transition
Microsoft Corporation
- Aggressively invests in sustainability initiatives, aiming for carbon negative status by 2030.
F5, Inc.
- ESG efforts growing but less comprehensive compared to Microsoft’s scale and commitments.
7. Geopolitical Exposure
Microsoft Corporation
- Global footprint exposes it to China-US tensions and data sovereignty challenges.
F5, Inc.
- Also exposed to geopolitical risks but less diversified global operations limit impact magnitude.
Which company shows a better risk-adjusted profile?
Microsoft’s dominant market position comes with regulatory and operational complexity risks. F5’s smaller size means less market power but a more conservative capital structure and lower volatility. Microsoft’s regulatory pressure is the biggest risk, while F5 faces competitive pressures in a crowded security market. F5’s favorable debt metrics and lower beta support a better risk-adjusted profile. The recent widening in Microsoft’s P/B ratio signals market concerns about overvaluation amid regulatory scrutiny, justifying caution despite its strong fundamentals.
Final Verdict: Which stock to choose?
Microsoft’s superpower lies in its unmatched scale and diversified cash flow engine, driving consistent value creation despite a slight decline in ROIC. Its premium valuation and moderate liquidity warrant caution. It fits portfolios aiming for long-term aggressive growth with a tolerance for cyclicality.
F5, Inc. boasts a durable moat fueled by accelerating ROIC and strong free cash flow yield, reflecting efficient capital use and operational agility. Its lower leverage and favorable liquidity profile offer relative safety versus Microsoft. It suits investors seeking growth at a reasonable price with a focus on stability.
If you prioritize commanding scale and diversified revenue streams, Microsoft is the compelling choice due to its entrenched market dominance and robust profitability. However, if you seek improving profitability and a more attractive valuation, F5 offers better stability and a durable competitive advantage. Both profiles demand vigilance on valuation and operational risks ahead.
Disclaimer: Investment carries a risk of loss of initial capital. The past performance is not a reliable indicator of future results. Be sure to understand risks before making an investment decision.
Go Further
I encourage you to read the complete analyses of Microsoft Corporation and F5, Inc. to enhance your investment decisions: