In the evolving landscape of regulated electric utilities, FirstEnergy Corp. (FE) and Evergy, Inc. (EVRG) stand out as key players driving energy delivery across distinct yet overlapping regions of the United States. Both companies combine traditional power generation with growing renewable portfolios, reflecting their innovation strategies in a sector undergoing transformation. This analysis will help you uncover which company offers the most compelling investment opportunity in 2026.
Table of contents
Companies Overview
I will begin the comparison between FirstEnergy Corp. and Evergy, Inc. by providing an overview of these two companies and their main differences.
FirstEnergy Corp. Overview
FirstEnergy Corp. operates in the regulated electric industry, focusing on generating, transmitting, and distributing electricity across six U.S. states. The company owns diverse power generation assets including coal, nuclear, hydroelectric, natural gas, wind, and solar facilities. With approximately 6 million customers and extensive transmission and distribution networks, FirstEnergy is a major utility headquartered in Akron, Ohio.
Evergy, Inc. Overview
Evergy, Inc. is a regulated electric utility serving Kansas and Missouri with electricity generation, transmission, and distribution. The company uses a variety of energy sources such as coal, hydroelectric, landfill gas, uranium, natural gas, oil, solar, and wind. Evergy supports around 1.6 million customers and maintains significant transmission and distribution infrastructure. It is headquartered in Kansas City, Missouri, and was incorporated in 2017.
Key similarities and differences
Both companies operate in the regulated electric sector and provide electricity generation, transmission, and distribution services using a mix of traditional and renewable energy sources. FirstEnergy serves a larger customer base with more extensive infrastructure, while Evergy operates in fewer states with a smaller but still substantial network. Each company has diversified energy portfolios but differs in scale, geography, and incorporation history.
Income Statement Comparison
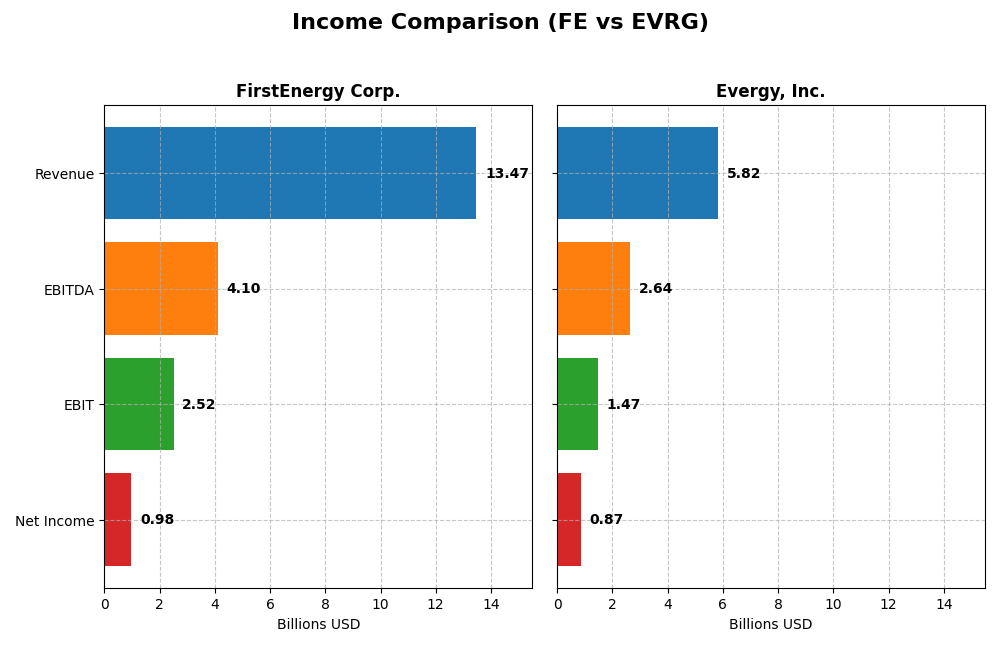
The table below presents a side-by-side comparison of key income statement metrics for FirstEnergy Corp. and Evergy, Inc. for the fiscal year 2024.
| Metric | FirstEnergy Corp. (FE) | Evergy, Inc. (EVRG) |
|---|---|---|
| Market Cap | 25.8B | 16.8B |
| Revenue | 13.47B | 5.82B |
| EBITDA | 4.10B | 2.64B |
| EBIT | 2.52B | 1.47B |
| Net Income | 978M | 874M |
| EPS | 1.70 | 3.79 |
| Fiscal Year | 2024 | 2024 |
Income Statement Interpretations
FirstEnergy Corp.
FirstEnergy Corp. showed a revenue increase of 24.9% from 2020 to 2024, reaching $13.47B in 2024, while net income declined by 9.4% over the same period to $978M. Gross and EBIT margins remained favorable at 67.5% and 18.7%, respectively, but net margin shrank to 7.3%. In 2024, revenue growth slowed to 4.7%, with net income and EPS falling, signaling margin pressures.
Evergy, Inc.
Evergy, Inc. experienced revenue growth of 18.5% from 2020 to 2024, reaching $5.82B, alongside a 41.3% increase in net income to $874M. Margins improved, with a gross margin of 32.6% and EBIT margin of 25.3%, both favorable. The latest year showed revenue growth of 6.2%, with net margin and EPS rising, reflecting strengthened profitability and operational efficiency.
Which one has the stronger fundamentals?
Evergy demonstrates stronger fundamentals with consistent favorable margin expansions and robust net income and EPS growth both over the long term and in the latest year. FirstEnergy, despite higher revenue and gross margins, faces declining net income and margins, leading to an unfavorable overall income statement evaluation compared to Evergy’s broadly favorable financial performance.
Financial Ratios Comparison
The table below compares key financial ratios for FirstEnergy Corp. and Evergy, Inc. based on their most recent fiscal year data from 2024.
| Ratios | FirstEnergy Corp. (FE) | Evergy, Inc. (EVRG) |
|---|---|---|
| ROE | 7.85% | 8.77% |
| ROIC | 3.66% | 4.52% |
| P/E | 23.39 | 16.23 |
| P/B | 1.84 | 1.42 |
| Current Ratio | 0.56 | 0.50 |
| Quick Ratio | 0.45 | 0.27 |
| D/E (Debt-to-Equity) | 1.95 | 1.41 |
| Debt-to-Assets | 46.6% | 43.6% |
| Interest Coverage | 2.35 | 2.57 |
| Asset Turnover | 0.26 | 0.18 |
| Fixed Asset Turnover | 0.33 | 0.23 |
| Payout Ratio | 99.2% | 68.3% |
| Dividend Yield | 4.24% | 4.21% |
Interpretation of the Ratios
FirstEnergy Corp.
FirstEnergy shows a mixed ratio profile with several unfavorable metrics including return on equity (7.85%), return on invested capital (3.66%), and liquidity ratios (current ratio 0.56, quick ratio 0.45), indicating potential operational and financial stress. Asset turnover ratios are weak, reflecting possible inefficiencies. The company offers a favorable dividend yield at 4.24%, supported by a stable payout, though risks remain from its high debt and lower profitability.
Evergy, Inc.
Evergy’s ratios reveal strengths such as a favorable net margin of 15%, a decent price-to-book ratio of 1.42, and a dividend yield near 4.21%, suggesting shareholder returns are positive. However, it also faces challenges with an unfavorable return on equity of 8.77%, and liquidity ratios below 1, which could constrain financial flexibility. The balance between favorable and unfavorable ratios points to moderate operational efficiency amid leverage concerns.
Which one has the best ratios?
Both FirstEnergy and Evergy present a similar percentage of unfavorable ratios (50%), but Evergy holds a higher proportion of favorable ratios (28.57% vs. 14.29%) and stronger profitability metrics like net margin. Despite liquidity and leverage concerns in both, Evergy’s overall ratio profile appears somewhat more balanced, although both companies carry risks that investors should monitor carefully.
Strategic Positioning
This section compares the strategic positioning of FirstEnergy Corp. and Evergy, Inc. regarding market position, key segments, and exposure to technological disruption:
FirstEnergy Corp.
- Large regulated electric utility with 6M customers in six states facing typical competitive pressure in US utilities.
- Focus on regulated distribution and transmission with diversified generation including coal, nuclear, hydro, gas, wind, and solar.
- Operates extensive overhead and underground transmission and distribution lines; no explicit mention of disruptive technology adoption.
Evergy, Inc.
- Regional regulated electric utility serving about 1.6M customers across Kansas and Missouri with moderate competition.
- Single main electric utility segment serving residential, commercial, and industrial clients with mixed generation sources.
- Maintains sizable transmission and distribution network; uses renewables alongside traditional sources without noted disruption threats.
FirstEnergy Corp. vs Evergy, Inc. Positioning
FirstEnergy has a broader geographic and customer base with diversified generation assets, including nuclear and coal, while Evergy concentrates regionally with a single utility segment. FirstEnergy’s scale offers breadth but with complexity, Evergy’s focus may allow operational specialization.
Which has the best competitive advantage?
Both companies are shedding value as ROIC remains below WACC; however, Evergy shows improving profitability trends, suggesting a slightly less unfavorable moat compared to FirstEnergy’s declining returns and very unfavorable moat.
Stock Comparison
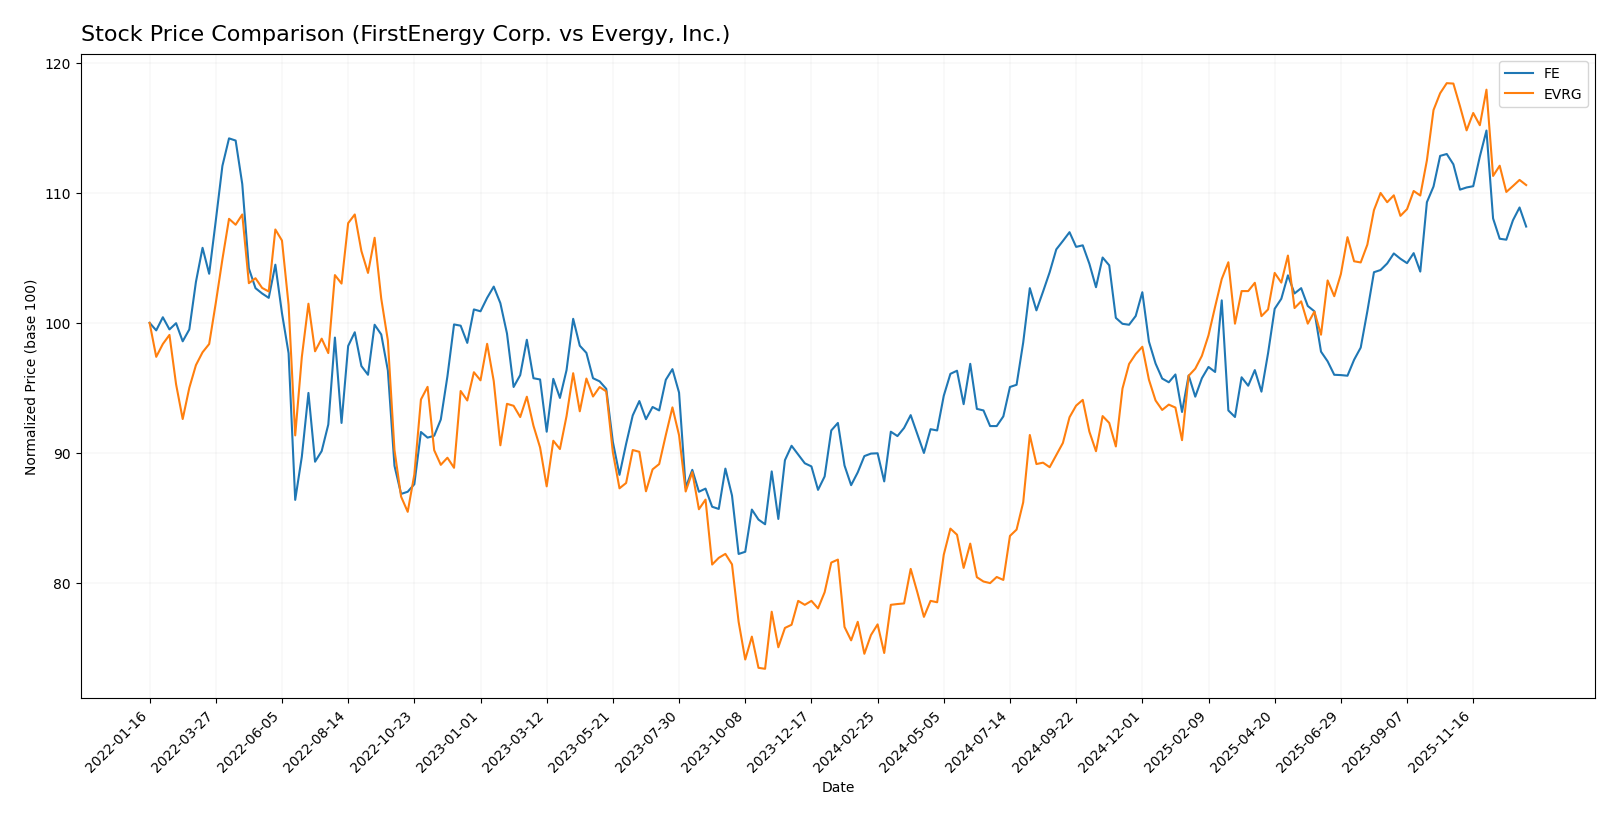
The stock prices of FirstEnergy Corp. and Evergy, Inc. over the past year show distinct bullish trends with notable deceleration, accompanied by recent declines reflecting a shift in short-term trading dynamics.
Trend Analysis
FirstEnergy Corp. (FE) exhibited a 19.42% price increase over the past 12 months, indicating a bullish trend with decelerating momentum. The stock ranged between 36.5 and 47.72, with a recent slight downtrend of -4.27%.
Evergy, Inc. (EVRG) showed a stronger bullish trend with a 45.55% gain over the same period but also with deceleration. Its price fluctuated between 49.12 and 77.98, followed by a recent sharper decline of -6.59%.
Comparing both stocks, Evergy delivered the highest market performance over the past year, outperforming FirstEnergy in total price appreciation despite more volatility and recent negative momentum.
Target Prices
Analysts present a clear consensus on target prices for FirstEnergy Corp. and Evergy, Inc.
| Company | Target High | Target Low | Consensus |
|---|---|---|---|
| FirstEnergy Corp. | 54 | 46 | 49.29 |
| Evergy, Inc. | 93 | 76 | 82.67 |
For FirstEnergy Corp., the consensus target price of 49.29 USD is about 10% above the current price of 44.65 USD, indicating moderate upside potential. Evergy’s consensus target price of 82.67 USD suggests roughly 13.5% upside from its current price of 72.82 USD.
Analyst Opinions Comparison
This section compares analysts’ ratings and grades for FirstEnergy Corp. and Evergy, Inc.:
Rating Comparison
FE Rating
- Rating: B, classified as Very Favorable overall.
- Discounted Cash Flow Score: 4, indicating Favorable.
- ROE Score: 4, considered Favorable.
- ROA Score: 3, Moderate rating.
- Debt To Equity Score: 1, Very Unfavorable (higher risk).
- Overall Score: 3, Moderate assessment.
EVRG Rating
- Rating: B-, also Very Favorable overall.
- Discounted Cash Flow Score: 1, indicating Very Unfavorable.
- ROE Score: 3, assessed as Moderate.
- ROA Score: 3, Moderate rating.
- Debt To Equity Score: 2, Moderate risk.
- Overall Score: 2, Moderate assessment.
Which one is the best rated?
Based strictly on the data, FirstEnergy holds a higher overall rating (B vs. B-) and stronger scores in discounted cash flow and return on equity. However, its debt to equity score indicates higher financial risk compared to Evergy.
Scores Comparison
Here is a comparison of the Altman Z-Score and Piotroski Score for both companies:
FE Scores
- Altman Z-Score: 0.78, indicating financial distress.
- Piotroski Score: 6, showing average financial health.
EVRG Scores
- Altman Z-Score: 0.82, indicating financial distress.
- Piotroski Score: 5, showing average financial health.
Which company has the best scores?
Both FE and EVRG fall in the distress zone for Altman Z-Score, with EVRG slightly higher. FE has a marginally better Piotroski Score (6 vs. 5), but both are classified as average. Overall, scores are close with slight differences in financial health indicators.
Grades Comparison
The following tables summarize the recent grades assigned to FirstEnergy Corp. and Evergy, Inc. by leading financial institutions:
FirstEnergy Corp. Grades
This table presents the latest rating actions by verified grading companies for FirstEnergy Corp.:
| Grading Company | Action | New Grade | Date |
|---|---|---|---|
| UBS | Maintain | Neutral | 2025-12-17 |
| Mizuho | Maintain | Neutral | 2025-10-24 |
| Scotiabank | Maintain | Sector Outperform | 2025-10-24 |
| UBS | Maintain | Neutral | 2025-10-24 |
| Morgan Stanley | Maintain | Overweight | 2025-10-21 |
| Jefferies | Maintain | Hold | 2025-10-21 |
| Keybanc | Downgrade | Sector Weight | 2025-10-15 |
| Scotiabank | Maintain | Sector Outperform | 2025-10-06 |
| Morgan Stanley | Maintain | Overweight | 2025-09-25 |
| Barclays | Upgrade | Overweight | 2025-08-25 |
The overall trend for FirstEnergy Corp. is stable with mostly neutral to overweight ratings, reflecting cautious but steady sentiment.
Evergy, Inc. Grades
Below is the latest rating data from reputable grading firms for Evergy, Inc.:
| Grading Company | Action | New Grade | Date |
|---|---|---|---|
| Mizuho | Downgrade | Neutral | 2025-12-18 |
| UBS | Maintain | Buy | 2025-12-17 |
| Citigroup | Maintain | Buy | 2025-11-10 |
| Jefferies | Maintain | Buy | 2025-10-09 |
| Mizuho | Maintain | Outperform | 2025-08-08 |
| Mizuho | Maintain | Outperform | 2025-07-18 |
| Barclays | Maintain | Overweight | 2025-05-30 |
| Citigroup | Maintain | Buy | 2025-05-16 |
| UBS | Upgrade | Buy | 2025-04-28 |
| Barclays | Maintain | Overweight | 2025-04-22 |
Evergy, Inc. shows a generally positive grade trend, with a majority of buy and outperform recommendations, despite a recent downgrade to neutral by Mizuho.
Which company has the best grades?
Evergy, Inc. holds a stronger consensus with more buy and outperform ratings compared to FirstEnergy Corp.’s neutral to hold grades. Investors may interpret Evergy’s higher-grade trend as reflecting greater confidence in its near-term prospects, while FirstEnergy’s steadier, neutral outlook suggests more cautious market expectations.
Strengths and Weaknesses
Below is a comparison of key strengths and weaknesses for FirstEnergy Corp. (FE) and Evergy, Inc. (EVRG) based on their financial performance, market position, and operational metrics.
| Criterion | FirstEnergy Corp. (FE) | Evergy, Inc. (EVRG) |
|---|---|---|
| Diversification | Moderate: Focused on regulated distribution and transmission segments with some unregulated revenues; limited product diversification. | Low: Primarily electric utility segment, limited diversification beyond core business. |
| Profitability | Moderate: Net margin 7.26% (neutral), ROIC 3.66% (unfavorable), declining ROIC trend, company shedding value. | Better: Net margin 15.0% (favorable), ROIC 4.52% (unfavorable) but improving ROIC trend, slightly unfavorable value creation. |
| Innovation | Limited visible innovation; traditional utility with stable but declining profitability. | Moderate innovation implied by improving profitability and stable dividend yield. |
| Global presence | Primarily US-regulated markets; no significant global footprint. | US-focused with no global operations; regional utility player. |
| Market Share | Large player in regulated distribution and transmission in US markets. | Smaller scale electric utility compared to FE but with steady operational metrics. |
Key takeaways: FirstEnergy shows challenges with declining profitability and limited diversification, while Evergy benefits from stronger margins and improving capital returns despite similar sector constraints. Investors should weigh FE’s scale against EVRG’s improving profitability and innovation potential. Both have risk factors typical of regulated utilities.
Risk Analysis
Below is a comparative table of key risks for FirstEnergy Corp. (FE) and Evergy, Inc. (EVRG) based on the latest 2024 data.
| Metric | FirstEnergy Corp. (FE) | Evergy, Inc. (EVRG) |
|---|---|---|
| Market Risk | Moderate; beta 0.63 indicates lower volatility | Moderate; beta 0.65 similar to FE |
| Debt level | High leverage; debt-to-equity ratio unfavorable (1.95) | High leverage; debt-to-equity ratio unfavorable (1.41) |
| Regulatory Risk | Significant due to regulated electric utility operations in multiple states | Similar regulatory exposure in Kansas and Missouri |
| Operational Risk | Diverse generation assets but aging infrastructure concerns | Diverse but smaller scale; infrastructure risks present |
| Environmental Risk | Exposure to coal and nuclear generation with transition risks | Exposure to fossil fuels; increasing renewable integration needed |
| Geopolitical Risk | Low; primarily US domestic operations | Low; primarily US domestic operations |
Both companies operate in regulated electric utilities, facing market risk moderated by low beta values. Their high debt levels pose notable financial risk, with FirstEnergy’s leverage slightly higher. Regulatory and environmental risks are significant due to reliance on fossil fuels and nuclear assets amid energy transition pressures. Operational risks include aging infrastructure. Geopolitical risks remain low, confined mostly to US market dynamics. The most impactful risks are financial leverage and regulatory shifts affecting future earnings and compliance costs.
Which Stock to Choose?
FirstEnergy Corp. (FE) shows a mixed income evolution with favorable gross and EBIT margins but declining net margin and EPS growth over 2020-2024. Its financial ratios are slightly unfavorable overall, marked by weak liquidity and high debt, though dividend yield is favorable. The company’s rating is very favorable (B), but its value creation metrics indicate it is shedding value with declining profitability.
Evergy, Inc. (EVRG) demonstrates a favorable income statement with strong growth in net income, EPS, and net margin, supported by robust EBIT margins. Its financial ratios are slightly unfavorable but with more favorable aspects than FE, including better net margin and valuation multiples. The rating is very favorable (B-), while its value creation shows slight value destruction but improving profitability over time.
Investors focused on growth and income quality might find Evergy’s improving profitability and stronger income growth more appealing, while those valuing a higher rating and dividend yield could see FirstEnergy as potentially suitable. Risk-averse investors may weigh the stronger balance sheet concerns and value creation trends before forming an opinion.
Disclaimer: Investment carries a risk of loss of initial capital. The past performance is not a reliable indicator of future results. Be sure to understand risks before making an investment decision.
Go Further
I encourage you to read the complete analyses of FirstEnergy Corp. and Evergy, Inc. to enhance your investment decisions: