Home > Comparison > Technology > AVGO vs NXPI
The competitive dynamic between Broadcom Inc. and NXP Semiconductors shapes the semiconductor industry’s evolution. Broadcom operates as a diversified technology giant with broad infrastructure and communications hardware. NXP focuses on specialized microcontrollers and connectivity solutions, emphasizing automotive and IoT applications. This analysis pits Broadcom’s scale and integration against NXP’s targeted innovation to identify which offers superior risk-adjusted returns in a volatile tech landscape.
Table of contents
Companies Overview
Broadcom and NXP Semiconductors anchor key segments of the global semiconductor industry, driving innovation and infrastructure.
Broadcom Inc.: Global Semiconductor Solutions Leader
Broadcom dominates with a diverse semiconductor and infrastructure software portfolio. Its revenue stems from four segments: wired infrastructure, wireless communications, enterprise storage, and industrial applications. In 2026, Broadcom’s strategic focus sharpens on integrated solutions powering data centers, telecommunications, and industrial automation, leveraging firmware and hardware synergy to strengthen its competitive moat.
NXP Semiconductors N.V.: Specialty Semiconductor Innovator
NXP excels in specialized semiconductor products spanning microcontrollers, application processors, wireless connectivity, and sensors. It generates income by supplying automotive, industrial, IoT, and mobile markets worldwide. In 2026, NXP emphasizes expanding its secure connectivity and sensor technologies, targeting growth in automotive electrification and industrial IoT, capitalizing on its broad geographic footprint.
Strategic Collision: Similarities & Divergences
Broadcom pursues a broad, integrated product ecosystem, while NXP focuses on specialized components with an emphasis on security and connectivity. They clash primarily in wireless and industrial semiconductor segments. Broadcom’s scale and software integration contrast with NXP’s niche innovation, creating distinct investment profiles: Broadcom offers diversified resilience, while NXP presents targeted growth potential amid evolving tech demands.
Income Statement Comparison
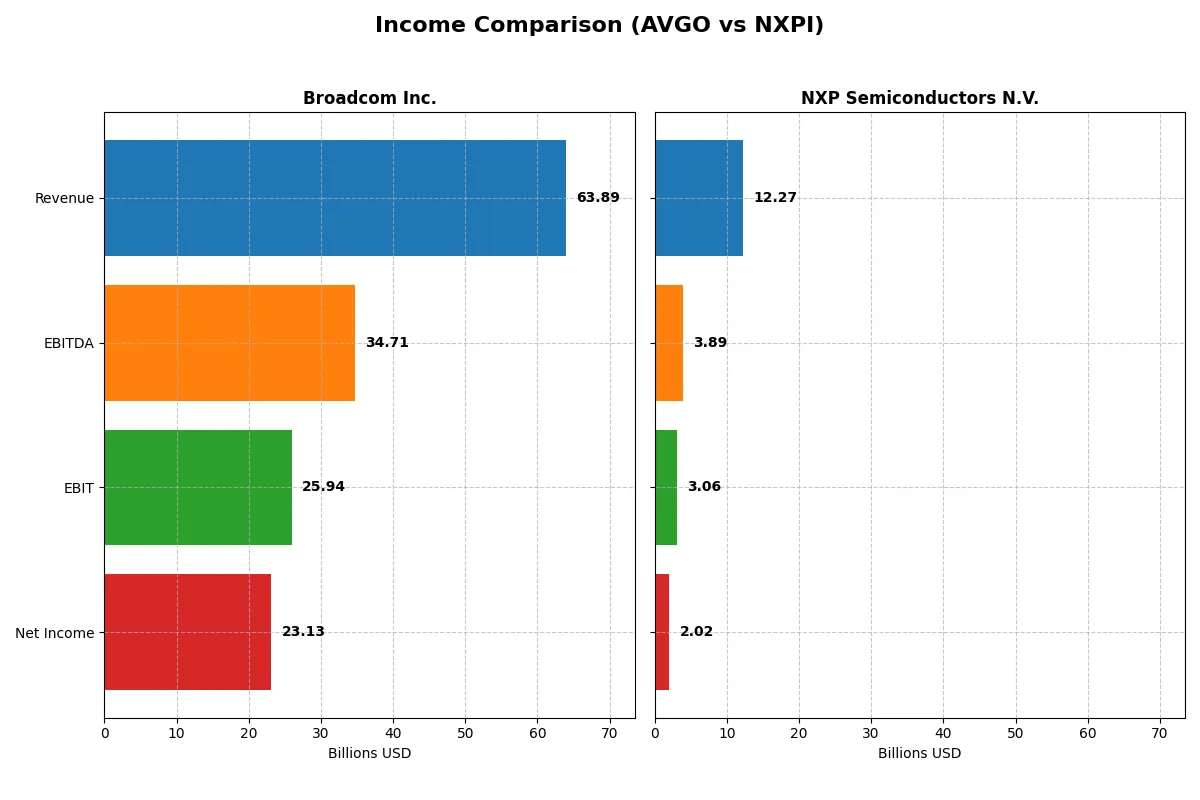
This data dissects the core profitability and scalability of both corporate engines to reveal who dominates the bottom line:
| Metric | Broadcom Inc. (AVGO) | NXP Semiconductors N.V. (NXPI) |
|---|---|---|
| Revenue | 63.9B | 12.3B |
| Cost of Revenue | 20.6B | 5.6B |
| Operating Expenses | 17.8B | 3.4B |
| Gross Profit | 43.3B | 6.7B |
| EBITDA | 34.7B | 3.9B |
| EBIT | 25.9B | 3.1B |
| Interest Expense | 3.2B | 384M |
| Net Income | 23.1B | 2.0B |
| EPS | 4.91 | 8.00 |
| Fiscal Year | 2025 | 2025 |
Income Statement Analysis: The Bottom-Line Duel
This income statement comparison reveals how efficiently Broadcom Inc. and NXP Semiconductors convert revenue into profit over recent years.
Broadcom Inc. Analysis
Broadcom’s revenue surged from $27.5B in 2021 to $63.9B in 2025, with net income soaring from $6.4B to $23.1B. Its gross margin stands at a robust 67.8%, while net margin reached 36.2% in 2025. The company’s profitability accelerated sharply in 2025, reflecting strong operational leverage and margin expansion.
NXP Semiconductors N.V. Analysis
NXP’s revenue grew modestly from $11.1B in 2021 to $12.3B in 2025 but declined slightly in the last year. Net income rose from $1.9B to $2.0B, with a gross margin of 54.4% and net margin at 16.5% in 2025. Recent declines in revenue and earnings signal headwinds, despite maintaining a solid margin profile.
Margin Dominance vs. Revenue Momentum
Broadcom leads with superior revenue growth and expanding net margins, outperforming NXP’s more modest gains and recent declines. Its scale and margin efficiency make it the clear fundamental winner. Investors seeking growth and profit expansion will find Broadcom’s profile more compelling.
Financial Ratios Comparison
These vital ratios act as a diagnostic tool to expose the underlying fiscal health, valuation premiums, and capital efficiency of the companies compared below:
| Ratios | Broadcom Inc. (AVGO) | NXP Semiconductors N.V. (NXPI) |
|---|---|---|
| ROE | 28.4% | 20.1% |
| ROIC | 16.4% | 11.0% |
| P/E | 73.9x | 27.1x |
| P/B | 21.0x | 5.45x |
| Current Ratio | 1.71 | 2.05 |
| Quick Ratio | 1.58 | 1.38 |
| D/E (Debt-to-Equity) | 0.80 | 1.22 |
| Debt-to-Assets | 38.1% | 46.0% |
| Interest Coverage | 7.94x | 8.62x |
| Asset Turnover | 0.37 | 0.46 |
| Fixed Asset Turnover | 25.3 | 4.12 |
| Payout Ratio | 48.2% | 50.7% |
| Dividend Yield | 0.65% | 1.87% |
| Fiscal Year | 2025 | 2025 |
Efficiency & Valuation Duel: The Vital Signs
Financial ratios act as a company’s DNA, exposing hidden risks and operational excellence that drive investment decisions.
Broadcom Inc.
Broadcom delivers strong profitability with a 28.45% ROE and 36.2% net margin, demonstrating operational efficiency. However, its valuation appears stretched, with a P/E of 73.87 and a P/B of 21.01. The company returns modest dividends at 0.65%, favoring reinvestment in R&D for sustained growth.
NXP Semiconductors N.V.
NXP shows solid profitability, with a 20.1% ROE and 16.47% net margin, maintaining efficiency but at a more moderate level. Its valuation is lower than Broadcom’s, with a P/E of 27.14 and P/B of 5.45, though still considered elevated. NXP pays a 1.87% dividend, balancing shareholder returns with growth investments.
Premium Valuation vs. Operational Safety
Broadcom carries a premium valuation reflecting its superior profitability but at higher risk of overvaluation. NXP offers a more balanced valuation with respectable returns and dividend yield. Investors seeking growth with operational strength may prefer Broadcom, while those favoring moderate valuation and income might lean toward NXP.
Which one offers the Superior Shareholder Reward?
Broadcom offers a lower dividend yield (~0.65%) but maintains a robust payout ratio near 48%, supported by strong free cash flow (5.7/share). Its share buybacks remain aggressive, amplifying total returns. NXP yields about 1.87% with a lower payout ratio (~51%), but its higher capex (1.57/share) tempers free cash flow. Both maintain buybacks, yet Broadcom’s distribution model is more sustainable and shareholder-focused in 2026. I conclude Broadcom delivers superior total shareholder rewards through balanced dividends and disciplined buybacks, outperforming NXP’s growth-reinvestment trade-off.
Comparative Score Analysis: The Strategic Profile
The radar chart reveals the fundamental DNA and trade-offs of Broadcom Inc. and NXP Semiconductors N.V., highlighting their financial strengths and valuation positions:
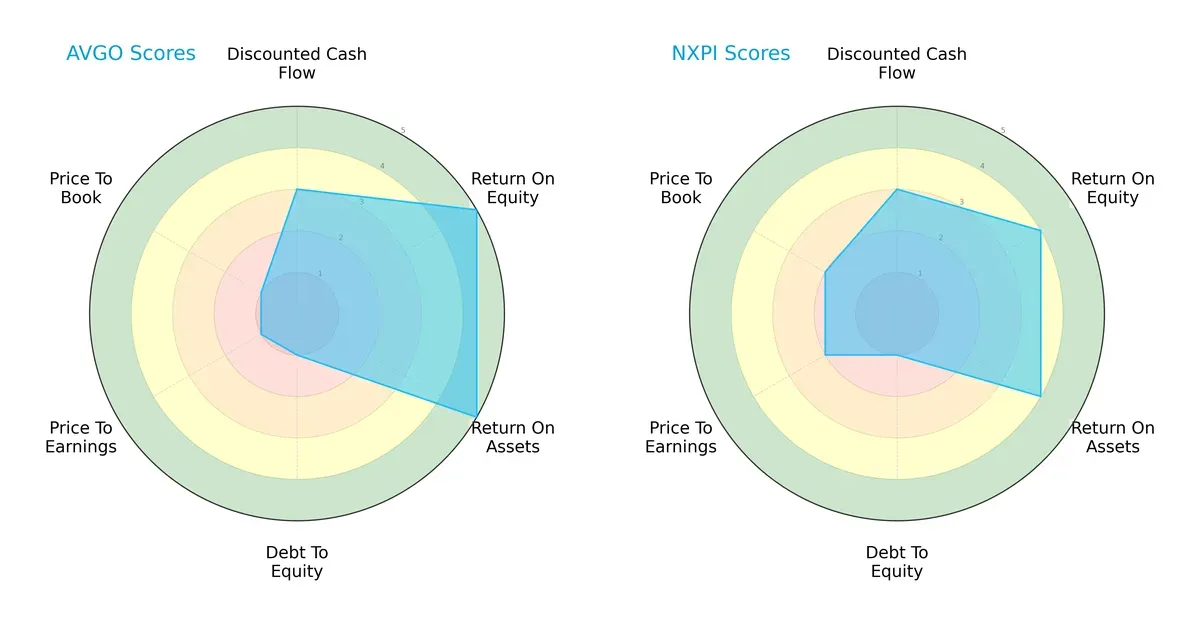
Broadcom leads on profitability with top ROE and ROA scores, showing operational efficiency. NXP trails slightly but maintains a more balanced valuation with better P/E and P/B scores. Both share a weak debt-to-equity profile, signaling leverage risks. Broadcom depends heavily on operational excellence; NXP offers a steadier valuation appeal.
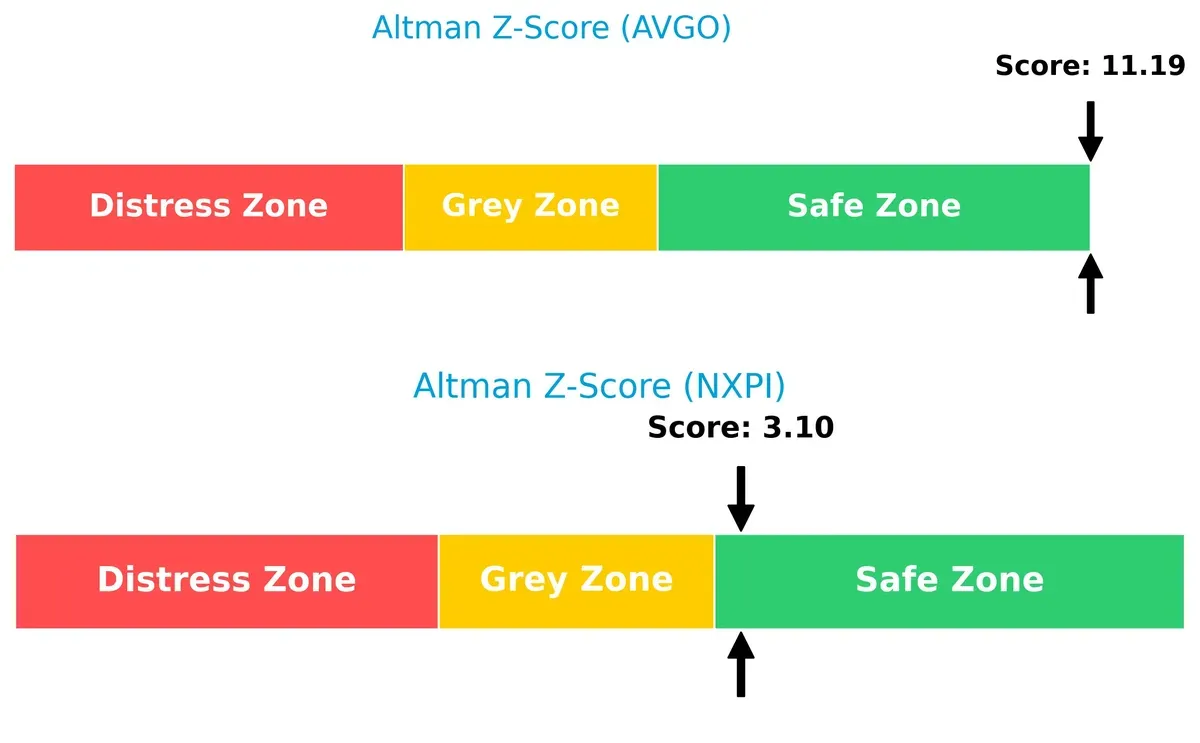
Bankruptcy Risk: Solvency Showdown
Broadcom’s Altman Z-Score of 11.2 vastly exceeds NXP’s 3.1, signaling stronger long-term solvency and lower bankruptcy risk in this cycle:
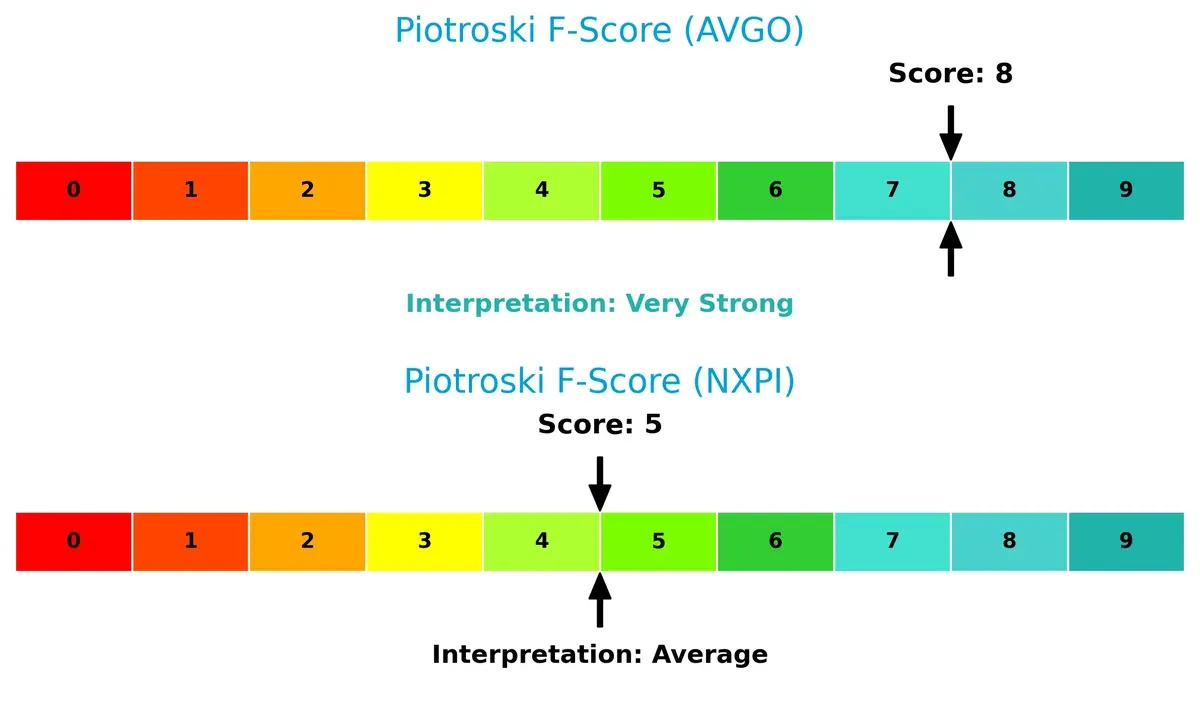
Financial Health: Quality of Operations
Broadcom’s Piotroski F-Score of 8 reflects very strong financial health, while NXP’s 5 indicates only average operational quality, raising caution on internal metrics:
How are the two companies positioned?
This section dissects Broadcom and NXP’s operational DNA by comparing their revenue distribution and internal dynamics. The goal is to confront their economic moats, identifying which model offers the most resilient, sustainable competitive advantage today.
Revenue Segmentation: The Strategic Mix
This visual comparison dissects how Broadcom Inc. and NXP Semiconductors diversify their income streams and where their primary sector bets lie:
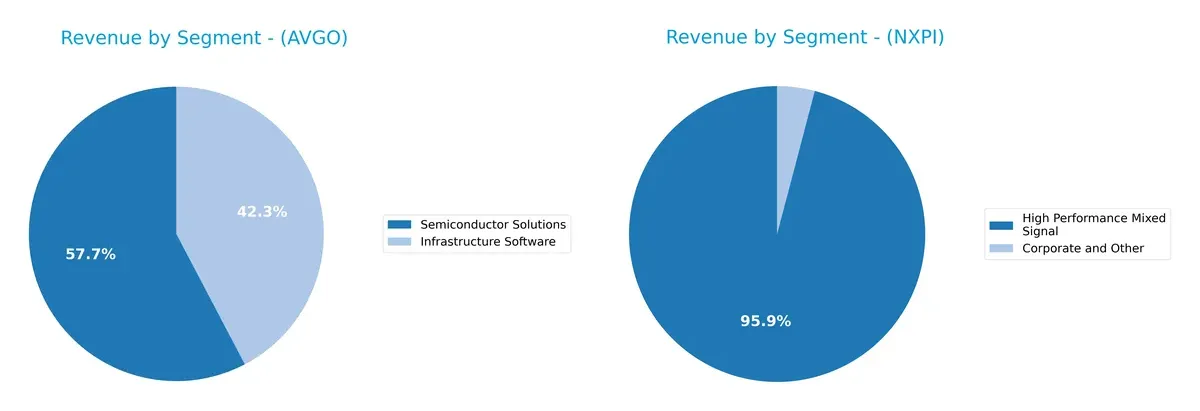
Broadcom anchors its revenue in two major segments: Semiconductor Solutions at $36.9B and Infrastructure Software at $27.0B in 2025. This balanced concentration suggests a robust ecosystem lock-in across hardware and software. Conversely, NXP leans heavily on High Performance Mixed Signal, with limited diversification and smaller scale revenues below $10B. Broadcom’s dual-segment dominance reduces concentration risk, while NXP’s focus reveals exposure to sector cyclicality and narrower market scope.
Strengths and Weaknesses Comparison
The table compares the Strengths and Weaknesses of Broadcom Inc. and NXP Semiconductors N.V.:
Broadcom Inc. Strengths
- High net margin at 36.2%
- Strong ROE at 28.45%
- Favorable ROIC at 16.36%
- Balanced current and quick ratios above 1.5
- Large revenue from diverse segments
- Significant Asia Pacific presence at 36B
NXP Semiconductors N.V. Strengths
- Solid net margin at 16.47%
- Good ROE at 20.1%
- Favorable ROIC at 11.03%
- Strong current ratio at 2.05
- Growing geographic footprint including China and Europe
- Balanced product revenue with High Performance Mixed Signal leadership
Broadcom Inc. Weaknesses
- High P/E ratio at 73.87 signals valuation risk
- Elevated PB ratio at 21.01
- Asset turnover low at 0.37
- Moderate debt-to-equity at 0.8
- Low dividend yield at 0.65%
- Market concentration in Semiconductor Solutions segment
NXP Semiconductors N.V. Weaknesses
- P/E ratio at 27.14 remains elevated
- Debt-to-equity high at 1.22 raises leverage concerns
- Asset turnover low at 0.46
- Below-industry dividend yield neutrality
- Smaller Americas revenue compared to Asia Pacific focus
- Standard Products segment minimal
Broadcom demonstrates robust profitability metrics and a strong Asian market presence, yet faces valuation and asset utilization challenges. NXP maintains healthy returns and a broad geographic reach but carries higher leverage and valuation pressures. Both companies show slightly favorable financial profiles with distinct strategic focuses.
The Moat Duel: Analyzing Competitive Defensibility
A structural moat is the only reliable barrier protecting long-term profits from relentless competitive erosion in the semiconductor industry:
Broadcom Inc.: Dominant Cost Advantage with Scale Economies
Broadcom’s moat stems from a powerful cost advantage fueled by scale and integration. Its 67.8% gross margin and 40.6% EBIT margin reflect operational dominance. In 2026, expanding infrastructure and wireless segments should deepen this moat.
NXP Semiconductors N.V.: Specialized Product Intangibles
NXP relies on proprietary microcontrollers and connectivity solutions, differentiating from Broadcom’s cost leadership. However, a narrower 54.4% gross margin and declining ROIC signal vulnerability. NXP’s future hinges on IoT and automotive markets to reverse margin pressures.
Cost Leadership vs. Product Specialization: The Moat Showdown
Broadcom’s wider and growing moat, demonstrated by a 7% ROIC premium over WACC, outpaces NXP’s shrinking value creation and negative ROIC trend. Broadcom stands better poised to defend and expand market share amid intensifying competition.
Which stock offers better returns?
The past year reveals starkly different trajectories: Broadcom’s stock surged sharply before recent pullback, while NXP’s price declined overall but showed a recent rebound.
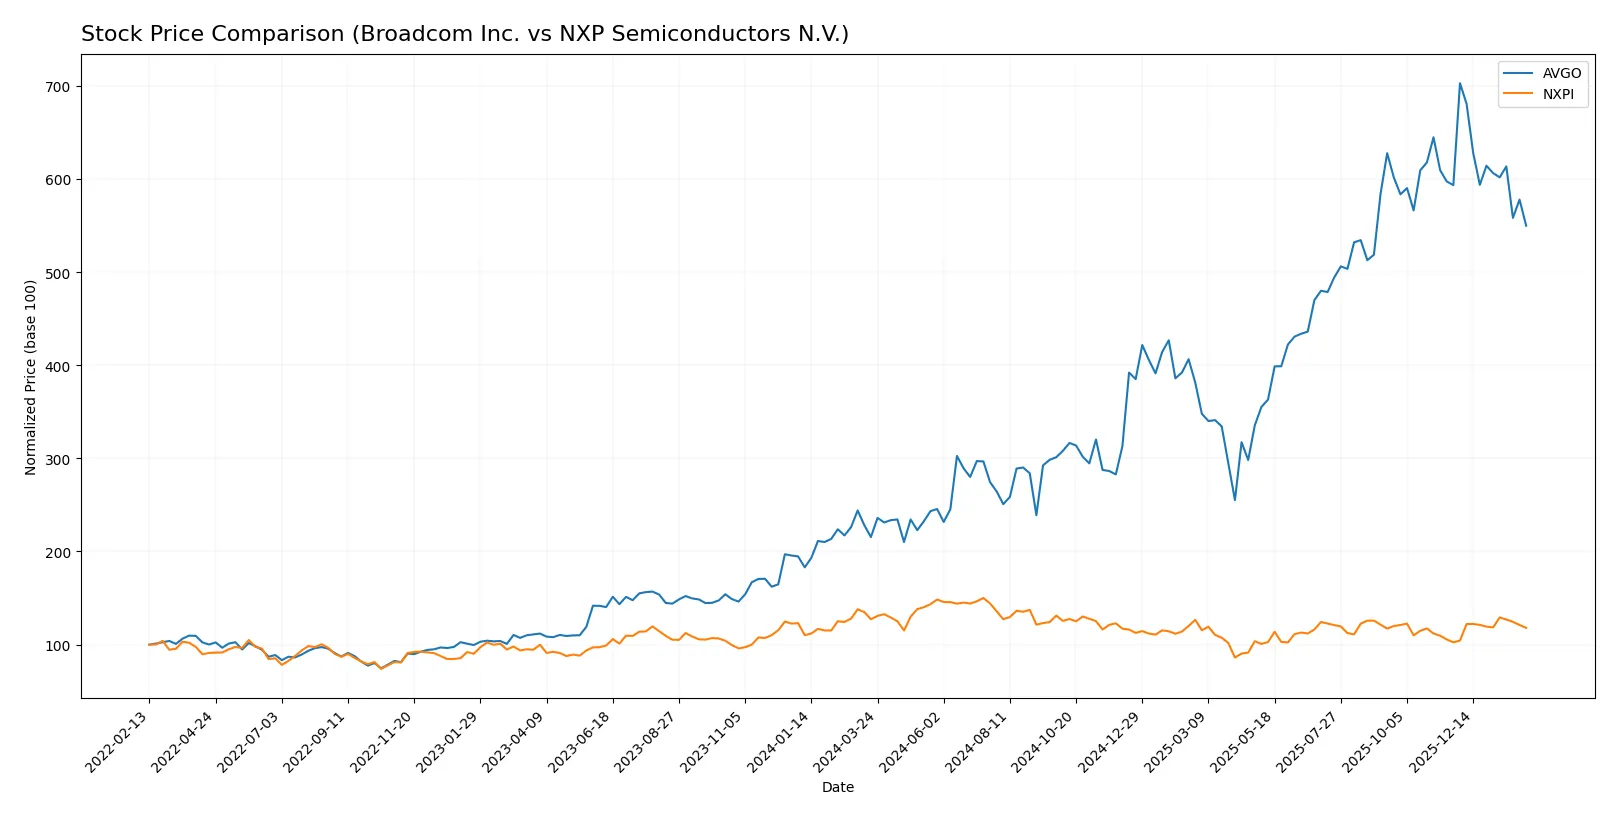
Trend Comparison
Broadcom Inc. (AVGO) posted a strong 155.14% gain over the past 12 months, signaling a bullish trend with deceleration. The stock peaked at 402.96 and troughed at 120.47, showing high volatility (78.83 std dev). Recent months saw a 7.34% decline indicating short-term weakness.
NXP Semiconductors N.V. (NXPI) experienced a 7.27% loss over 12 months, marking a bearish trend but with accelerating momentum. The price ranged between 160.81 and 280.19, with moderate volatility (24.1 std dev). Recently, it gained 15.11%, suggesting a short-term recovery.
Broadcom’s overall performance vastly outpaced NXP’s despite recent softness. Broadcom remains the stronger market performer by a wide margin over the year.
Target Prices
Analysts present a bullish consensus for Broadcom Inc. and NXP Semiconductors N.V., anticipating notable upside from current levels.
| Company | Target Low | Target High | Consensus |
|---|---|---|---|
| Broadcom Inc. | 370 | 510 | 450.12 |
| NXP Semiconductors | 215 | 280 | 250 |
The target consensus for Broadcom at 450 implies a 44% premium over its $313 price, signaling strong growth expectations. NXP’s consensus near 250 suggests roughly 13% upside, reflecting cautious optimism in semiconductor demand.

Don’t Let Luck Decide Your Entry Point
Optimize your entry points with our advanced ProRealTime indicators. You’ll get efficient buy signals with precise price targets for maximum performance. Start outperforming now!
How do institutions grade them?
The following tables summarize recent institutional grades for Broadcom Inc. and NXP Semiconductors N.V.:
Broadcom Inc. Grades
This table presents recent grades assigned by recognized financial institutions to Broadcom Inc.:
| Grading Company | Action | New Grade | Date |
|---|---|---|---|
| Wells Fargo | Upgrade | Overweight | 2026-01-15 |
| Mizuho | Maintain | Outperform | 2026-01-09 |
| Truist Securities | Maintain | Buy | 2025-12-19 |
| UBS | Maintain | Buy | 2025-12-15 |
| TD Cowen | Maintain | Buy | 2025-12-12 |
| Piper Sandler | Maintain | Overweight | 2025-12-12 |
| Oppenheimer | Maintain | Outperform | 2025-12-12 |
| Keybanc | Maintain | Overweight | 2025-12-12 |
| Barclays | Maintain | Overweight | 2025-12-12 |
| Citigroup | Maintain | Buy | 2025-12-12 |
NXP Semiconductors N.V. Grades
This table shows the latest grades from established institutions for NXP Semiconductors N.V.:
| Grading Company | Action | New Grade | Date |
|---|---|---|---|
| Truist Securities | Maintain | Buy | 2026-02-04 |
| Mizuho | Maintain | Outperform | 2026-02-04 |
| B of A Securities | Maintain | Buy | 2026-02-04 |
| JP Morgan | Maintain | Neutral | 2026-02-04 |
| Evercore ISI Group | Maintain | Outperform | 2026-02-04 |
| Citigroup | Maintain | Buy | 2026-02-04 |
| Needham | Maintain | Buy | 2026-02-03 |
| Wells Fargo | Maintain | Overweight | 2026-01-15 |
| Citigroup | Maintain | Buy | 2026-01-15 |
| Truist Securities | Maintain | Buy | 2025-12-19 |
Which company has the best grades?
Broadcom Inc. consistently receives “Buy,” “Outperform,” and “Overweight” ratings, including a recent upgrade by Wells Fargo. NXP Semiconductors shows a strong buy consensus but includes a neutral rating from JP Morgan. Broadcom’s grades appear slightly stronger, potentially signaling greater institutional confidence.
Risks specific to each company
The following categories identify critical pressure points and systemic threats facing Broadcom Inc. and NXP Semiconductors N.V. in the 2026 market environment:
1. Market & Competition
Broadcom Inc.
- Commands a $1.48T market cap with a diversified product portfolio across wired, wireless, and industrial segments.
- Faces intense competition from diversified semiconductor giants and specialists in IoT and automotive sectors.
NXP Semiconductors N.V.
- Holds a $55.4B market cap focused on automotive, industrial, and IoT semiconductor markets.
- Competes heavily in automotive and IoT chips, sectors vulnerable to rapid technological shifts.
2. Capital Structure & Debt
Broadcom Inc.
- Debt-to-equity at 0.8 signals moderate leverage; interest coverage ratio of 8.08 reflects healthy debt servicing.
- Maintains a current ratio of 1.71, indicating solid short-term liquidity.
NXP Semiconductors N.V.
- Higher debt-to-equity at 1.22 raises financial risk despite a strong interest coverage of 7.97.
- Current ratio at 2.05 suggests better short-term liquidity but higher reliance on debt.
3. Stock Volatility
Broadcom Inc.
- Beta of 1.221 implies moderate volatility, slightly above market average.
- Trading range wide between $138.1 and $414.61, reflecting market sentiment swings.
NXP Semiconductors N.V.
- Higher beta of 1.458 indicates greater stock price sensitivity and risk.
- Narrower range from $148.09 to $255.45, yet downward recent price momentum signals caution.
4. Regulatory & Legal
Broadcom Inc.
- U.S.-based subject to strict tech export controls and IP regulations; litigation risk moderate.
- Faces potential antitrust scrutiny amid tech sector consolidation.
NXP Semiconductors N.V.
- EU and global presence expose it to complex regulatory frameworks and evolving data security laws.
- Must navigate increasing EU regulatory oversight on chip supply chains and data privacy.
5. Supply Chain & Operations
Broadcom Inc.
- Global supply chain exposed to geopolitical tensions and semiconductor material shortages.
- Asset turnover low at 0.37, suggesting room for operational efficiency improvements.
NXP Semiconductors N.V.
- Operations span multiple continents, increasing complexity and vulnerability to regional disruptions.
- Slightly better asset turnover at 0.46, but still below industry leaders.
6. ESG & Climate Transition
Broadcom Inc.
- Investing in alternative energy systems aligns with climate goals but increases capex risk.
- ESG risks include supply chain sustainability and carbon footprint in manufacturing.
NXP Semiconductors N.V.
- Focus on environmental sensors positions it well for climate-related markets but demands innovation.
- Faces challenges meeting aggressive EU ESG standards and investor expectations.
7. Geopolitical Exposure
Broadcom Inc.
- U.S. headquarters face rising risks from U.S.-China tech tensions affecting market access.
- Supply chain disruptions from geopolitical conflicts could impact production and sales.
NXP Semiconductors N.V.
- Dutch base and global footprint add exposure to EU-China trade uncertainties and sanctions.
- Similarly vulnerable to trade restrictions and export controls in key markets like China.
Which company shows a better risk-adjusted profile?
Broadcom’s most impactful risk is potential overvaluation, reflected in high P/E (73.87) and P/B (21.01) ratios, despite strong profitability and liquidity. NXP’s greatest risk lies in elevated leverage, with a debt-to-equity ratio of 1.22 raising solvency concerns. Both show solid financial health per Altman Z-Scores, but Broadcom’s safer liquidity and lower leverage yield a better risk-adjusted profile. The wider stock volatility and recent price decline in NXP signal heightened market uncertainty, justifying investor caution.
Final Verdict: Which stock to choose?
Broadcom Inc. (AVGO) stands out as a cash machine with a robust and growing competitive moat. Its ability to generate consistently high returns on invested capital reflects operational mastery. The main point of vigilance is its steep valuation multiples, which could pressure future returns. It suits an aggressive growth portfolio willing to pay for quality.
NXP Semiconductors N.V. (NXPI) benefits from a strategic moat grounded in specialized semiconductor niches and recurring revenue streams. It offers a safer profile with a healthier current ratio but shows signs of declining profitability and value creation. NXPI fits a GARP (Growth at a Reasonable Price) portfolio balancing upside with measured risk.
If you prioritize enduring value creation and can tolerate premium valuations, Broadcom outshines as the compelling choice due to its expanding moat and superior profitability. However, if you seek better stability and a moderate entry point, NXP offers a more conservative profile despite its current profitability challenges.
Disclaimer: Investment carries a risk of loss of initial capital. The past performance is not a reliable indicator of future results. Be sure to understand risks before making an investment decision.
Go Further
I encourage you to read the complete analyses of Broadcom Inc. and NXP Semiconductors N.V. to enhance your investment decisions: