In the dynamic technology sector, EPAM Systems, Inc. and ServiceTitan, Inc. stand out as innovative players with distinct approaches to software and digital services. EPAM excels in comprehensive digital platform engineering, while ServiceTitan focuses on specialized field service software for residential and commercial infrastructure. This comparison highlights their market overlap and innovation strategies to help you identify which company could be the smarter addition to your investment portfolio. Let’s explore which offers the best potential for investors today.
Table of contents
Companies Overview
I will begin the comparison between EPAM Systems and ServiceTitan by providing an overview of these two companies and their main differences.
EPAM Overview
EPAM Systems, Inc. specializes in digital platform engineering and software development services globally. It offers a broad range of engineering, infrastructure management, and maintenance services, alongside business and technology consulting. EPAM serves diverse industries including financial services, healthcare, and software, employing over 61K staff and holding a market cap of approximately 11.1B USD.
ServiceTitan Overview
ServiceTitan, Inc. focuses on software solutions for field service operations related to installation, maintenance, and servicing of residential and commercial infrastructure. Founded in 2008 and headquartered in Glendale, CA, it operates within the software application industry with a workforce of about 3K employees. Its market cap stands near 9.5B USD, reflecting its recent IPO in late 2024.
Key similarities and differences
Both companies operate in the technology sector but differ in their core offerings and scale. EPAM provides comprehensive IT services and consulting across multiple industries, whereas ServiceTitan targets software for field service management in building infrastructure. EPAM’s larger employee base and global reach contrast with ServiceTitan’s more specialized software application focus and smaller team size.
Income Statement Comparison
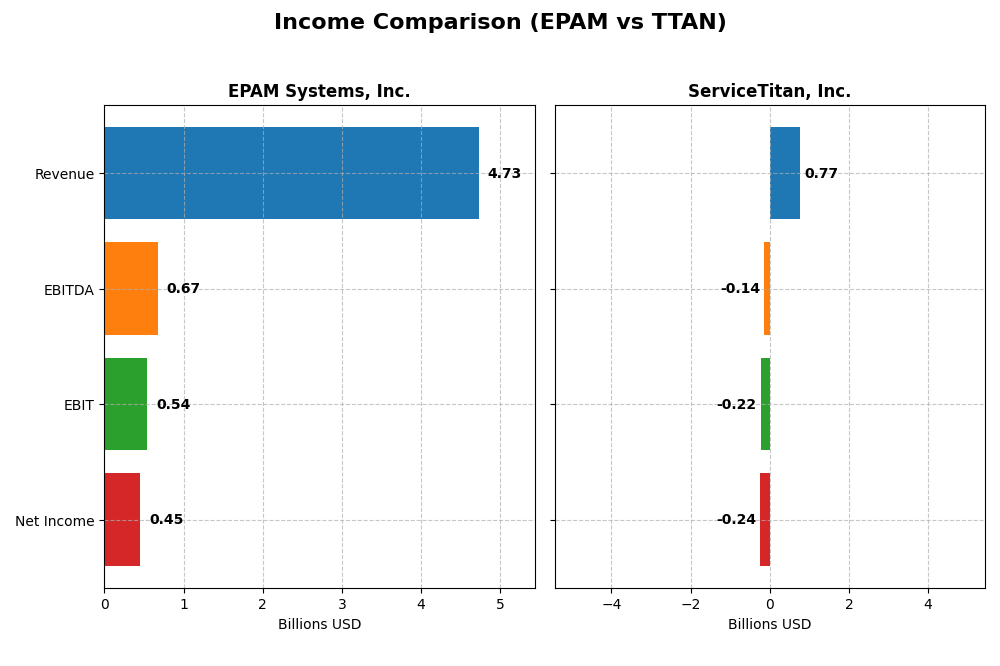
Below is the latest fiscal year income statement comparison for EPAM Systems, Inc. and ServiceTitan, Inc., highlighting key financial metrics.
| Metric | EPAM Systems, Inc. | ServiceTitan, Inc. |
|---|---|---|
| Market Cap | 11.1B | 9.5B |
| Revenue | 4.73B | 772M |
| EBITDA | 672M | -141M |
| EBIT | 545M | -221M |
| Net Income | 455M | -239M |
| EPS | 7.93 | -8.53 |
| Fiscal Year | 2024 | 2025 |
Income Statement Interpretations
EPAM Systems, Inc.
EPAM’s revenue rose steadily by 77.78% from 2020 to 2024, reaching $4.73B in 2024, with net income growing 38.93% over the period to $455M. Margins remain solid, with a gross margin of 30.68% and net margin of 9.61%. The 2024 year showed slight revenue growth of 0.8%, margin improvements, and an 11.05% EPS increase, signaling stable profitability.
ServiceTitan, Inc.
ServiceTitan’s revenue grew 65.02% from 2023 to 2025, reaching $772M in 2025, with net income improving 11.29% overall but remaining negative at -$239M. Gross margin is strong at 64.9%, but EBIT margin is deeply negative at -28.67%. The 2025 fiscal year saw 25.64% revenue growth but worsening EBIT and EPS, reflecting ongoing operating losses despite top-line expansion.
Which one has the stronger fundamentals?
EPAM demonstrates stronger fundamentals with consistent profitability, positive net margins, and stable earnings growth over a longer period. ServiceTitan, while showing rapid revenue growth and high gross margins, continues to report substantial operating losses and negative net income. EPAM’s more balanced margin profile and sustained net income gains suggest a more mature income statement performance.
Financial Ratios Comparison
The table below presents a side-by-side comparison of key financial ratios for EPAM Systems, Inc. and ServiceTitan, Inc., based on their most recent fiscal year data.
| Ratios | EPAM Systems, Inc. (2024) | ServiceTitan, Inc. (2025) |
|---|---|---|
| ROE | 12.52% | -16.44% |
| ROIC | 10.67% | -14.25% |
| P/E | 29.47 | -18.12 |
| P/B | 3.69 | 2.98 |
| Current Ratio | 2.96 | 3.74 |
| Quick Ratio | 2.96 | 3.74 |
| D/E (Debt-to-Equity Ratio) | 0.045 | 0.114 |
| Debt-to-Assets | 3.44% | 9.35% |
| Interest Coverage | 0 | -14.82 |
| Asset Turnover | 0.995 | 0.436 |
| Fixed Asset Turnover | 14.07 | 9.57 |
| Payout Ratio | 0 | 0 |
| Dividend Yield | 0 | 0 |
Interpretation of the Ratios
EPAM Systems, Inc.
EPAM’s ratios show a mixed picture with several favorable metrics including a strong current ratio of 2.96 and low debt-to-equity of 0.04, indicating good liquidity and low leverage. However, valuation ratios like P/E at 29.47 and P/B at 3.69 are unfavorable, suggesting the stock may be overvalued. The company does not pay dividends, likely reflecting a reinvestment strategy in its growth and operations.
ServiceTitan, Inc.
ServiceTitan’s ratios are generally weak, with negative net margin (-30.98%) and return on equity (-16.44%), signaling operational and profitability challenges. Its interest coverage ratio is negative, indicating difficulty covering interest expenses. Like EPAM, it pays no dividends, consistent with its high-growth phase and focus on R&D and acquisitions to support expansion.
Which one has the best ratios?
EPAM’s financial ratios are slightly more favorable overall, with better liquidity, leverage, and some profitability metrics compared to ServiceTitan’s predominantly negative profitability and coverage ratios. While both companies face challenges, EPAM demonstrates stronger operational stability, whereas ServiceTitan’s ratios reflect ongoing growth investments and financial strain.
Strategic Positioning
This section compares the strategic positioning of EPAM and TTAN, focusing on Market position, Key segments, and Exposure to technological disruption:
EPAM
- Leading in IT services with significant market cap of 11B; faces competitive pressure in tech.
- Diversified revenue streams across financial, healthcare, retail, media, and tech sectors.
- Offers broad digital engineering services; exposed to shifts in software and platform tech.
TTAN
- Software application niche with 9.5B market cap; operates in a competitive SaaS industry.
- Concentrated on field service software, mainly subscription and platform revenues.
- Focuses on infrastructure service software; less exposed to broad tech disruption.
EPAM vs TTAN Positioning
EPAM adopts a diversified approach across multiple industry verticals, spreading business risk but facing broad competitive pressures. TTAN concentrates on a specific software niche, potentially allowing focused innovation but risking dependency on a narrower market.
Which has the best competitive advantage?
Both companies are shedding value as their ROIC falls below WACC. EPAM shows declining profitability, while TTAN maintains stable but unfavorable returns, indicating neither currently holds a strong economic moat.
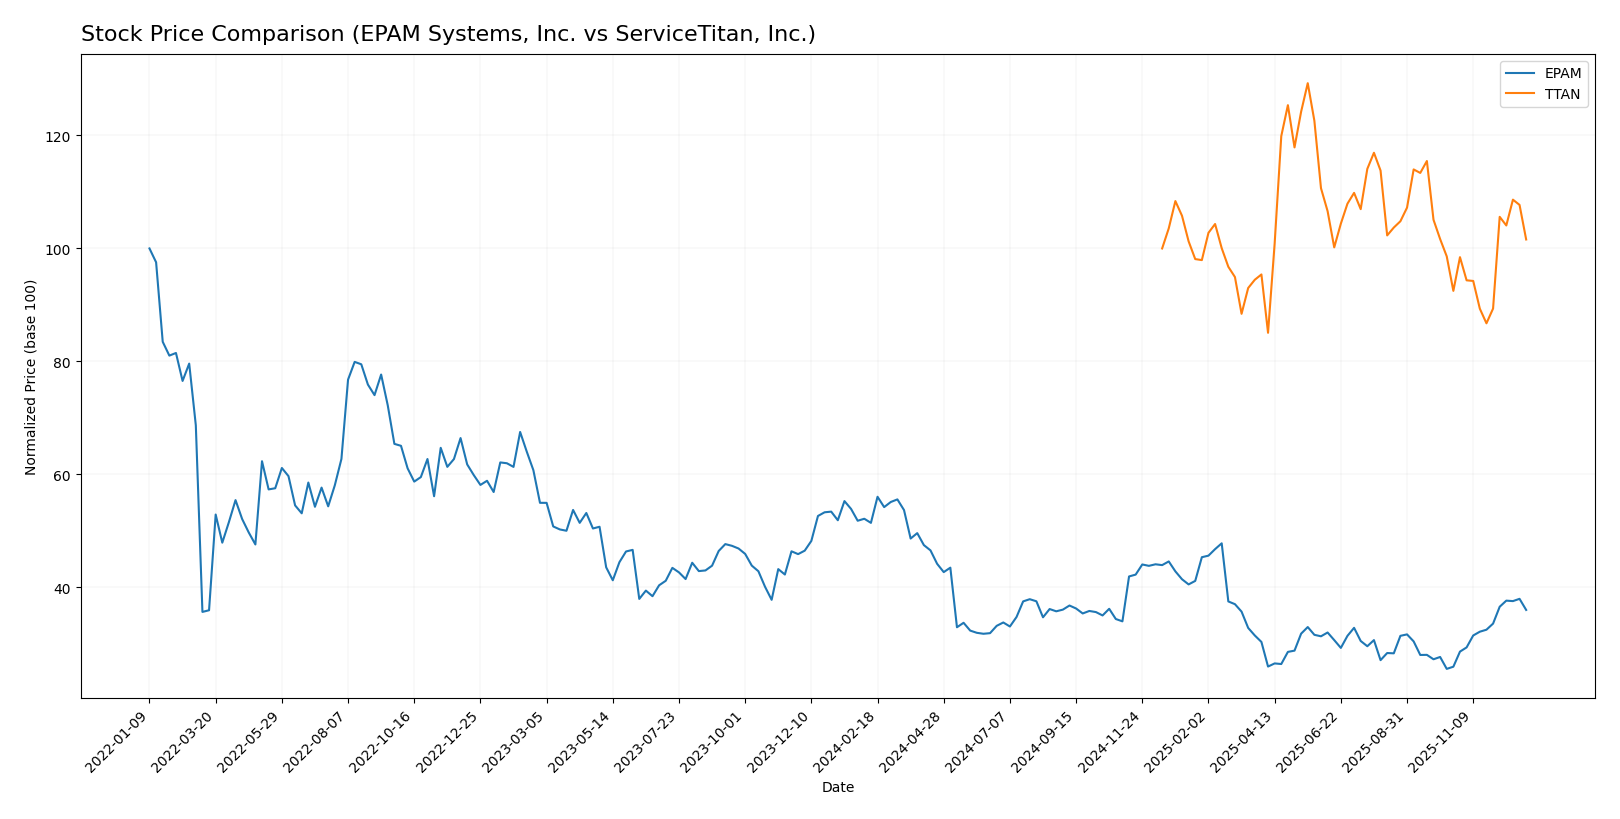
Stock Comparison
The stock price movements of EPAM Systems, Inc. and ServiceTitan, Inc. over the past year reveal contrasting trends, with significant price declines and rebounds for EPAM, while ServiceTitan exhibits a relatively stable pattern with mild gains.
Trend Analysis
EPAM Systems, Inc. shows a bearish overall trend with a -29.98% price change over the past 12 months, marked by accelerating decline and high volatility, hitting a low of 142.38 and a high of 311.98. A recent rebound with a 38.71% gain from October 2025 to January 2026 suggests a short-term recovery phase.
ServiceTitan, Inc. presents a neutral overall trend with a 1.59% price increase over 12 months, coupled with acceleration and moderate volatility. The recent trend shows a 9.84% rise, indicating steady but limited upward momentum in the last quarter.
Comparing both, EPAM experienced the largest price fluctuations and the most substantial recent recovery, while ServiceTitan’s stock maintained modest growth, delivering the highest overall market performance with a stable upward trend.
Target Prices
The current analyst consensus shows a moderate upside potential for EPAM Systems and ServiceTitan.
| Company | Target High | Target Low | Consensus |
|---|---|---|---|
| EPAM Systems, Inc. | 185 | 175 | 180 |
| ServiceTitan, Inc. | 145 | 125 | 135 |
EPAM’s consensus target price of 180 is below its current price of 200.46, suggesting analysts expect some price correction. ServiceTitan’s consensus target of 135 is well above its current price of 101.59, indicating potential growth expected by analysts.
Analyst Opinions Comparison
This section compares analysts’ ratings and financial scores for EPAM Systems, Inc. and ServiceTitan, Inc.:
Rating Comparison
EPAM Rating
- Rating: A- indicating a very favorable overall assessment of the company.
- Discounted Cash Flow Score: 4, showing favorable valuation based on cash flow.
- ROE Score: 3, a moderate measure of profit generation efficiency.
- ROA Score: 4, favorable in asset utilization effectiveness.
- Debt To Equity Score: 4, favorable financial risk with low reliance on debt.
- Overall Score: 4, reflecting a favorable summary financial standing.
TTAN Rating
- Rating: C- reflecting a very unfavorable overall assessment of the company.
- Discounted Cash Flow Score: 1, indicating a very unfavorable valuation.
- ROE Score: 1, indicating very unfavorable profit generation from equity.
- ROA Score: 1, very unfavorable asset utilization to generate earnings.
- Debt To Equity Score: 3, moderate financial risk due to debt level.
- Overall Score: 1, indicating very unfavorable overall financial standing.
Which one is the best rated?
Based strictly on the provided data, EPAM holds significantly better ratings and financial scores across all comparable metrics. TTAN’s scores indicate considerable weaknesses, especially in profitability and valuation metrics.
Scores Comparison
Here is a comparison of the Altman Z-Score and Piotroski Score for EPAM and TTAN:
EPAM Scores
- Altman Z-Score: 7.96, indicating a safe zone with low bankruptcy risk.
- Piotroski Score: 7, classified as strong financial health.
TTAN Scores
- Altman Z-Score: 19.00, indicating a safe zone with very low bankruptcy risk.
- Piotroski Score: 6, classified as average financial health.
Which company has the best scores?
TTAN has a significantly higher Altman Z-Score than EPAM, suggesting stronger financial stability. However, EPAM’s Piotroski Score is higher, indicating better overall financial strength compared to TTAN’s average rating.
Grades Comparison
The following grades from recognized financial institutions summarize the recent analyst opinions for both companies:
EPAM Systems, Inc. Grades
This table shows EPAM Systems’ latest grades from established grading companies.
| Grading Company | Action | New Grade | Date |
|---|---|---|---|
| Mizuho | Maintain | Outperform | 2025-11-11 |
| JP Morgan | Maintain | Overweight | 2025-11-07 |
| Morgan Stanley | Maintain | Equal Weight | 2025-09-09 |
| JP Morgan | Maintain | Overweight | 2025-08-20 |
| Barclays | Maintain | Overweight | 2025-05-12 |
| Needham | Maintain | Buy | 2025-05-09 |
| Guggenheim | Maintain | Buy | 2025-05-09 |
| Morgan Stanley | Maintain | Equal Weight | 2025-05-09 |
| Piper Sandler | Maintain | Neutral | 2025-05-09 |
| Stifel | Maintain | Buy | 2025-05-02 |
EPAM’s grades consistently reflect a positive outlook, with multiple “Buy,” “Overweight,” and “Outperform” ratings, indicating steady confidence from analysts.
ServiceTitan, Inc. Grades
This table presents ServiceTitan’s current grades from leading grading firms.
| Grading Company | Action | New Grade | Date |
|---|---|---|---|
| TD Cowen | Maintain | Buy | 2025-12-05 |
| Piper Sandler | Maintain | Overweight | 2025-12-05 |
| BMO Capital | Maintain | Outperform | 2025-12-05 |
| Morgan Stanley | Maintain | Equal Weight | 2025-12-05 |
| BMO Capital | Maintain | Outperform | 2025-11-20 |
| Piper Sandler | Maintain | Overweight | 2025-09-19 |
| Stifel | Maintain | Buy | 2025-09-19 |
| Wells Fargo | Maintain | Overweight | 2025-09-19 |
| Canaccord Genuity | Maintain | Buy | 2025-09-19 |
| Citigroup | Maintain | Neutral | 2025-09-09 |
ServiceTitan’s grades also indicate strong analyst support, with multiple “Buy,” “Overweight,” and “Outperform” ratings, reflecting sustained positive sentiment.
Which company has the best grades?
Both EPAM Systems and ServiceTitan have received a broad range of favorable grades from reputable analysts, with numerous “Buy,” “Overweight,” and “Outperform” recommendations. While both companies show strong analyst confidence, ServiceTitan has a slightly higher frequency of recent “Outperform” and “Buy” ratings, which could imply marginally stronger momentum in analyst sentiment. Investors might consider these grade trends when assessing potential portfolio additions.
Strengths and Weaknesses
Below is a comparison table highlighting key strengths and weaknesses of EPAM Systems, Inc. and ServiceTitan, Inc., based on their most recent financial and operational data.
| Criterion | EPAM Systems, Inc. | ServiceTitan, Inc. |
|---|---|---|
| Diversification | Broad sector coverage including Financial Services (1.02B), Consumer Goods (1.01B), and Software & Hi-Tech (0.70B) | Focused mainly on platform (739M) and subscription revenue (566M) |
| Profitability | Moderate net margin (9.61%), ROE at 12.52%, but ROIC below WACC (10.67% vs. 11.89%) | Negative net margin (-31%) and ROE (-16%), ROIC deeply negative (-14.25%) |
| Innovation | Strong software and tech services presence with consistent R&D investment | Innovative SaaS platform, but profitability and cash flow issues raise concerns |
| Global presence | Established global delivery model serving multiple industries worldwide | Primarily focused on North American markets with growth potential |
| Market Share | Solid market share in IT services with diverse client base | Growing market share in trades management software but still emerging |
Key takeaways: EPAM demonstrates broad diversification and stable profitability with some margin pressure, while ServiceTitan shows strong innovation but struggles with profitability and value creation. Caution is advised given both companies’ challenges in delivering consistent value above their cost of capital.
Risk Analysis
The following table summarizes key risk factors for EPAM Systems, Inc. and ServiceTitan, Inc. based on the most recent financial data and market conditions in 2026:
| Metric | EPAM Systems, Inc. | ServiceTitan, Inc. |
|---|---|---|
| Market Risk | High beta (1.75) indicates volatile stock sensitive to market swings | Negative beta (-0.85) suggests stock may move inversely to market trends |
| Debt level | Low debt-to-equity ratio (0.04), very manageable debt | Moderate debt-to-equity (0.11), manageable but higher relative leverage |
| Regulatory Risk | Moderate, technology sector faces evolving data/privacy rules | Moderate, software industry subject to compliance and data security laws |
| Operational Risk | Large workforce and global operations increase complexity | Smaller scale but rapid growth may strain operations |
| Environmental Risk | Low impact, primarily software services | Low impact, service software focus |
| Geopolitical Risk | Exposure due to global delivery model, sensitive to international tensions | Primarily US-focused, lower geopolitical exposure |
EPAM’s most significant risks stem from its high market volatility and geopolitical exposure due to global operations. ServiceTitan faces operational challenges linked to its rapid scale-up and a negative market correlation, which may affect stability. Both companies maintain low debt, reducing financial distress risk.
Which Stock to Choose?
EPAM Systems, Inc. shows a favorable income statement with steady revenue growth of 0.8% in 2024 and strong profitability metrics, including a 9.61% net margin. Its financial ratios are slightly favorable with a strong liquidity position, low debt, and a robust rating of A-. However, its ROIC is below WACC, indicating value destruction with a declining profitability trend.
ServiceTitan, Inc. presents a mixed financial profile with high revenue growth of 25.64% in 2025 but negative profitability metrics, including a -30.98% net margin and unfavorable returns on equity and assets. Its financial ratios are slightly unfavorable, despite a strong Altman Z-Score and a very unfavorable rating of C-. The company is shedding value with stable but negative ROIC versus WACC.
Investors focused on stability and strong financial health might find EPAM’s favorable rating and income consistency more appealing, while those with a higher risk tolerance and growth orientation could see potential in ServiceTitan’s revenue expansion despite its current value destruction and weaker profitability.
Disclaimer: Investment carries a risk of loss of initial capital. The past performance is not a reliable indicator of future results. Be sure to understand risks before making an investment decision.
Go Further
I encourage you to read the complete analyses of EPAM Systems, Inc. and ServiceTitan, Inc. to enhance your investment decisions: