In today’s fast-evolving tech landscape, choosing the right software company to invest in can be challenging yet rewarding. Workday, Inc. (WDAY) and Elastic N.V. (ESTC) both operate in the application software industry but focus on different niches: enterprise cloud solutions versus advanced search and data analytics. Their innovative approaches to cloud technology and data management make them compelling contenders. Join me as we analyze which company presents the most interesting opportunity for your investment portfolio.
Table of contents
Companies Overview
I will begin the comparison between Workday, Inc. and Elastic N.V. by providing an overview of these two companies and their main differences.
Workday Overview
Workday, Inc. provides enterprise cloud applications focused on financial management, human capital management, and analytics. It helps organizations plan, execute, and analyze their business operations with solutions that support CFOs and HR teams. Established in 2005 and headquartered in Pleasanton, California, Workday serves various industries including healthcare, education, and financial services, positioning itself as a major player in cloud-based enterprise software.
Elastic Overview
Elastic N.V. specializes in search technology and data analytics through its Elastic Stack product suite, which includes Elasticsearch, Kibana, Beats, and Logstash. These tools enable users to ingest, store, analyze, and visualize data across multi-cloud environments. Founded in 2012 and headquartered in Mountain View, California, Elastic targets applications such as app search, logging, and performance monitoring, providing scalable solutions for real-time data processing.
Key similarities and differences
Both Workday and Elastic operate in the software application industry, offering cloud-based solutions that improve business operations through data management and analytics. However, Workday focuses primarily on enterprise resource planning and human capital management for diverse industries, while Elastic concentrates on search functionality and data visualization across multi-cloud infrastructures. Their differing product scopes reflect distinct approaches to addressing enterprise software needs.
Income Statement Comparison
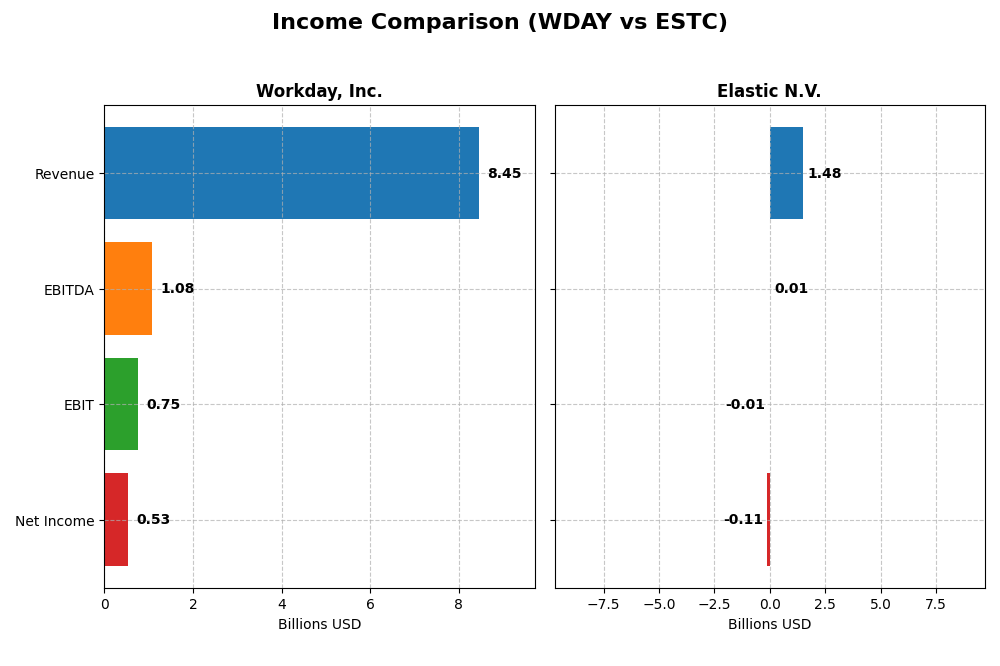
The table below compares key income statement metrics for Workday, Inc. and Elastic N.V. for their most recent fiscal year, providing a snapshot of their financial performance.
| Metric | Workday, Inc. (WDAY) | Elastic N.V. (ESTC) |
|---|---|---|
| Market Cap | 49.9B | 7.5B |
| Revenue | 8.45B | 1.48B |
| EBITDA | 1.08B | 6.1M |
| EBIT | 752M | -6.3M |
| Net Income | 526M | -108M |
| EPS | 1.98 | -1.04 |
| Fiscal Year | 2025 | 2025 |
Income Statement Interpretations
Workday, Inc.
Workday’s revenue nearly doubled from 4.3B in 2021 to 8.4B in 2025, with net income improving from a loss of 282M to 526M. Gross margin remained strong at 75.5%, while EBIT margin stabilized around 8.9%. Despite a drop in net margin and EPS growth in 2025, overall profitability and revenue growth trends are favorable.
Elastic N.V.
Elastic’s revenue rose by 144% from 608M in 2021 to 1.48B in 2025, with net income improving modestly to -108M from a deeper loss. Its gross margin stayed high at 74.4%, but EBIT and net margins remained negative, reflecting ongoing operating losses. The latest year showed improved EBIT but continued net margin challenges.
Which one has the stronger fundamentals?
Workday exhibits stronger fundamentals with consistent revenue growth, positive net income, and favorable margin trends, despite recent net margin pressure. Elastic shows impressive revenue expansion but persistent operating losses and negative net margins. Overall, Workday’s financial metrics indicate more stability and profitability than Elastic’s current income statement performance.
Financial Ratios Comparison
The table below presents a side-by-side comparison of key financial ratios for Workday, Inc. (WDAY) and Elastic N.V. (ESTC) based on their most recent fiscal year data from 2025.
| Ratios | Workday, Inc. (WDAY) | Elastic N.V. (ESTC) |
|---|---|---|
| ROE | 5.82% | -11.66% |
| ROIC | 2.73% | -3.45% |
| P/E | 132.15 | -82.65 |
| P/B | 7.69 | 9.64 |
| Current Ratio | 1.85 | 1.92 |
| Quick Ratio | 1.85 | 1.92 |
| D/E (Debt-to-Equity) | 0.37 | 0.64 |
| Debt-to-Assets | 18.70% | 22.95% |
| Interest Coverage | 3.64 | -2.17 |
| Asset Turnover | 0.47 | 0.57 |
| Fixed Asset Turnover | 5.36 | 51.28 |
| Payout Ratio | 0 | 0 |
| Dividend Yield | 0 | 0 |
Interpretation of the Ratios
Workday, Inc.
Workday shows a mixed financial profile with favorable liquidity (current and quick ratios at 1.85) and manageable debt levels (debt-to-equity 0.37). However, profitability metrics like ROE (5.82%) and ROIC (2.73%) are considered unfavorable, alongside a high P/E ratio of 132.15, indicating stretched valuation. The company does not pay dividends, likely prioritizing reinvestment and growth.
Elastic N.V.
Elastic presents mixed ratios with favorable liquidity (current and quick ratios at 1.92) and a strong fixed asset turnover (51.28). However, it struggles with profitability: negative net margin (-7.29%), ROE (-11.66%), and interest coverage at -0.25 raise concerns. Elastic also pays no dividends, probably focusing on growth and R&D investments instead of shareholder returns.
Which one has the best ratios?
Both companies have an equal proportion of favorable and unfavorable ratios at 42.86% each, with a neutral overall rating. Workday benefits from better profitability and interest coverage, while Elastic excels in asset turnover and has a lower weighted average cost of capital. Neither company distributes dividends, reflecting a focus on reinvestment rather than income.
Strategic Positioning
This section compares the strategic positioning of Workday, Inc. and Elastic N.V. in terms of Market position, Key segments, and Exposure to technological disruption:
Workday, Inc.
- Leading enterprise cloud applications provider with strong market presence and competitive pressure.
- Key segments: Subscription services dominate, professional services support; drivers include cloud financial and HCM applications.
- Exposure to disruption through cloud and augmented analytics innovations within enterprise software applications.
Elastic N.V.
- Specialized search technology provider with niche market focus and moderate competitive pressure.
- Key segments: Subscription and professional services focused on Elastic Stack search and analytics products.
- Exposure to disruption via multi-cloud Elastic Stack innovations addressing search, logging, and monitoring needs.
Workday, Inc. vs Elastic N.V. Positioning
Workday has a diversified enterprise cloud offering across finance, HCM, and analytics, supported by significant subscription revenue. Elastic concentrates on search and data analytics solutions within multi-cloud environments, reflecting a more focused business model.
Which has the best competitive advantage?
Both companies are currently shedding value with slightly unfavorable MOAT evaluations despite growing ROIC trends. Workday’s broader scale contrasts with Elastic’s niche specialization, but neither demonstrates a strong economic moat based on ROIC versus WACC data.
Stock Comparison
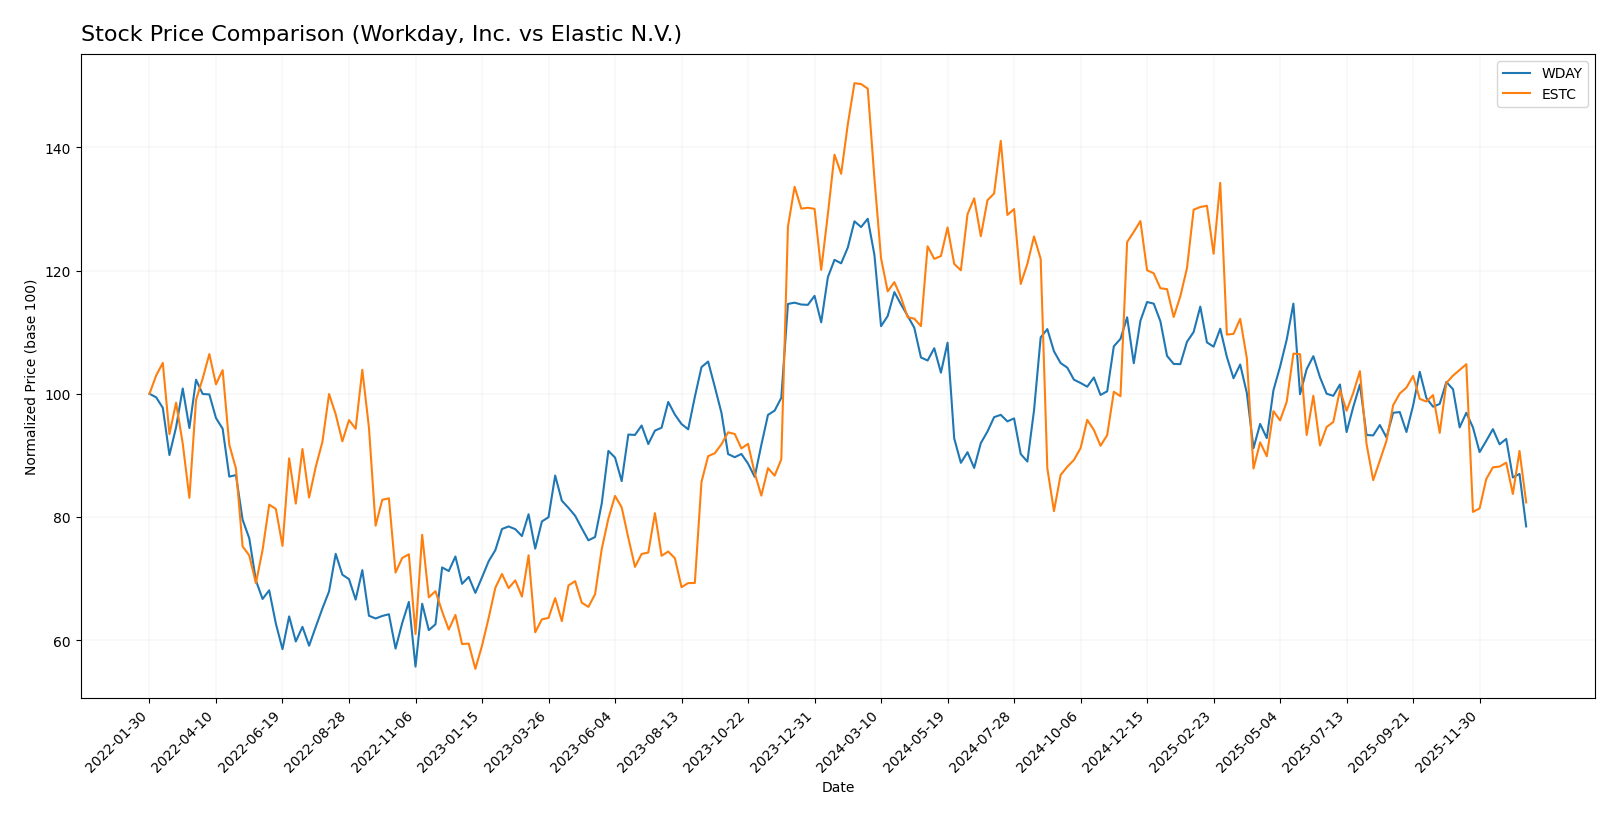
The stock price comparison over the past 12 months reveals significant bearish trends for both Workday, Inc. and Elastic N.V., with notable price declines and decelerating downward momentum.
Trend Analysis
Workday, Inc. exhibited a bearish trend over the past year, with a price decline of 38.91% and decelerating downward momentum. The stock showed high volatility, with a standard deviation of 20.22, ranging between $186.86 and $305.88.
Elastic N.V. also followed a bearish trend, declining 44.93% over the same period with deceleration. Volatility was lower than Workday’s, at a standard deviation of 14.08, and prices fluctuated between $70.04 and $129.62.
Comparing both stocks, Workday delivered the higher relative market performance despite a large decline, as its price drop was less severe than Elastic’s 44.93% loss over the past year.
Target Prices
Analysts present a well-defined target price consensus for both Workday, Inc. and Elastic N.V.
| Company | Target High | Target Low | Consensus |
|---|---|---|---|
| Workday, Inc. | 320 | 235 | 274.47 |
| Elastic N.V. | 134 | 76 | 108 |
The target consensus for Workday at 274.47 significantly exceeds its current price of 186.86 USD, indicating strong analyst optimism. Elastic’s consensus target of 108 also suggests upside potential compared to its current price of 71.38 USD, reflecting generally positive expectations.
Analyst Opinions Comparison
This section compares analysts’ ratings and grades for Workday, Inc. and Elastic N.V.:
Rating Comparison
WDAY Rating
- Overall rating is B-, considered very favorable.
- Discounted Cash Flow Score is 4, indicating a favorable valuation.
- Return on Equity Score is 3, reflecting moderate efficiency in profit generation.
- Return on Assets Score is 3, showing moderate asset utilization.
- Debt to Equity Score is 2, suggesting moderate financial risk.
- Overall Score is 2, classified as moderate.
ESTC Rating
- Overall rating is C-, also considered very favorable.
- Discounted Cash Flow Score is 3, a moderate valuation.
- Return on Equity Score is 1, showing very unfavorable efficiency.
- Return on Assets Score is 1, indicating very unfavorable asset utilization.
- Debt to Equity Score is 1, reflecting very unfavorable financial risk.
- Overall Score is 1, classified as very unfavorable.
Which one is the best rated?
Based on the provided data, Workday, Inc. is better rated overall with a B- rating and higher scores in discounted cash flow, ROE, ROA, and debt-to-equity compared to Elastic N.V.’s lower grades and C- rating.
Scores Comparison
The scores comparison between Workday, Inc. and Elastic N.V. is as follows:
WDAY Scores
- Altman Z-Score: 4.41, indicating a safe zone with low bankruptcy risk.
- Piotroski Score: 6, reflecting average financial strength.
ESTC Scores
- Altman Z-Score: 3.51, indicating a safe zone with low bankruptcy risk.
- Piotroski Score: 4, reflecting average financial strength.
Which company has the best scores?
Based on the provided data, Workday has a higher Altman Z-Score and Piotroski Score than Elastic, indicating relatively stronger financial stability and average financial health compared to Elastic.
Grades Comparison
Here is a comparison of the latest reliable grades assigned to Workday, Inc. and Elastic N.V.:
Workday, Inc. Grades
The following table summarizes recent analyst grades for Workday, Inc.:
| Grading Company | Action | New Grade | Date |
|---|---|---|---|
| Barclays | Maintain | Overweight | 2026-01-12 |
| RBC Capital | Maintain | Outperform | 2026-01-05 |
| TD Cowen | Maintain | Buy | 2025-11-26 |
| DA Davidson | Maintain | Neutral | 2025-11-26 |
| Wells Fargo | Maintain | Overweight | 2025-11-26 |
| Barclays | Maintain | Overweight | 2025-11-26 |
| Keybanc | Maintain | Overweight | 2025-11-26 |
| Citigroup | Maintain | Neutral | 2025-11-26 |
| JP Morgan | Maintain | Overweight | 2025-11-26 |
| UBS | Maintain | Neutral | 2025-11-26 |
Most grades for Workday, Inc. cluster around “Overweight” and “Buy,” indicating a generally positive outlook with some neutral positions.
Elastic N.V. Grades
The following table summarizes recent analyst grades for Elastic N.V.:
| Grading Company | Action | New Grade | Date |
|---|---|---|---|
| Barclays | Maintain | Overweight | 2026-01-12 |
| RBC Capital | Maintain | Outperform | 2026-01-05 |
| Jefferies | Maintain | Buy | 2026-01-05 |
| Citigroup | Maintain | Buy | 2025-11-24 |
| Wedbush | Maintain | Outperform | 2025-11-21 |
| B of A Securities | Maintain | Neutral | 2025-11-21 |
| Guggenheim | Maintain | Buy | 2025-11-21 |
| Wells Fargo | Maintain | Equal Weight | 2025-11-21 |
| RBC Capital | Maintain | Outperform | 2025-11-21 |
| Canaccord Genuity | Maintain | Buy | 2025-11-21 |
Elastic N.V. shows a strong bias toward “Buy” and “Outperform” ratings, with very few neutral stances.
Which company has the best grades?
Both Workday, Inc. and Elastic N.V. carry predominantly positive grades, but Elastic N.V. has a higher proportion of “Buy” and “Outperform” ratings compared to Workday’s mix of “Overweight,” “Buy,” and “Neutral.” This suggests that investors might see relatively stronger analyst confidence in Elastic N.V.’s prospects.
Strengths and Weaknesses
Below is a comparative overview of key strengths and weaknesses for Workday, Inc. (WDAY) and Elastic N.V. (ESTC) based on the most recent financial and operational data.
| Criterion | Workday, Inc. (WDAY) | Elastic N.V. (ESTC) |
|---|---|---|
| Diversification | Strong focus on subscription services (7.7B USD in 2025), limited product diversification | Also subscription-driven but smaller scale (1.38B USD in 2025), less diversified |
| Profitability | Slightly positive net margin (6.23%), but ROIC below WACC indicating value destruction | Negative net margin (-7.29%) and ROIC well below WACC, value destruction ongoing |
| Innovation | Growing ROIC trend (+162%) signals improving profitability potential | Growing ROIC trend (+86%) but still negative returns, innovation improving but profitability lagging |
| Global presence | Established global SaaS platform with strong enterprise footprint | Growing global presence but smaller scale and less established internationally |
| Market Share | Large market share in enterprise HR and finance cloud software | Smaller market share in search and data analytics market, niche positioning |
Key takeaways: Both companies are currently shedding value as their ROIC remains below WACC. Workday leads in scale, diversification, and profitability metrics with improving returns, whereas Elastic shows faster ROIC growth but continues to struggle with negative margins and smaller market share. Caution is warranted for both, with Workday presenting a more stable investment profile.
Risk Analysis
Below is a comparison of key risks for Workday, Inc. (WDAY) and Elastic N.V. (ESTC) based on the most recent data from 2025.
| Metric | Workday, Inc. (WDAY) | Elastic N.V. (ESTC) |
|---|---|---|
| Market Risk | Beta 1.14, moderate volatility | Beta 0.93, lower volatility |
| Debt level | Debt-to-Equity 0.37, low risk | Debt-to-Equity 0.64, moderate risk |
| Regulatory Risk | Moderate, operates globally | Moderate, multi-cloud compliance challenges |
| Operational Risk | Medium, large employee base (20.5K) | Medium, smaller workforce (3.4K) |
| Environmental Risk | Low to moderate, tech sector | Low to moderate, tech sector |
| Geopolitical Risk | Moderate, US-based with international exposure | Moderate, US-based with global clients |
Workday’s most significant risks are linked to valuation pressures and moderate market volatility, while Elastic faces operational challenges with negative profitability and some leverage concerns. Both have favorable liquidity but require monitoring of their competitive positioning and global regulatory environments.
Which Stock to Choose?
Workday, Inc. (WDAY) has shown favorable income growth with a 16.35% revenue increase in the last year and a 95.6% rise over five years. Its profitability is moderate, with a net margin of 6.23%, though some ratios like ROE and ROIC are unfavorable. The company maintains low debt levels and a strong liquidity position. Its overall rating is very favorable despite some valuation concerns.
Elastic N.V. (ESTC) exhibits strong revenue growth of 17.04% last year and 143.77% over five years but posts negative profitability with a net margin of -7.29%. Financial ratios mostly appear unfavorable, including negative ROE and interest coverage, though liquidity remains solid. The rating is very favorable on some metrics but overall presents challenges in profitability and valuation.
Investors seeking companies with stable income growth and moderate profitability may find Workday’s financials more aligned with a quality investing profile. Conversely, those focusing on higher growth potential but tolerating volatility and negative earnings might view Elastic as fitting a risk-tolerant, growth-focused strategy. Both companies show slightly unfavorable economic moats but improving ROIC trends, suggesting evolving profitability dynamics.
Disclaimer: Investment carries a risk of loss of initial capital. The past performance is not a reliable indicator of future results. Be sure to understand risks before making an investment decision.
Go Further
I encourage you to read the complete analyses of Workday, Inc. and Elastic N.V. to enhance your investment decisions: