In today’s dynamic tech landscape, The Trade Desk, Inc. (TTD) and Elastic N.V. (ESTC) stand out as innovative leaders in the software application sector. Both companies excel in harnessing data-driven solutions—TTD focuses on digital advertising optimization, while ESTC specializes in real-time search and analytics platforms. This comparison explores their market positions and growth strategies to help you decide which company offers the most compelling investment opportunity. Let’s uncover which stock deserves a place in your portfolio.
Table of contents
Companies Overview
I will begin the comparison between The Trade Desk and Elastic by providing an overview of these two companies and their main differences.
The Trade Desk Overview
The Trade Desk, Inc. operates a self-service cloud-based platform that enables buyers to create, manage, and optimize data-driven digital advertising campaigns across multiple formats and devices. Headquartered in Ventura, California, the company serves advertising agencies and service providers globally. Founded in 2009, The Trade Desk is positioned as a key player in the software application industry focused on advertising technology.
Elastic Overview
Elastic N.V. delivers technology solutions designed for multi-cloud environments, primarily through its Elastic Stack product portfolio, which includes Elasticsearch and Kibana. Headquartered in Mountain View, California, Elastic focuses on search, data ingestion, analysis, and visualization across various data types. Founded in 2012, Elastic serves a broad range of use cases including app search, logging, and application performance management within the software application sector.
Key similarities and differences
Both The Trade Desk and Elastic are U.S.-based technology companies operating in the software application industry with cloud-based platforms. The Trade Desk focuses on digital advertising technology, enabling campaign management across various media, while Elastic specializes in search and data analytics solutions across multi-cloud environments. Each targets different customer needs: advertising agencies versus organizations requiring advanced search and analytics capabilities.
Income Statement Comparison
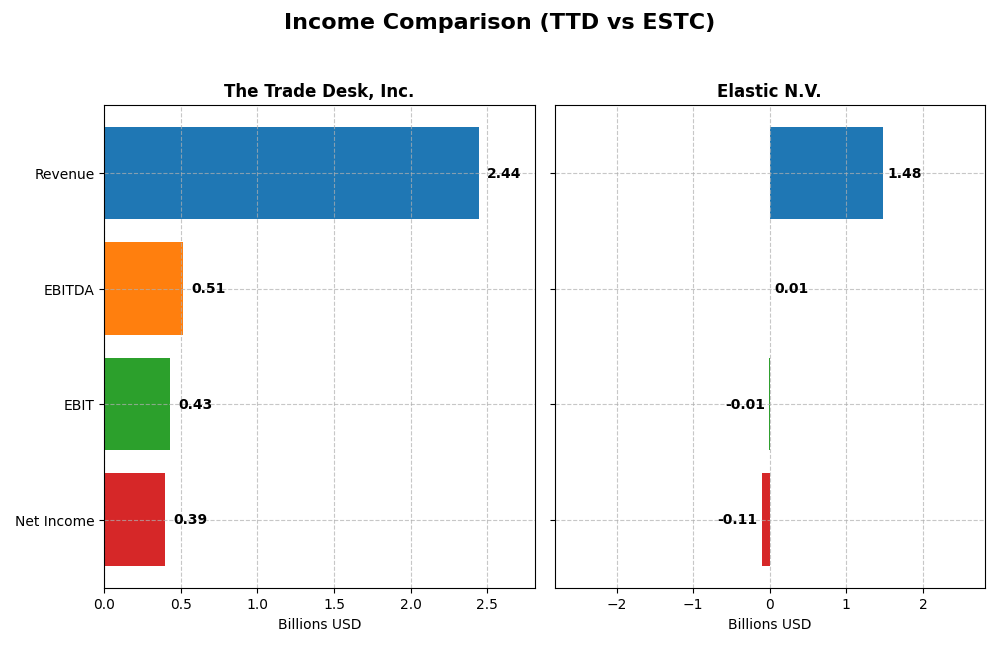
This table contrasts the key income statement metrics for The Trade Desk, Inc. and Elastic N.V. for their most recent fiscal years, highlighting revenue, profitability, and earnings per share.
| Metric | The Trade Desk, Inc. (2024) | Elastic N.V. (2025) |
|---|---|---|
| Market Cap | 17.3B | 7.5B |
| Revenue | 2.44B | 1.48B |
| EBITDA | 515M | 6.1M |
| EBIT | 427M | -6.3M |
| Net Income | 393M | -108M |
| EPS | 0.80 | -1.04 |
| Fiscal Year | 2024 | 2025 |
Income Statement Interpretations
The Trade Desk, Inc.
The Trade Desk, Inc. showed strong revenue growth from 2020 to 2024, nearly tripling its sales to 2.44B in 2024. Net income more than doubled, reaching 393M, despite a slight decline in net margin over the period. In 2024, the company demonstrated robust margin stability with an 80.7% gross margin and a significant 113% EBIT growth, reflecting improved profitability and operational leverage.
Elastic N.V.
Elastic N.V. experienced steady revenue growth, increasing by 144% from 2021 to 2025, with revenue at 1.48B in 2025. However, net income remained negative in 2025 (-108M) despite improvements, and the EBIT margin stayed slightly negative at -0.4%. The latest year saw a revenue and gross profit increase of about 17%, but net margin and EPS deteriorated, indicating ongoing challenges in profitability despite top-line growth.
Which one has the stronger fundamentals?
The Trade Desk, Inc. exhibits stronger fundamentals with consistently favorable gross, EBIT, and net margins, alongside significant net income growth and positive EPS trends. Elastic N.V., while growing revenue, struggles with negative net and EBIT margins and fluctuating profitability metrics. The Trade Desk’s robust margin profile and improving earnings position it more favorably in terms of income statement strength.
Financial Ratios Comparison
The table below presents a side-by-side comparison of key financial ratios for The Trade Desk, Inc. (TTD) and Elastic N.V. (ESTC) based on their most recent fiscal year data.
| Ratios | The Trade Desk, Inc. (TTD) 2024 | Elastic N.V. (ESTC) 2025 |
|---|---|---|
| ROE | 13.33% | -11.66% |
| ROIC | 10.02% | -3.45% |
| P/E | 146.77 | -82.65 |
| P/B | 19.56 | 9.64 |
| Current Ratio | 1.86 | 1.92 |
| Quick Ratio | 1.86 | 1.92 |
| D/E (Debt-to-Equity) | 0.11 | 0.64 |
| Debt-to-Assets | 5.11% | 22.95% |
| Interest Coverage | 0 (not reported) | -2.17 |
| Asset Turnover | 0.40 | 0.57 |
| Fixed Asset Turnover | 5.17 | 51.28 |
| Payout ratio | 0% | 0% |
| Dividend yield | 0% | 0% |
Interpretation of the Ratios
The Trade Desk, Inc.
The Trade Desk exhibits mostly favorable financial ratios, including a strong net margin of 16.08% and a return on invested capital (ROIC) of 10.02%, indicating operational efficiency. However, the company faces unfavorable valuations with a high PE ratio of 146.77 and a price-to-book ratio of 19.56. The current and quick ratios are solid at 1.86, and debt metrics show low leverage. The company does not pay dividends, likely focusing on reinvestment and growth.
Elastic N.V.
Elastic shows mixed financial health with unfavorable profitability ratios such as a negative net margin of -7.29% and negative returns on equity (ROE) and capital employed. Its liquidity is strong with a current ratio of 1.92, and debt metrics are moderate. Elastic does not pay dividends, reflecting its ongoing investment phase and possible losses. Valuation ratios are mixed, with a favorable PE due to negative earnings and an unfavorable price-to-book ratio.
Which one has the best ratios?
The Trade Desk holds an overall favorable rating with more than half of its ratios positive, particularly profitability and liquidity, despite high valuation multiples. Elastic N.V. presents a neutral stance with significant profitability challenges and mixed valuation metrics. Based on the ratio assessments, The Trade Desk demonstrates stronger financial health relative to Elastic.
Strategic Positioning
This section compares the strategic positioning of The Trade Desk, Inc. and Elastic N.V. including Market position, Key segments, and exposure to disruption:
The Trade Desk, Inc.
- Leading cloud-based platform in digital advertising, facing competitive pressure in ad tech sector.
- Focused on data-driven digital advertising across multiple ad formats and devices.
- Operates in an evolving advertising tech environment with potential disruption from data privacy policies.
Elastic N.V.
- Search technology provider focused on Elastic Stack, competing in multi-cloud software market.
- Key segments include Subscription (major) and Professional Services, driven by Elastic Stack products.
- Exposed to cloud and data analytics disruption, adapting with integrated search, security, and monitoring solutions.
The Trade Desk, Inc. vs Elastic N.V. Positioning
The Trade Desk pursues a concentrated strategy in digital advertising technology, while Elastic N.V. adopts a diversified approach across search, analytics, and security software. The Trade Desk’s focus offers specialization, whereas Elastic’s broader portfolio targets multiple use cases and cloud environments.
Which has the best competitive advantage?
Both companies currently shed value relative to their cost of capital, with The Trade Desk showing declining profitability and Elastic improving profitability despite value destruction. Neither exhibits a strong economic moat based on recent ROIC trends.
Stock Comparison
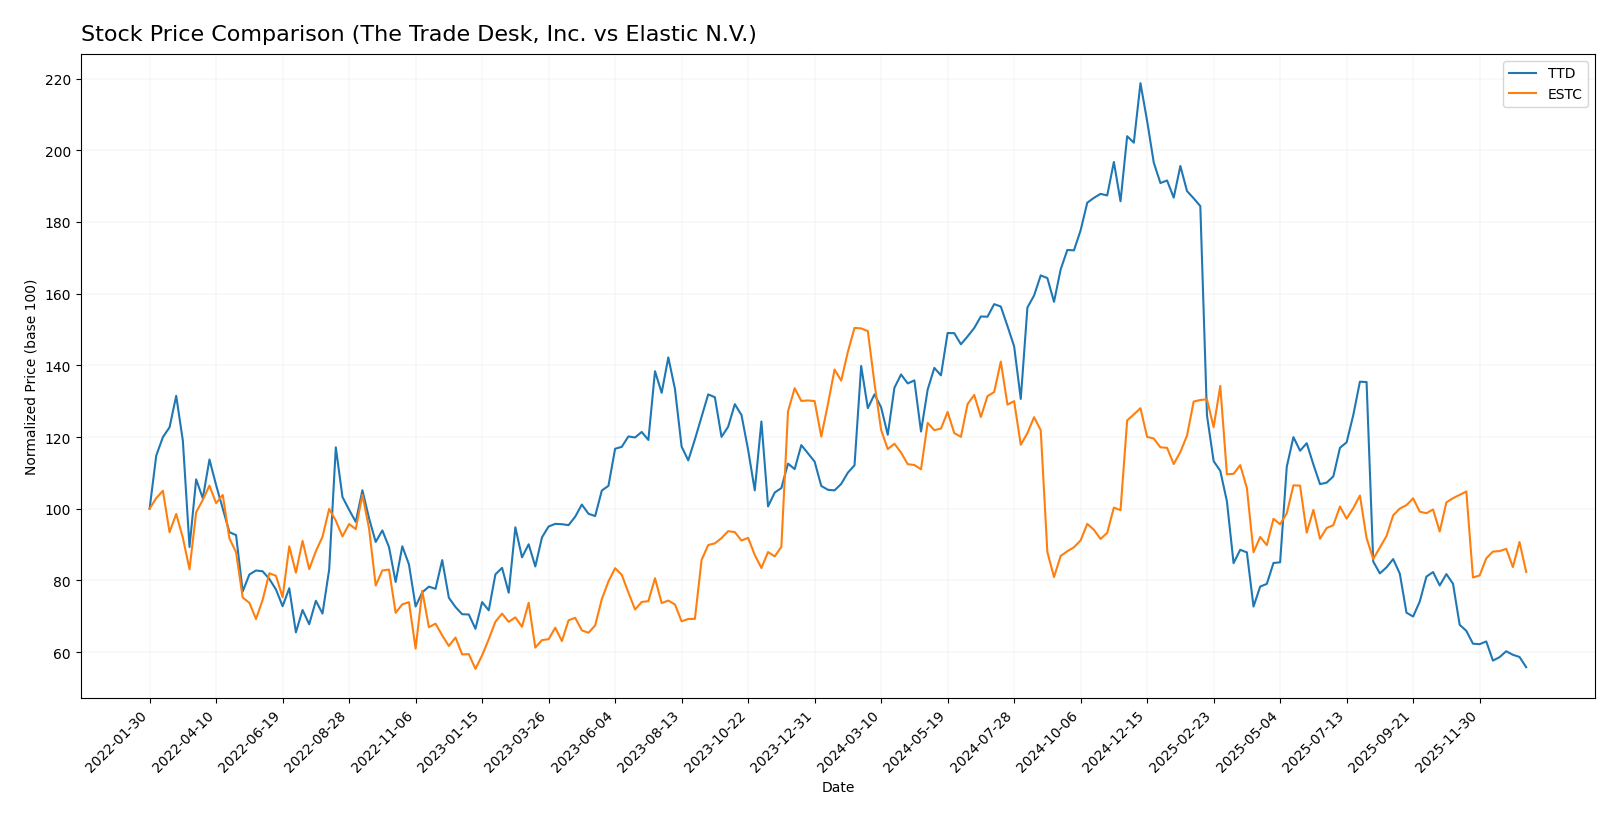
The stock price movements over the past 12 months reveal pronounced bearish trends for both The Trade Desk, Inc. and Elastic N.V., with significant declines and decelerating momentum shaping their trading dynamics.
Trend Analysis
The Trade Desk, Inc. (TTD) experienced a -56.43% price change over the past year, indicating a bearish trend with deceleration in its decline. Volatility is high with a standard deviation of 28.36, and prices ranged between 35.48 and 139.11.
Elastic N.V. (ESTC) showed a -44.93% price drop in the same period, also bearish with decelerating losses. Volatility is moderate at 14.08 standard deviation, with highs of 129.62 and lows at 70.04.
Comparing both, The Trade Desk, Inc. delivered the larger negative market performance, declining more steeply than Elastic N.V. over the past year.
Target Prices
Analysts present a mixed but generally optimistic target consensus for The Trade Desk, Inc. and Elastic N.V.
| Company | Target High | Target Low | Consensus |
|---|---|---|---|
| The Trade Desk, Inc. | 98 | 39 | 56.73 |
| Elastic N.V. | 134 | 76 | 108 |
For The Trade Desk, the consensus target price of 56.73 significantly exceeds its current price of 35.48, suggesting upside potential. Elastic’s target consensus of 108 is also well above its current 71.38, indicating positive analyst expectations.
Analyst Opinions Comparison
This section compares analysts’ ratings and financial scores for The Trade Desk, Inc. and Elastic N.V.:
Rating Comparison
The Trade Desk, Inc. Rating
- Rating: B, classified as Very Favorable
- Discounted Cash Flow Score: 4, indicating a Favorable DCF
- ROE Score: 4, showing Favorable efficiency in equity use
- ROA Score: 4, showing Favorable asset utilization
- Debt To Equity Score: 3, moderate financial risk
- Overall Score: 3, moderate overall financial standing
Elastic N.V. Rating
- Rating: C-, classified as Very Unfavorable
- Discounted Cash Flow Score: 3, indicating Moderate DCF
- ROE Score: 1, showing Very Unfavorable efficiency
- ROA Score: 1, showing Very Unfavorable asset utilization
- Debt To Equity Score: 1, very unfavorable financial risk
- Overall Score: 1, very unfavorable overall standing
Which one is the best rated?
Based strictly on the provided data, The Trade Desk, Inc. holds a better rating and stronger financial scores across all categories compared to Elastic N.V., which exhibits generally very unfavorable scores.
Scores Comparison
The following table compares the Altman Z-Score and Piotroski Score of The Trade Desk, Inc. and Elastic N.V.:
TTD Scores
- Altman Z-Score: 4.30, indicating a safe zone status.
- Piotroski Score: 5, classified as average financial strength.
ESTC Scores
- Altman Z-Score: 3.51, indicating a safe zone status.
- Piotroski Score: 4, classified as average financial strength.
Which company has the best scores?
Based strictly on the provided data, TTD has a higher Altman Z-Score and Piotroski Score than ESTC, indicating relatively stronger financial stability and average financial health.
Grades Comparison
The following presents the recent reliable grades issued by recognized financial institutions for both companies:
The Trade Desk, Inc. Grades
This table summarizes The Trade Desk’s recent grades from major financial firms.
| Grading Company | Action | New Grade | Date |
|---|---|---|---|
| Morgan Stanley | Maintain | Equal Weight | 2026-01-13 |
| Wells Fargo | Maintain | Equal Weight | 2026-01-12 |
| Cantor Fitzgerald | Maintain | Neutral | 2026-01-08 |
| Wolfe Research | Maintain | Outperform | 2026-01-06 |
| Guggenheim | Maintain | Buy | 2026-01-05 |
| Jefferies | Maintain | Hold | 2025-12-11 |
| Wedbush | Maintain | Neutral | 2025-12-08 |
| DA Davidson | Maintain | Buy | 2025-11-10 |
| Truist Securities | Maintain | Buy | 2025-11-07 |
| Wells Fargo | Maintain | Equal Weight | 2025-11-07 |
Overall, The Trade Desk’s grades predominantly range from Hold/Neutral to Buy/Outperform, indicating a moderately positive sentiment with some caution.
Elastic N.V. Grades
This table summarizes Elastic N.V.’s recent grades from major financial firms.
| Grading Company | Action | New Grade | Date |
|---|---|---|---|
| Barclays | Maintain | Overweight | 2026-01-12 |
| RBC Capital | Maintain | Outperform | 2026-01-05 |
| Jefferies | Maintain | Buy | 2026-01-05 |
| Citigroup | Maintain | Buy | 2025-11-24 |
| Wedbush | Maintain | Outperform | 2025-11-21 |
| B of A Securities | Maintain | Neutral | 2025-11-21 |
| Guggenheim | Maintain | Buy | 2025-11-21 |
| Wells Fargo | Maintain | Equal Weight | 2025-11-21 |
| RBC Capital | Maintain | Outperform | 2025-11-21 |
| Canaccord Genuity | Maintain | Buy | 2025-11-21 |
Elastic N.V.’s grades mostly cluster at Buy, Outperform, and Overweight, reflecting a generally favorable outlook from analysts.
Which company has the best grades?
Elastic N.V. has received a higher proportion of Buy and Outperform ratings compared to The Trade Desk, which shows a wider mix including Hold and Neutral. This suggests stronger analyst confidence in Elastic N.V., potentially appealing to investors prioritizing positive consensus momentum.
Strengths and Weaknesses
Below is a comparison of key strengths and weaknesses for The Trade Desk, Inc. (TTD) and Elastic N.V. (ESTC) based on the most recent financial data and market performance.
| Criterion | The Trade Desk, Inc. (TTD) | Elastic N.V. (ESTC) |
|---|---|---|
| Diversification | Moderate focus on digital advertising platforms; limited product lines | Growing subscription and professional services revenue, indicating diversification |
| Profitability | Favorable net margin (16.08%), positive ROIC (10.02%), but high valuation ratios (PE 146.77, PB 19.56) | Negative net margin (-7.29%), negative ROIC (-3.45%), still improving profitability |
| Innovation | Consistent investment in ad tech innovation, maintaining competitive edge | High fixed asset turnover (51.28) shows efficient use of assets, innovation in search and analytics |
| Global presence | Strong global digital ad footprint, but concentrated in advertising ecosystem | Expanding global cloud and enterprise software presence |
| Market Share | Leading player in programmatic advertising | Growing market share in enterprise search and data analytics |
Key takeaways: The Trade Desk demonstrates strong profitability and solid innovation but carries high valuation and slightly declining returns. Elastic is currently unprofitable but shows improving ROIC and diversification, positioning itself for growth in cloud services. Investors should weigh TTD’s stable cash flow against ESTC’s growth potential and risk.
Risk Analysis
Below is a comparative risk table for The Trade Desk, Inc. (TTD) and Elastic N.V. (ESTC) based on their latest financial and market data.
| Metric | The Trade Desk, Inc. (TTD) | Elastic N.V. (ESTC) |
|---|---|---|
| Market Risk | Moderate (Beta 1.105) | Moderate (Beta 0.925) |
| Debt Level | Low (D/E 0.11, Debt/Assets 5.11%) | Moderate (D/E 0.64, Debt/Assets 22.95%) |
| Regulatory Risk | Moderate (Tech industry focus, US-based) | Moderate (Cloud software, US-based) |
| Operational Risk | Moderate (Platform dependency, competition) | Moderate (Product diversification, competition) |
| Environmental Risk | Low (Software sector, minimal footprint) | Low (Software sector, minimal footprint) |
| Geopolitical Risk | Moderate (Global operations, US headquarters) | Moderate (Global presence, US headquarters) |
The Trade Desk shows lower debt levels and stronger financial stability, reducing bankruptcy risk, while Elastic faces greater profitability challenges with negative margins and high debt burden. Market and geopolitical risks remain moderate for both due to their tech sector exposure and global operations.
Which Stock to Choose?
The Trade Desk, Inc. (TTD) shows a favorable income evolution with strong revenue and profit growth over 2020-2024. Financial ratios are mostly favorable, including net margin at 16.08% and ROIC at 10.02%, supported by low debt and a solid current ratio. Its overall rating is very favorable with a B grade, although valuation multiples like P/E and P/B are high. The company’s MOAT evaluation indicates slight value shedding and declining profitability.
Elastic N.V. (ESTC) presents a mixed income statement with favorable revenue growth but negative net margin and ROE in 2025. Financial ratios are neutral overall, with favorable liquidity but unfavorable profitability and coverage metrics. Its rating is also very favorable with a C- grade, but core profitability scores are very unfavorable. The MOAT evaluation signals value destruction despite improving ROIC trends.
Investors focused on stable profitability and strong income growth might find The Trade Desk’s profile more favorable, while those open to growth opportunities amid profitability challenges could view Elastic’s improving ROIC trend as a positive sign. Risk-averse investors may lean toward TTD’s financial strength, whereas risk-tolerant investors might consider ESTC’s potential for turnaround.
Disclaimer: Investment carries a risk of loss of initial capital. The past performance is not a reliable indicator of future results. Be sure to understand risks before making an investment decision.
Go Further
I encourage you to read the complete analyses of The Trade Desk, Inc. and Elastic N.V. to enhance your investment decisions: