In the fast-evolving software application sector, ServiceTitan, Inc. (TTAN) and Elastic N.V. (ESTC) stand out as innovators transforming their respective markets. ServiceTitan focuses on field service management solutions, while Elastic excels in search and data analytics technology. Both companies share a commitment to cloud-based innovation and serve technology-driven businesses. This article will analyze their strengths and risks to help you decide which stock fits best in your investment portfolio.
Table of contents
Companies Overview
I will begin the comparison between ServiceTitan and Elastic by providing an overview of these two companies and their main differences.
ServiceTitan Overview
ServiceTitan, Inc. focuses on software solutions that support field service operations for residential and commercial infrastructure maintenance. Founded in 2008 and headquartered in Glendale, CA, ServiceTitan aims to streamline the installation, maintenance, and servicing processes through its application software. With a market cap of 8.5B USD and over 3,000 employees, it holds a significant position in the software application industry.
Elastic Overview
Elastic N.V. specializes in search technology, offering the Elastic Stack—a suite of products for data ingestion, search, analysis, and visualization across multi-cloud environments. Founded in 2012 and based in Mountain View, CA, Elastic serves diverse data needs with products like Elasticsearch and Kibana. The company has a market cap of approximately 7.5B USD and employs around 3,400 staff, positioning it as a key player in cloud-based software applications.
Key similarities and differences
Both companies operate within the technology sector, focusing on software applications designed to improve operational efficiency. ServiceTitan targets field service management with a hands-on service approach, while Elastic concentrates on data search and analytics solutions for cloud environments. They differ in market capitalization and beta values, reflecting different risk profiles and business focuses despite their common goal of leveraging software for enhanced productivity.
Income Statement Comparison
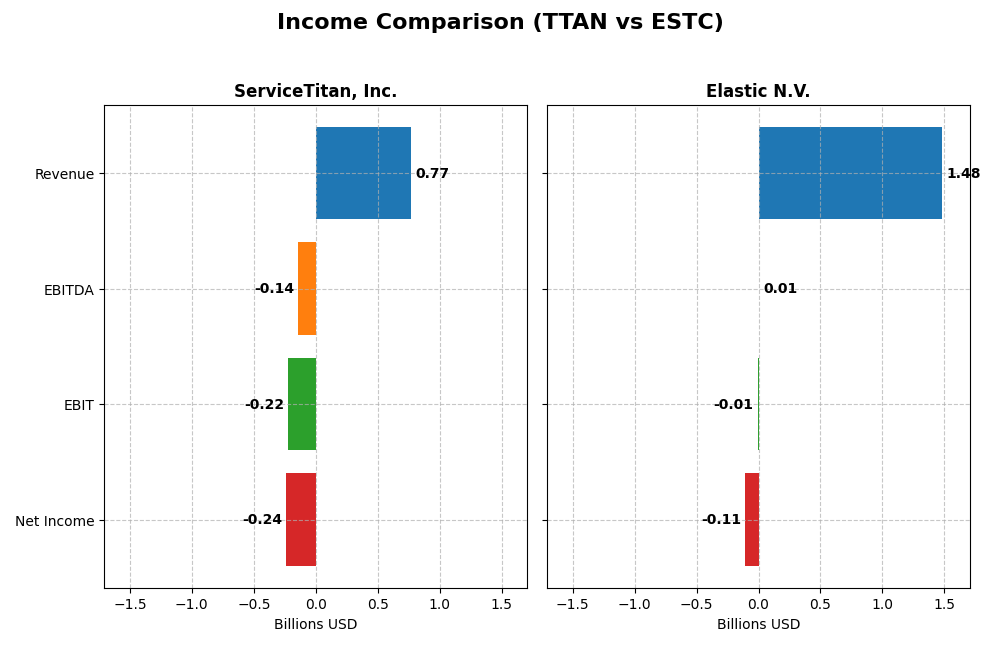
Below is a side-by-side comparison of the latest fiscal year income statement metrics for ServiceTitan, Inc. and Elastic N.V.
| Metric | ServiceTitan, Inc. (TTAN) | Elastic N.V. (ESTC) |
|---|---|---|
| Market Cap | 8.5B | 7.5B |
| Revenue | 772M | 1.48B |
| EBITDA | -141M | 6.1M |
| EBIT | -221M | -6.3M |
| Net Income | -239M | -108M |
| EPS | -8.53 | -1.04 |
| Fiscal Year | 2025 | 2025 |
Income Statement Interpretations
ServiceTitan, Inc.
ServiceTitan’s revenue grew robustly by 65.0% from 2023 to 2025, reaching $772M in 2025. Despite this, net income remained negative, though improving by 11.3% overall. Gross margin was favorable at 64.9%, but EBIT and net margins stayed negative, signaling ongoing profitability challenges. The 2025 year showed a 25.6% revenue increase but worsening EBIT by 26.7%.
Elastic N.V.
Elastic’s revenue expanded strongly by 143.8% over 2021-2025, hitting $1.48B in 2025. Net income growth was positive at 16.5%, though the company remained unprofitable with a net margin of -7.3%. Gross margin was high and stable at 74.4%. In 2025, EBIT improved sharply by 93.5%, and operating expenses grew moderately, supporting better profitability trends despite net margin declines.
Which one has the stronger fundamentals?
Elastic displays stronger fundamentals overall, with higher revenue growth, superior gross margin, and improving EBIT performance. ServiceTitan also shows solid revenue growth but struggles more with negative profitability and deteriorating EBIT. Elastic’s more favorable balance of growth and margin stability suggests comparatively better income statement health, despite both firms facing net losses.
Financial Ratios Comparison
The table below presents the most recent key financial ratios for ServiceTitan, Inc. and Elastic N.V., offering a snapshot of their profitability, liquidity, leverage, and efficiency as of fiscal year 2025.
| Ratios | ServiceTitan, Inc. (TTAN) | Elastic N.V. (ESTC) |
|---|---|---|
| ROE | -16.4% | -11.7% |
| ROIC | -14.1% | -3.4% |
| P/E | -18.1 | -82.7 |
| P/B | 2.98 | 9.64 |
| Current Ratio | 3.74 | 1.92 |
| Quick Ratio | 3.74 | 1.92 |
| D/E | 0.11 | 0.64 |
| Debt-to-Assets | 9.4% | 23.0% |
| Interest Coverage | -14.8 | -2.17 |
| Asset Turnover | 0.44 | 0.57 |
| Fixed Asset Turnover | 9.57 | 51.3 |
| Payout ratio | 0 | 0 |
| Dividend yield | 0 | 0 |
Interpretation of the Ratios
ServiceTitan, Inc.
ServiceTitan shows several unfavorable ratios including negative net margin (-30.98%), return on equity (-16.44%), and return on invested capital (-14.11%), indicating weak profitability and efficiency. However, it benefits from a favorable weighted average cost of capital (4.95%) and low debt levels. The company does not pay dividends, likely prioritizing reinvestment and growth given its negative earnings and cash flow coverage.
Elastic N.V.
Elastic exhibits a mixed ratio profile with an unfavorable net margin (-7.29%) and negative returns on equity (-11.66%) and invested capital (-3.45%), but it maintains a favorable weighted average cost of capital (7.83%) and strong current and quick ratios (1.92). Like ServiceTitan, Elastic does not pay dividends, suggesting a focus on reinvestment or growth initiatives rather than shareholder payouts.
Which one has the best ratios?
Elastic’s ratios present a more balanced picture with fewer unfavorable metrics and better liquidity compared to ServiceTitan, which shows deeper profitability challenges and weaker operational efficiency. Elastic’s neutral global rating contrasts with ServiceTitan’s slightly unfavorable stance, indicating Elastic currently holds a relatively stronger financial position in terms of ratio performance.
Strategic Positioning
This section compares the strategic positioning of ServiceTitan and Elastic, including Market position, Key segments, and disruption:
ServiceTitan
- Market position and competitive pressure
- Key segments and business drivers
- Exposure to technological disruption
Elastic
- Specialized in field service software; operates in a competitive tech sector.
- Revenue driven by Platform and Subscription services for field infrastructure management.
- Focused on software for residential and commercial building services; limited disruption details provided.
ServiceTitan vs Elastic Positioning
ServiceTitan maintains a concentrated focus on field service software, relying on platform and subscription revenues, while Elastic offers a diversified product suite centered on search and analytics with cloud adaptability. ServiceTitan’s niche approach contrasts with Elastic’s broader technological solutions.
Which has the best competitive advantage?
Both companies are currently shedding value as their ROIC is below WACC; however, Elastic shows a growing ROIC trend, suggesting improving profitability, whereas ServiceTitan’s profitability remains stable but unfavorable.
Stock Comparison
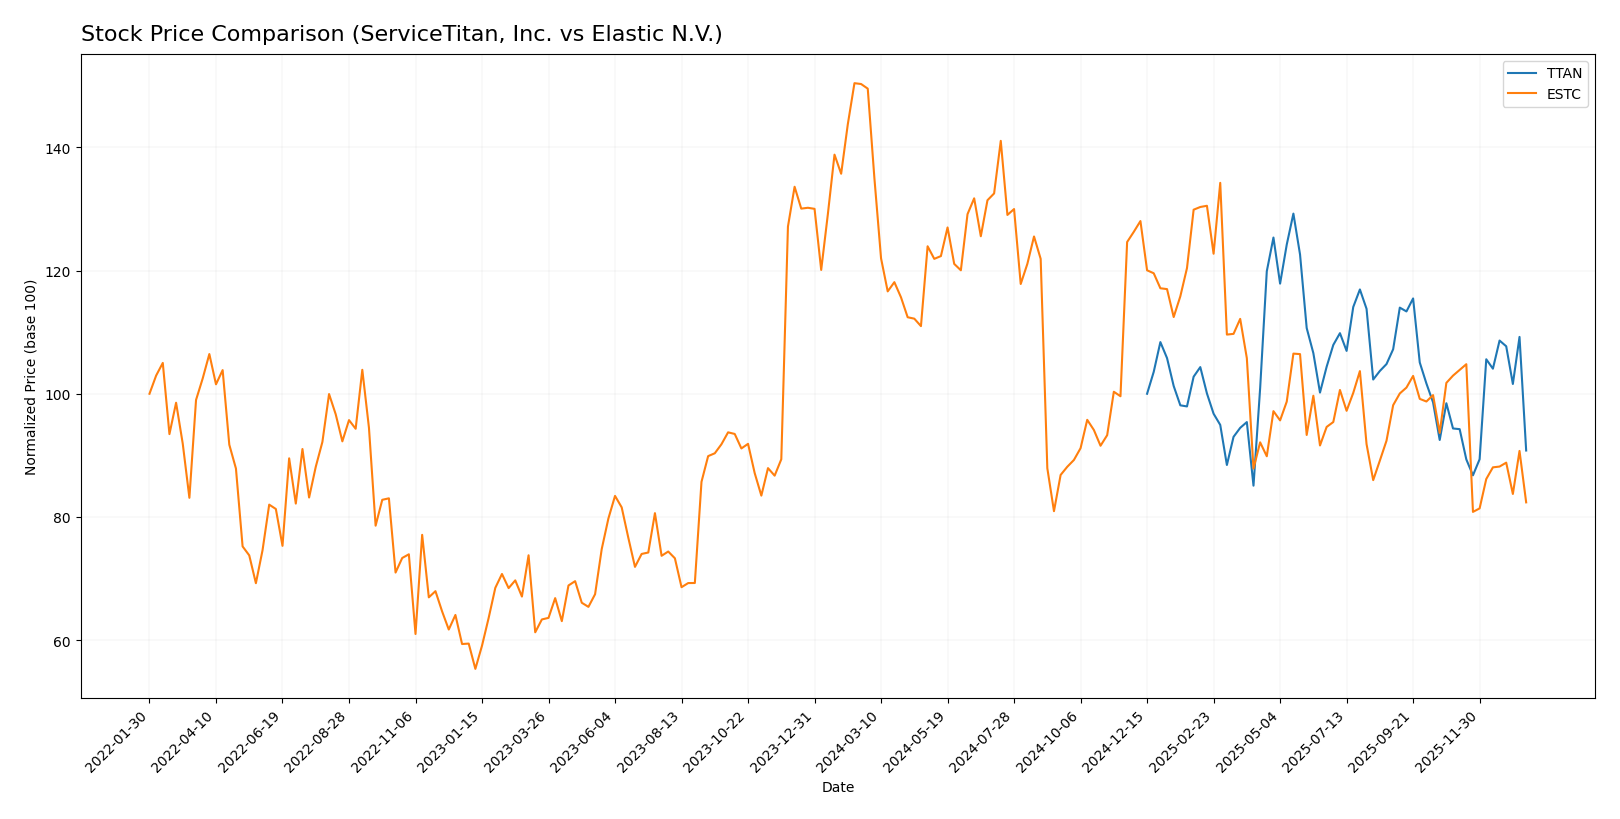
The stock price movements of ServiceTitan, Inc. (TTAN) and Elastic N.V. (ESTC) over the past 12 months reveal distinct bearish trends with varying degrees of price decline and trading dynamics.
Trend Analysis
ServiceTitan, Inc. (TTAN) experienced a 9.22% price decline over the past year, indicating a bearish trend with accelerating downward momentum. The stock showed price volatility with a standard deviation of 9.86 and traded between 85.07 and 129.26.
Elastic N.V. (ESTC) saw a sharper 44.93% drop, also bearish but with decelerating decline. Volatility was higher at 14.08 standard deviation, with prices ranging from 70.04 to 129.62 during the period.
Comparing both, ESTC’s stock delivered the lowest market performance with a significantly larger price drop than TTAN, despite stronger buyer dominance in trading volume.
Target Prices
The current analyst consensus for target prices shows promising upside potential for both ServiceTitan, Inc. and Elastic N.V.
| Company | Target High | Target Low | Consensus |
|---|---|---|---|
| ServiceTitan, Inc. | 145 | 117 | 132.44 |
| Elastic N.V. | 134 | 76 | 108 |
Analysts expect ServiceTitan’s stock to rise significantly from its current price of 90.78, while Elastic N.V.’s consensus target price of 108 also indicates notable upside from 71.38. These targets reflect positive market sentiment but investors should consider volatility and risks.
Analyst Opinions Comparison
This section compares analysts’ ratings and grades for ServiceTitan, Inc. and Elastic N.V.:
Rating Comparison
ServiceTitan, Inc. Rating
- Rating: C- with a very favorable status overall.
- Discounted Cash Flow Score: Very unfavorable at 1.
- ROE Score: Very unfavorable at 1, showing weak profit generation.
- ROA Score: Very unfavorable at 1, reflecting poor asset utilization.
- Debt To Equity Score: Moderate at 3, indicating moderate financial risk.
- Overall Score: Very unfavorable at 1.
Elastic N.V. Rating
- Rating: C- with a very favorable status overall.
- Discounted Cash Flow Score: Moderate at 3, indicating some value.
- ROE Score: Very unfavorable at 1, also indicating weak profit generation.
- ROA Score: Very unfavorable at 1, similarly poor asset utilization.
- Debt To Equity Score: Very unfavorable at 1, suggesting higher financial risk.
- Overall Score: Very unfavorable at 1.
Which one is the best rated?
Both companies share the same overall rating of C- and an overall score of 1, which is very unfavorable. ServiceTitan has a better debt-to-equity score, while Elastic shows a stronger discounted cash flow score. Overall, neither company stands out as clearly better rated based on these metrics.
Scores Comparison
Here is a comparison of the financial scores for ServiceTitan and Elastic N.V.:
ServiceTitan Scores
- Altman Z-Score: 15.74, indicating a strong safe zone
- Piotroski Score: 6, reflecting average financial health
Elastic N.V. Scores
- Altman Z-Score: 3.51, also in the safe zone but lower
- Piotroski Score: 4, indicating average financial health
Which company has the best scores?
ServiceTitan has higher Altman Z and Piotroski scores than Elastic N.V., suggesting stronger financial stability and health based on the provided data.
Grades Comparison
Here is a detailed comparison of the recent grades assigned to ServiceTitan, Inc. and Elastic N.V.:
ServiceTitan, Inc. Grades
The following table summarizes the latest grades from reputable grading companies for ServiceTitan, Inc.:
| Grading Company | Action | New Grade | Date |
|---|---|---|---|
| Piper Sandler | Maintain | Overweight | 2025-12-05 |
| BMO Capital | Maintain | Outperform | 2025-12-05 |
| TD Cowen | Maintain | Buy | 2025-12-05 |
| Morgan Stanley | Maintain | Equal Weight | 2025-12-05 |
| BMO Capital | Maintain | Outperform | 2025-11-20 |
| Wells Fargo | Maintain | Overweight | 2025-09-19 |
| Stifel | Maintain | Buy | 2025-09-19 |
| Piper Sandler | Maintain | Overweight | 2025-09-19 |
| Canaccord Genuity | Maintain | Buy | 2025-09-19 |
| Citigroup | Maintain | Neutral | 2025-09-09 |
The overall trend shows mostly positive ratings with multiple “Buy,” “Outperform,” and “Overweight” grades, indicating a generally favorable analyst sentiment toward ServiceTitan, Inc.
Elastic N.V. Grades
Here is a summary of the most recent grades from leading grading firms for Elastic N.V.:
| Grading Company | Action | New Grade | Date |
|---|---|---|---|
| Barclays | Maintain | Overweight | 2026-01-12 |
| RBC Capital | Maintain | Outperform | 2026-01-05 |
| Jefferies | Maintain | Buy | 2026-01-05 |
| Citigroup | Maintain | Buy | 2025-11-24 |
| Wedbush | Maintain | Outperform | 2025-11-21 |
| B of A Securities | Maintain | Neutral | 2025-11-21 |
| Guggenheim | Maintain | Buy | 2025-11-21 |
| Wells Fargo | Maintain | Equal Weight | 2025-11-21 |
| RBC Capital | Maintain | Outperform | 2025-11-21 |
| Canaccord Genuity | Maintain | Buy | 2025-11-21 |
Elastic N.V. also enjoys predominantly positive grades, with a strong presence of “Buy” and “Outperform” ratings, reflecting confidence from multiple well-known analysts.
Which company has the best grades?
Both ServiceTitan, Inc. and Elastic N.V. have received primarily “Buy” and “Outperform” grades, suggesting positive analyst sentiment for each. However, Elastic N.V. has a larger number of total buy-side ratings, which may indicate broader market confidence. Investors might interpret these grades as signals of growth potential and relative strength within their sectors.
Strengths and Weaknesses
Below is a comparison of key strengths and weaknesses for ServiceTitan, Inc. (TTAN) and Elastic N.V. (ESTC) based on recent financial and operational data.
| Criterion | ServiceTitan, Inc. (TTAN) | Elastic N.V. (ESTC) |
|---|---|---|
| Diversification | Moderate, primarily focused on platform and subscription revenues totaling ~1.3B USD in 2025 | Moderate, with significant subscription revenue (~1.38B USD) and growing professional services |
| Profitability | Unfavorable: Negative net margin (-31%), ROIC (-14%) well below WACC, value destroying | Unfavorable: Negative net margin (-7.3%), ROIC (-3.45%) below WACC but improving trend |
| Innovation | Moderate, platform-centric with subscription growth, but profitability issues limit R&D reinvestment | Strong innovation indicated by high fixed asset turnover (51.28) and growing profitability trend |
| Global presence | Limited data on global reach; current ratios suggest liquidity concerns | Better liquidity position (current ratio 1.92), indicating stable operations potentially supporting global expansion |
| Market Share | Niche in service management software with stable revenue streams | Expanding market share in search and analytics with strong subscription base growth |
Key takeaways: Both companies face profitability challenges and are currently value destroyers. Elastic shows a more promising trajectory with improving ROIC and stronger operational efficiency, while ServiceTitan’s financial health and profitability require close monitoring before considering investment.
Risk Analysis
Below is a summary table of key risks for ServiceTitan, Inc. (TTAN) and Elastic N.V. (ESTC) based on the latest 2025 data:
| Metric | ServiceTitan, Inc. (TTAN) | Elastic N.V. (ESTC) |
|---|---|---|
| Market Risk | Low beta (-0.85) suggests low market sensitivity, but negative financial returns add risk | Beta near 0.93 indicates moderate market sensitivity with volatile recent performance |
| Debt Level | Very low debt-to-equity (0.11), favorable leverage | Moderate debt-to-equity (0.64), neutral to moderate risk |
| Regulatory Risk | US-based, subject to standard tech regulations, no major issues reported | US-based with EU ties, potential multi-jurisdictional compliance complexity |
| Operational Risk | Negative profitability and returns indicate operational challenges | Negative margins and returns signal operational efficiency concerns |
| Environmental Risk | Limited exposure typical for software sector | Similar low environmental impact risk |
| Geopolitical Risk | Primarily US-focused, low geopolitical exposure | Some exposure due to international operations and multi-cloud environments |
In synthesis, both companies face significant operational risks due to negative profitability and returns on equity and assets. ServiceTitan benefits from a very low debt level and low market risk, reducing financial distress likelihood. Elastic’s higher debt and market sensitivity add to its risk profile. Neither shows material environmental or geopolitical threats. Monitoring operational improvements and debt management will be critical for investors.
Which Stock to Choose?
ServiceTitan, Inc. (TTAN) shows favorable income growth with a 65% revenue increase over 2023-2025 but suffers from negative profitability ratios, including a -16.4% ROE and a net margin of -31%. Its debt levels are low, with a debt-to-assets ratio of 9.35%, but the company is currently destroying value as ROIC is well below WACC, reflected in a slightly unfavorable global ratios opinion and a very favorable rating despite weak operational scores.
Elastic N.V. (ESTC) presents solid income growth, with 144% revenue growth overall and a gross margin of 74%, yet profitability remains negative, with a -11.7% ROE and net margin of -7.3%. Debt is higher than TTAN’s but manageable, with a debt-to-assets ratio of 22.95%. ESTC is also shedding value, though its ROIC trend is improving. Its financial ratios evaluation is neutral, and the company holds a very favorable rating but with several unfavorable component scores.
For investors prioritizing growth potential, ESTC’s stronger revenue expansion and improving profitability trend might appear more attractive, while those focused on lower leverage and a more stable financial structure could lean toward TTAN. Both companies exhibit value destruction currently, so risk-tolerant investors may weigh their relative income and ratio trends cautiously, whereas risk-averse profiles might find neither ideally positioned at present.
Disclaimer: Investment carries a risk of loss of initial capital. The past performance is not a reliable indicator of future results. Be sure to understand risks before making an investment decision.
Go Further
I encourage you to read the complete analyses of ServiceTitan, Inc. and Elastic N.V. to enhance your investment decisions: