Home > Comparison > Technology > NOW vs ESTC
The strategic rivalry between ServiceNow, Inc. and Elastic N.V. shapes the evolution of enterprise software solutions. ServiceNow, a market-leading cloud workflow automation giant, contrasts with Elastic’s agile, data-centric search and analytics platform. This head-to-head centers on scale-driven operational breadth versus specialized innovation. This analysis will determine which company’s trajectory offers the superior risk-adjusted return for a diversified portfolio navigating the dynamic technology sector.
Table of contents
Companies Overview
ServiceNow and Elastic stand as pivotal players in the software application industry with distinct market footprints.
ServiceNow, Inc.: Enterprise Cloud Workflow Leader
ServiceNow dominates the enterprise cloud computing space with its Now platform, automating workflows across IT, HR, security, and customer service. Its core revenue stems from subscription-based software solutions that integrate AI, machine learning, and robotic process automation. In 2026, ServiceNow focuses strategically on expanding automation capabilities through partnerships, notably with Celonis, to enhance process optimization.
Elastic N.V.: Multi-Cloud Search Innovator
Elastic specializes in search and data analytics software built for multi-cloud environments. Its flagship Elastic Stack ingests, stores, and analyzes diverse datasets while offering visualization and monitoring tools. In 2026, Elastic prioritizes platform enhancements that unify its product portfolio, aiming to improve data processing and search capabilities in real time across distributed systems.
Strategic Collision: Similarities & Divergences
Both companies compete in the technology sector but diverge in approach: ServiceNow offers a comprehensive workflow automation ecosystem, while Elastic delivers open, scalable search infrastructure. Their primary battleground lies in enterprise IT optimization—ServiceNow through end-to-end service automation, Elastic via flexible data search and analytics. Each presents a unique investment profile shaped by scale, innovation focus, and market penetration.
Income Statement Comparison
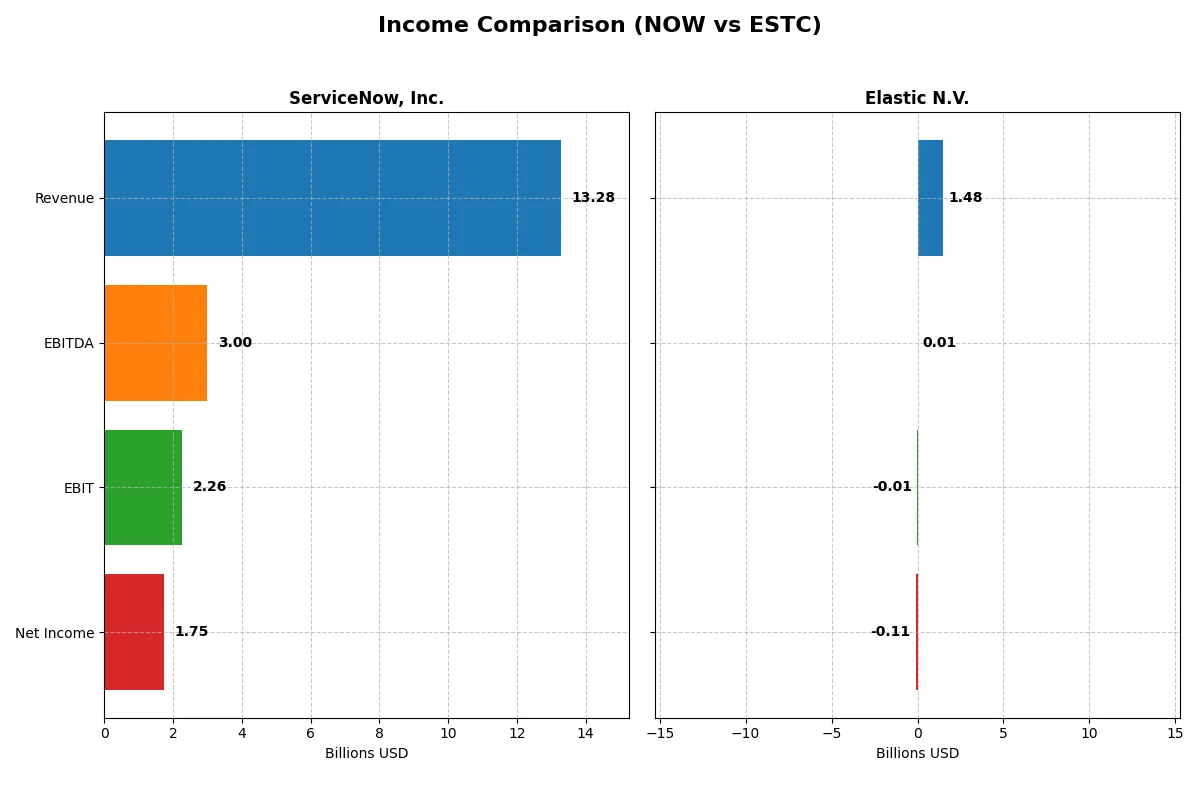
This data dissects the core profitability and scalability of both corporate engines to reveal who dominates the bottom line:
| Metric | ServiceNow, Inc. (NOW) | Elastic N.V. (ESTC) |
|---|---|---|
| Revenue | 13.3B | 1.48B |
| Cost of Revenue | 2.98B | 380M |
| Operating Expenses | 8.47B | 1.16B |
| Gross Profit | 10.3B | 1.10B |
| EBITDA | 3.00B | 6.1M |
| EBIT | 2.26B | -6.3M |
| Interest Expense | 0 | 25M |
| Net Income | 1.75B | -108M |
| EPS | 1.69 | -1.04 |
| Fiscal Year | 2025 | 2025 |
Income Statement Analysis: The Bottom-Line Duel
This income statement comparison reveals which company converts revenue into profit most efficiently, exposing the true strength of each corporate engine.
ServiceNow, Inc. Analysis
ServiceNow shows robust growth, with revenue rising from $5.9B in 2021 to $13.3B in 2025. Net income surged 660% over this period, reaching $1.75B in 2025. Its gross margin holds strong at 77.5%, and net margin at 13.2% remains favorable. The company’s operating efficiency accelerated in 2025, with EBIT growing 28% year-over-year, reflecting powerful momentum.
Elastic N.V. Analysis
Elastic’s revenue grew from $608M in 2021 to $1.48B in 2025, a 144% increase. However, net income remains negative at -$108M in 2025 despite a favorable gross margin of 74.4%. EBIT margin stays in the red at -0.4%. While revenue and gross profit grew steadily, Elastic struggles to translate top-line gains into profitability, showing uneven efficiency and ongoing operational challenges.
Growth and Profitability: Dominant Scale vs. Emerging Struggles
ServiceNow outpaces Elastic decisively in profit generation and margin preservation, turning rapid revenue growth into strong earnings. Elastic achieves impressive revenue growth but fails to convert it into net profits, signaling margin pressure and operational inefficiencies. Investors seeking consistent profitability will find ServiceNow’s profile more compelling, while Elastic remains a higher-risk growth story.
Financial Ratios Comparison
These vital ratios act as a diagnostic tool to expose the underlying fiscal health, valuation premiums, and capital efficiency of ServiceNow, Inc. and Elastic N.V.:
| Ratios | ServiceNow (NOW) | Elastic N.V. (ESTC) |
|---|---|---|
| ROE | 13.5% | -11.7% |
| ROIC | 9.0% | -3.4% |
| P/E | 90.9 | -82.7 |
| P/B | 12.3 | 9.6 |
| Current Ratio | 0.95 | 1.92 |
| Quick Ratio | 0.95 | 1.92 |
| D/E (Debt-to-Equity) | 0.25 | 0.64 |
| Debt-to-Assets | 12.3% | 22.9% |
| Interest Coverage | 0 (not reported) | -2.17 |
| Asset Turnover | 0.51 | 0.57 |
| Fixed Asset Turnover | 4.29 | 51.28 |
| Payout Ratio | 0% | 0% |
| Dividend Yield | 0% | 0% |
| Fiscal Year | 2025 | 2025 |
Efficiency & Valuation Duel: The Vital Signs
Ratios act as the company’s DNA, revealing hidden risks and operational excellence that numbers alone cannot capture.
ServiceNow, Inc.
ServiceNow posts solid profitability with a 13.48% ROE and favorable 13.16% net margin. Its valuation is stretched, reflected by a high P/E of 90.88 and P/B of 12.25. The company does not pay dividends, instead reinvesting heavily in R&D (22.3% of revenue), focusing on long-term growth.
Elastic N.V.
Elastic suffers negative profitability metrics: -11.66% ROE and a -7.29% net margin. Despite a low P/E of -82.65, indicating valuation distortion, its current ratio of 1.92 signals strong liquidity. Elastic returns no dividends, prioritizing R&D investments at 24.7% of revenue to fuel future expansion.
Premium Valuation vs. Operational Challenges
ServiceNow delivers robust returns but trades at rich multiples, posing valuation risk. Elastic offers better liquidity but struggles with persistent losses and weak returns. Investors seeking growth and stability may lean toward ServiceNow, while those tolerating risk for turnaround potential might consider Elastic.
Which one offers the Superior Shareholder Reward?
I observe that both ServiceNow (NOW) and Elastic (ESTC) pay no dividends, focusing instead on growth and reinvestment. ServiceNow boasts robust free cash flow per share at $4.4B and maintains a strong buyback program, enhancing shareholder value sustainably. Elastic, while showing improving free cash flow at $2.5B, struggles with negative net margins and erratic profitability, relying on minimal buybacks. Given ServiceNow’s superior cash flow generation, conservative leverage, and consistent capital allocation, I conclude it offers a more attractive total return profile in 2026.
Comparative Score Analysis: The Strategic Profile
The radar chart reveals the fundamental DNA and trade-offs of ServiceNow, Inc. and Elastic N.V. by comparing their financial strengths and valuation profiles:
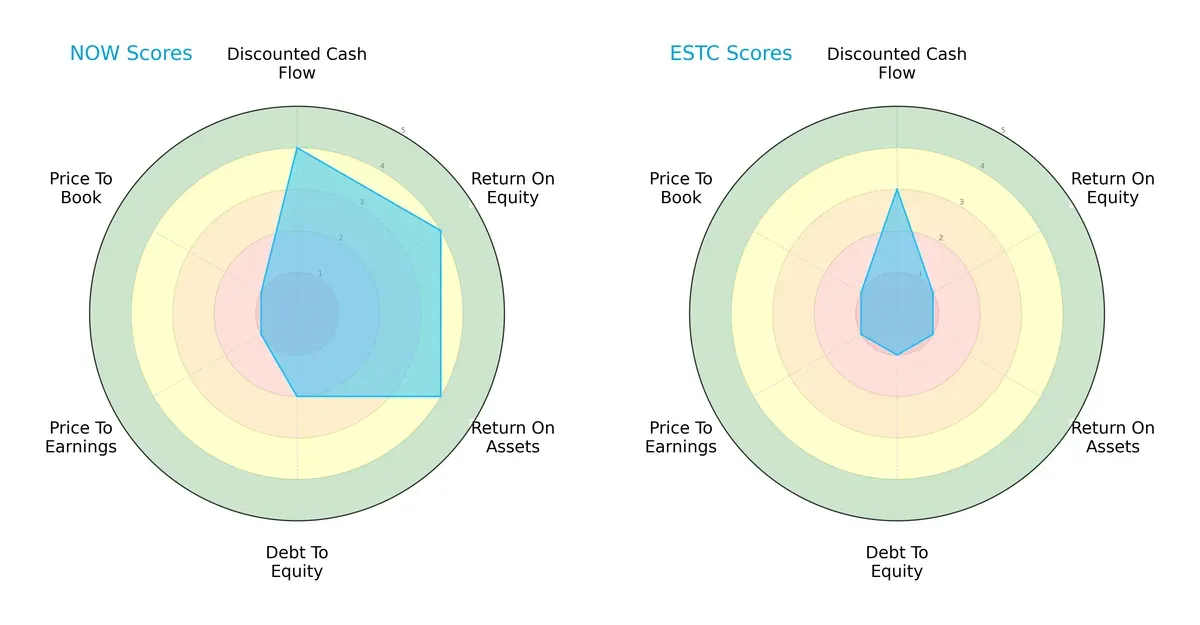
ServiceNow dominates in profitability metrics with strong ROE and ROA scores of 4, reflecting efficient asset and equity utilization. Elastic lags significantly with scores of 1, showing operational challenges. ServiceNow’s debt-to-equity score (2) is moderate, indicating manageable leverage, whereas Elastic’s 1 signals higher financial risk. Both struggle with valuation, scoring 1 on P/E and P/B, but ServiceNow presents a more balanced profile supported by a favorable discounted cash flow score of 4. Elastic relies heavily on a single edge: moderate DCF at 3, but overall financial health is weaker.
Bankruptcy Risk: Solvency Showdown
The Altman Z-Score gap highlights ServiceNow’s superior solvency and resilience compared to Elastic in this market cycle:
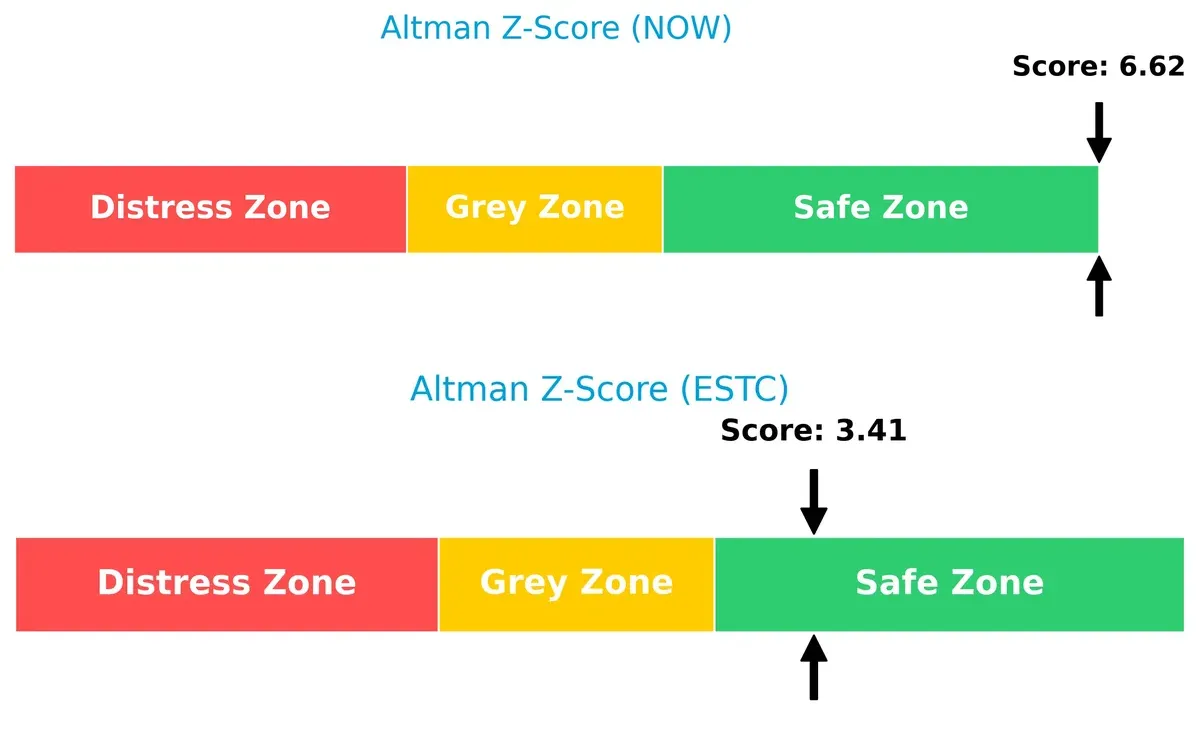
ServiceNow’s robust Z-Score of 6.6 places it firmly in the safe zone, signaling low bankruptcy risk and strong financial stability. Elastic’s score of 3.4 also lies in the safe zone but much closer to the grey area, indicating moderate vulnerability under stress. Investors should weigh ServiceNow’s stronger buffer against economic downturns.
Financial Health: Quality of Operations
Both firms score an identical Piotroski F-Score of 4, indicating average financial health without clear dominance:
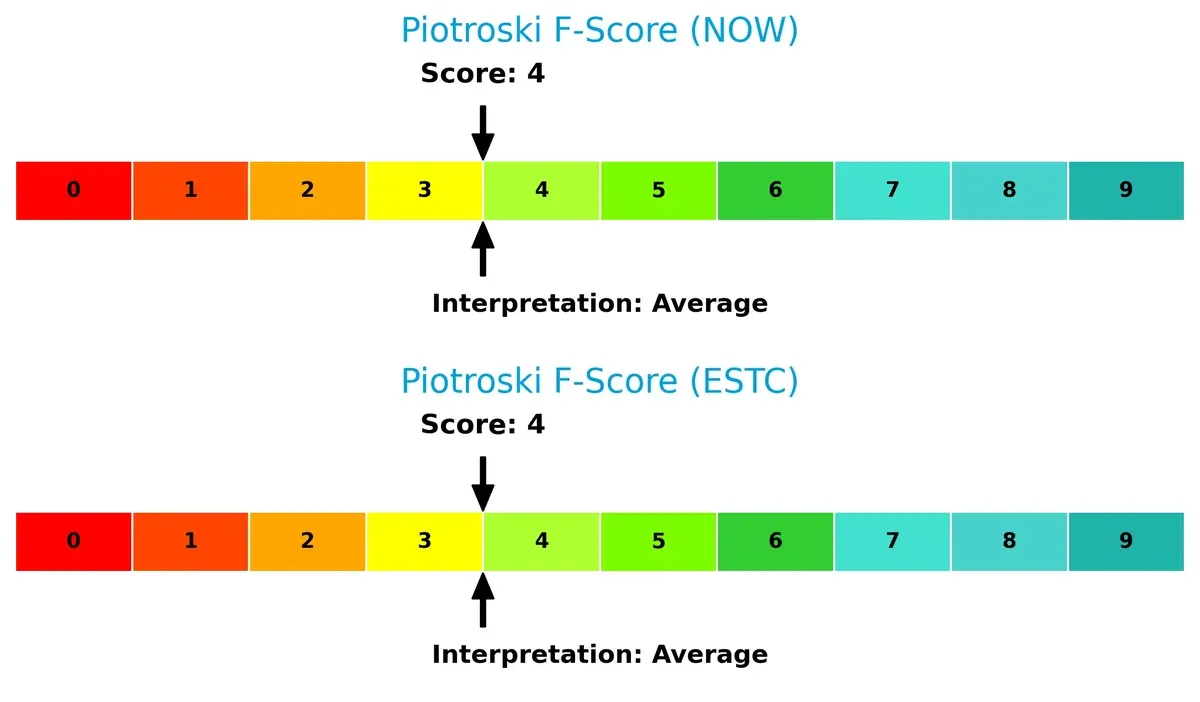
A score of 4 on the 0–9 scale suggests neither company currently excels in operational quality or internal financial robustness. This parity signals caution, as both show room for improvement in profitability, leverage, and liquidity metrics that drive long-term value creation. Investors should monitor these scores closely for any emerging red flags.
How are the two companies positioned?
This section dissects the operational DNA of ServiceNow and Elastic by comparing their revenue distribution and internal strengths and weaknesses. The goal is to confront their economic moats and identify which model delivers the most resilient, sustainable advantage today.
Revenue Segmentation: The Strategic Mix
This visual comparison dissects how ServiceNow and Elastic diversify their income streams and reveals their primary sector bets for 2025:
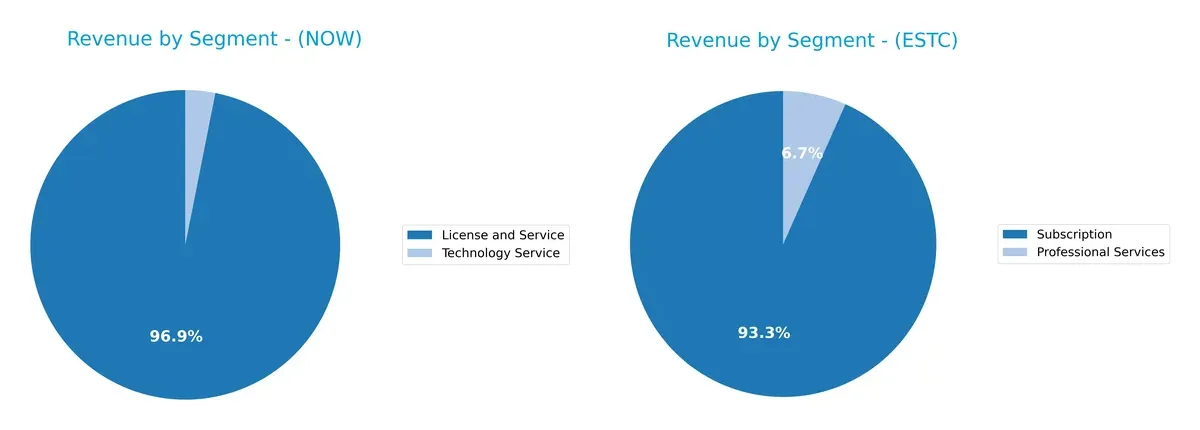
ServiceNow anchors its revenue in “License and Service,” generating $12.9B, dwarfing its $414M Technology Service segment. This concentration signals strong ecosystem lock-in in digital workflows. Elastic, by contrast, earns $1.38B from Subscription and $99M from Professional Services, showing a more balanced mix. Elastic’s diversification reduces concentration risk, while ServiceNow’s dominance in licensing reflects infrastructure strength and scalability.
Strengths and Weaknesses Comparison
This table compares the strengths and weaknesses of ServiceNow and Elastic based on diversification, profitability, financials, innovation, global presence, and market share:
ServiceNow Strengths
- Strong revenue growth in License and Service segments
- Favorable debt to equity and interest coverage ratios
- Large global presence with significant North America and EMEA revenue
- High fixed asset turnover indicating efficient asset use
Elastic Strengths
- Favorable weighted average cost of capital (WACC) and price-to-earnings (PE) ratio
- Solid current and quick ratios reflecting good liquidity
- High fixed asset turnover suggests strong operational efficiency
- Balanced revenue mix between US and non-US markets
ServiceNow Weaknesses
- Unfavorable price-to-earnings (PE) and price-to-book (PB) ratios indicate high valuation
- Current ratio below 1 signals potential short-term liquidity risk
- Zero dividend yield may deter income-focused investors
- Neutral return on equity (ROE) and return on invested capital (ROIC)
Elastic Weaknesses
- Negative net margin, ROE, and ROIC reflect ongoing unprofitability
- Unfavorable interest coverage ratio raises solvency concerns
- Unfavorable price-to-book (PB) ratio
- Zero dividend yield limits investor income options
ServiceNow exhibits robust financial health with strong global reach but faces valuation and liquidity concerns. Elastic shows operational efficiency and liquidity strengths but struggles with profitability and solvency metrics. Both companies must navigate these factors in their strategic planning.
The Moat Duel: Analyzing Competitive Defensibility
A structural moat is the only thing protecting long-term profits from relentless competition and margin erosion. Let’s dissect the competitive moats of these two software firms:
ServiceNow, Inc.: Workflow Automation Lock-in
ServiceNow’s moat stems from high switching costs embedded in enterprise workflow automation. Its 17% EBIT margin and 20%+ revenue growth reflect strong margin stability. Expansion into AI-driven automation in 2026 could deepen this advantage.
Elastic N.V.: Open-Source Ecosystem with Scale Challenges
Elastic’s moat is its open-source ecosystem, driving network effects but less locking power than ServiceNow’s. Negative EBIT margin signals profit challenges despite 17% revenue growth. Focus on multi-cloud analytics may fuel future disruption or margin recovery.
The Moat Verdict: Switching Costs vs. Open Ecosystem
ServiceNow’s switching cost moat is wider and more durable, supported by stable profitability and expanding AI capabilities. Elastic’s network effect grows but struggles to convert scale into profits. ServiceNow is better positioned to defend its market share in 2026.
Which stock offers better returns?
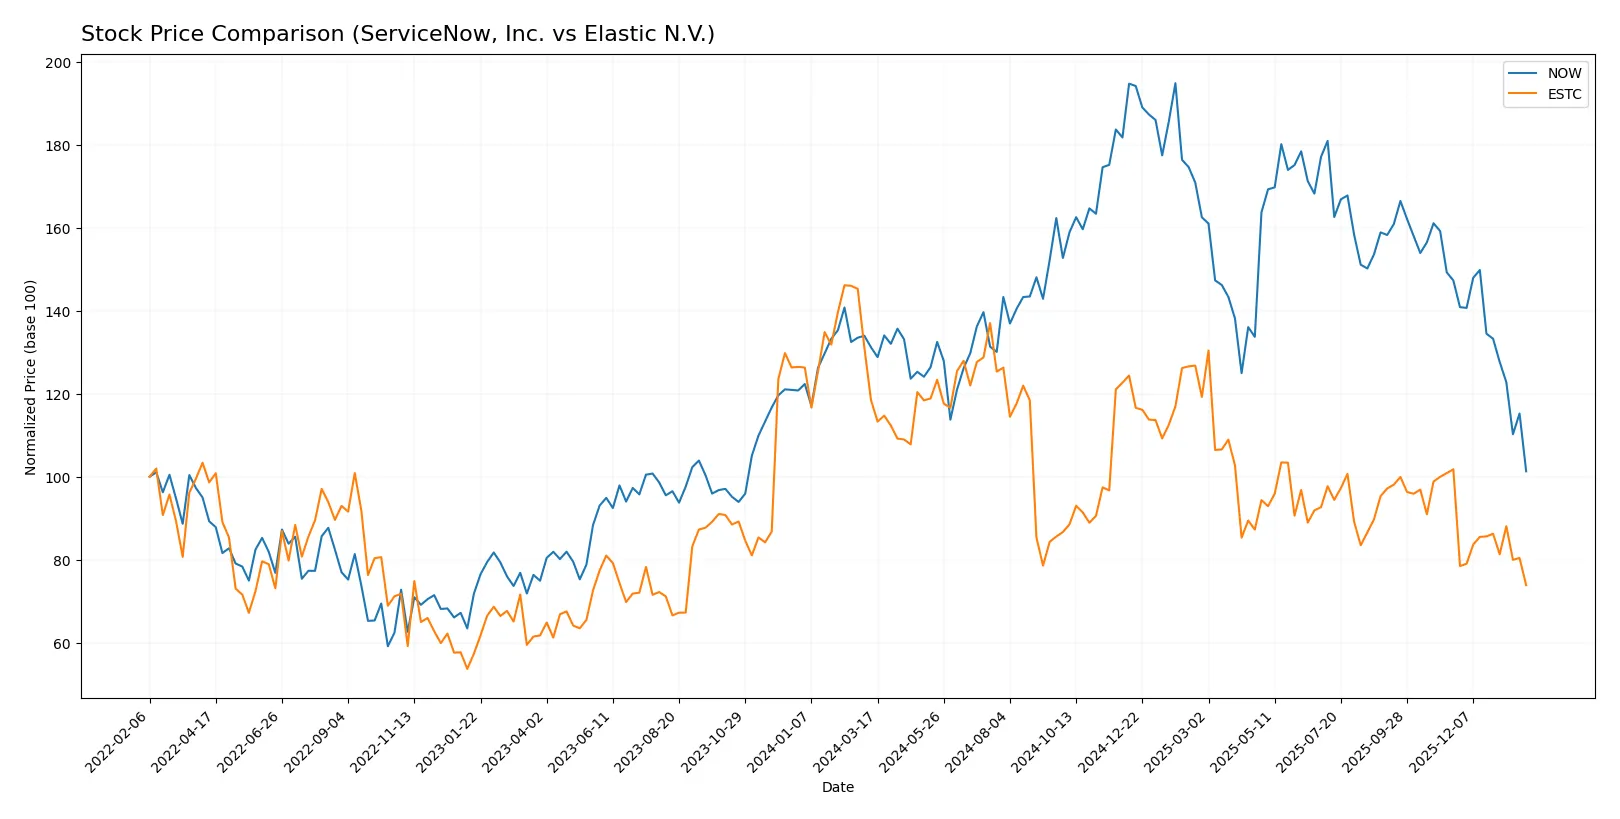
Over the past 12 months, both ServiceNow, Inc. and Elastic N.V. experienced notable price declines, with ServiceNow showing higher volatility and wider price swings.
Trend Comparison
ServiceNow, Inc. posted a 22.79% price decline over the past year, reflecting a bearish trend with decelerating losses and high volatility, hitting a low of 117.01 and a high of 225.0.
Elastic N.V. recorded a steeper 37.64% drop, also bearish with deceleration, lower volatility, a low near 65.93, and a high at 122.27 over the same period.
ServiceNow outperformed Elastic in relative terms despite both falling, showing less severe depreciation and higher recent trading volume.
Target Prices
Analyst consensus on target prices shows a broad range, reflecting varied outlooks for these tech companies.
| Company | Target Low | Target High | Consensus |
|---|---|---|---|
| ServiceNow, Inc. | 115 | 1315 | 440.14 |
| Elastic N.V. | 76 | 134 | 108 |
Targets for ServiceNow vary widely, with consensus far above its current 117 price, indicating optimism. Elastic’s consensus target at 108 also exceeds its current 66 price, suggesting growth expectations despite recent volatility.

Don’t Let Luck Decide Your Entry Point
Optimize your entry points with our advanced ProRealTime indicators. You’ll get efficient buy signals with precise price targets for maximum performance. Start outperforming now!
How do institutions grade them?
ServiceNow, Inc. Grades
The following table summarizes recent grades issued by major institutions for ServiceNow, Inc.:
| Grading Company | Action | New Grade | Date |
|---|---|---|---|
| Citigroup | Maintain | Buy | 2026-01-30 |
| BTIG | Maintain | Buy | 2026-01-29 |
| Stifel | Maintain | Buy | 2026-01-29 |
| RBC Capital | Maintain | Outperform | 2026-01-29 |
| Macquarie | Maintain | Neutral | 2026-01-29 |
| DA Davidson | Maintain | Buy | 2026-01-29 |
| Needham | Maintain | Buy | 2026-01-29 |
| Keybanc | Maintain | Underweight | 2026-01-29 |
| Evercore ISI Group | Maintain | Outperform | 2026-01-29 |
| Cantor Fitzgerald | Maintain | Overweight | 2026-01-29 |
Elastic N.V. Grades
Recent institutional grades for Elastic N.V. are listed in the following table:
| Grading Company | Action | New Grade | Date |
|---|---|---|---|
| Rosenblatt | Maintain | Buy | 2026-01-30 |
| Barclays | Maintain | Overweight | 2026-01-12 |
| Jefferies | Maintain | Buy | 2026-01-05 |
| RBC Capital | Maintain | Outperform | 2026-01-05 |
| Citigroup | Maintain | Buy | 2025-11-24 |
| Jefferies | Maintain | Buy | 2025-11-21 |
| B of A Securities | Maintain | Neutral | 2025-11-21 |
| Rosenblatt | Maintain | Buy | 2025-11-21 |
| Cantor Fitzgerald | Maintain | Neutral | 2025-11-21 |
| Guggenheim | Maintain | Buy | 2025-11-21 |
Which company has the best grades?
ServiceNow holds predominantly “Buy” and “Outperform” ratings from top firms, with a few neutral and underweight calls. Elastic N.V. also maintains mostly “Buy” and “Outperform” grades, alongside some neutral and overweight opinions. ServiceNow’s broader consensus of “Buy” and “Outperform” grades may suggest stronger institutional confidence, potentially influencing investor sentiment toward stability and growth prospects.
Risks specific to each company
The following categories identify the critical pressure points and systemic threats facing both firms in the 2026 market environment:
1. Market & Competition
ServiceNow, Inc.
- Dominates enterprise cloud workflow automation with strong partnerships, but faces intense competition from large tech firms.
Elastic N.V.
- Niche player in search and analytics software, challenged by bigger cloud providers and open-source alternatives.
2. Capital Structure & Debt
ServiceNow, Inc.
- Prudent leverage with debt-to-equity at 0.25; strong interest coverage reduces default risk.
Elastic N.V.
- Higher leverage at 0.64 debt-to-equity and negative interest coverage signals financial strain.
3. Stock Volatility
ServiceNow, Inc.
- Beta near 1 (0.979) suggests market-level volatility, manageable for long-term investors.
Elastic N.V.
- Slightly lower beta (0.925) but price range volatility wider, reflecting market uncertainty.
4. Regulatory & Legal
ServiceNow, Inc.
- Operates globally with compliance demands in multiple sectors; legal risks moderate.
Elastic N.V.
- Faces evolving data privacy and security regulations, increasing compliance costs.
5. Supply Chain & Operations
ServiceNow, Inc.
- Robust cloud infrastructure and direct sales model reduce supply chain risks.
Elastic N.V.
- Multi-cloud strategy adds complexity but enhances resilience; operational scale smaller.
6. ESG & Climate Transition
ServiceNow, Inc.
- Increasing focus on governance and sustainability; growing investor scrutiny.
Elastic N.V.
- ESG policies developing; risks stem from energy use in data centers and regulatory pressure.
7. Geopolitical Exposure
ServiceNow, Inc.
- Global footprint exposes it to US-China tensions and data sovereignty laws.
Elastic N.V.
- Similar geopolitical risks; smaller scale may limit direct impact but restricts growth markets.
Which company shows a better risk-adjusted profile?
ServiceNow’s strongest risk is its high valuation multiples and tight liquidity ratio, posing vulnerability in market downturns. Elastic’s most pressing risk is its negative profitability and weak interest coverage, threatening solvency. ServiceNow’s robust capital structure and safer Altman Z-Score support a better risk-adjusted profile. Elastic’s financial distress indicators and weaker ratings warrant caution despite favorable leverage metrics. The stark contrast in profitability and balance sheet strength justifies my concern for Elastic’s sustainability.
Final Verdict: Which stock to choose?
ServiceNow’s superpower lies in its robust growth engine and improving profitability. It demonstrates efficient capital use that’s steadily enhancing its return metrics. The point of vigilance is its stretched valuation and below-par liquidity, which could pressure downside in volatile markets. It suits portfolios aiming for aggressive growth with a tolerance for high multiples.
Elastic’s strategic moat is its potential to leverage recurring revenue streams in a niche market. Despite current losses, it maintains a strong liquidity position offering relative safety compared to ServiceNow. Elastic fits investors favoring GARP strategies, willing to weather short-term earnings volatility for possible sustainable long-term upside.
If you prioritize consistent growth and improving profitability, ServiceNow outshines due to its scalable business model and rising ROIC. However, if you seek relative balance with a stronger liquidity cushion and a moderate risk profile, Elastic offers better stability amid its turnaround efforts. Both present analytical scenarios shaped by risk tolerance and investment horizon.
Disclaimer: Investment carries a risk of loss of initial capital. The past performance is not a reliable indicator of future results. Be sure to understand risks before making an investment decision.
Go Further
I encourage you to read the complete analyses of ServiceNow, Inc. and Elastic N.V. to enhance your investment decisions: