In the competitive world of household and personal products, Kenvue Inc. and Edgewell Personal Care Company stand out as key players shaping consumer trends. Both companies boast diverse brand portfolios and global reach, yet they differ in market capitalization, innovation strategies, and segment focus. This comparison explores their strengths and risks, helping you decide which company could be the most promising addition to your investment portfolio. Let’s dive into the details to find your best opportunity.
Table of contents
Companies Overview
I will begin the comparison between Kenvue Inc. and Edgewell Personal Care Company by providing an overview of these two companies and their main differences.
Kenvue Inc. Overview
Kenvue Inc. operates globally as a consumer health company, focusing on three segments: Self Care, Skin Health and Beauty, and Essential Health. Its product portfolio includes well-known brands such as Tylenol, Neutrogena, and Band-Aid. The company, headquartered in Skillman, NJ, is a subsidiary of Johnson & Johnson and has a market cap of about 32.6B USD.
Edgewell Personal Care Company Overview
Edgewell Personal Care Company manufactures and markets personal care products worldwide, divided into three segments: Wet Shave, Sun and Skin Care, and Feminine Care. Its brand portfolio includes Schick, Banana Boat, and Playtex. Founded in 1772 and headquartered in Shelton, CT, Edgewell has a market cap around 847M USD and employs 6,700 people.
Key similarities and differences
Both companies operate in the Household & Personal Products industry with diversified product lines targeting personal care. Kenvue focuses more on health-related consumer products under large global brands, while Edgewell emphasizes shaving and skin care with a mix of established niche brands. Kenvue is significantly larger in market capitalization and workforce size compared to Edgewell.
Income Statement Comparison
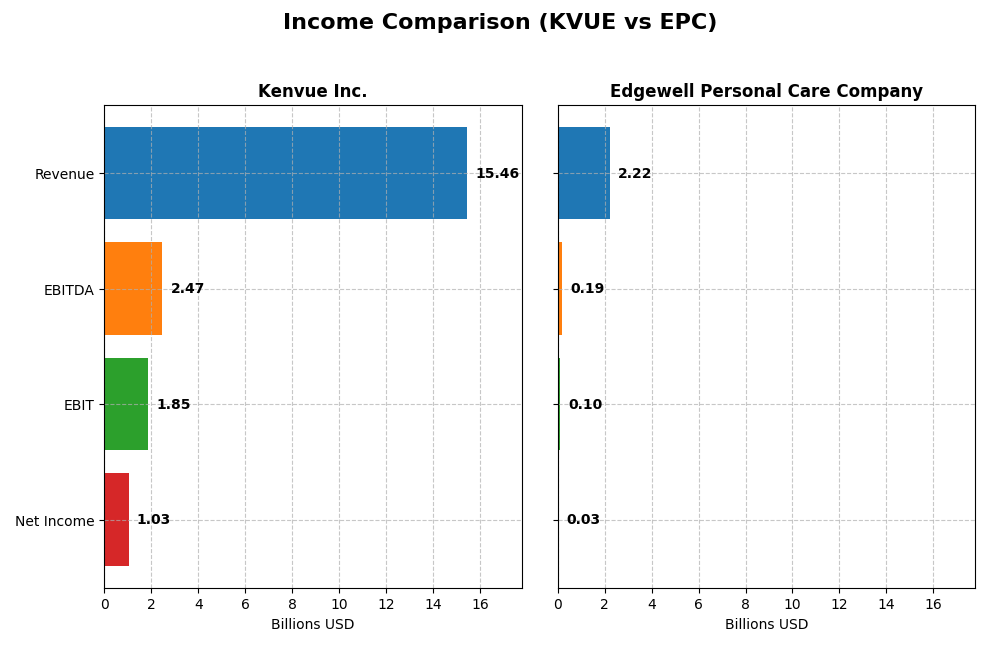
This table presents a side-by-side comparison of the most recent fiscal year income statement metrics for Kenvue Inc. and Edgewell Personal Care Company.
| Metric | Kenvue Inc. | Edgewell Personal Care Company |
|---|---|---|
| Market Cap | 32.6B | 847M |
| Revenue | 15.5B | 2.2B |
| EBITDA | 2.47B | 186M |
| EBIT | 1.85B | 97M |
| Net Income | 1.03B | 25.4M |
| EPS | 0.54 | 0.53 |
| Fiscal Year | 2024 | 2025 |
Income Statement Interpretations
Kenvue Inc.
Kenvue’s revenue showed a modest increase of 6.83% over 2020-2024, with net income growing strongly by 217.18%. Margins remain favorable, highlighted by a 57.97% gross margin and 6.66% net margin. However, in 2024, revenue growth slowed to 0.07%, with net income and EBIT margins declining significantly, signaling recent margin pressure.
Edgewell Personal Care Company
Edgewell’s revenue grew modestly at 6.53% from 2021 to 2025, but net income fell substantially by 78.44%. Gross margin remained favorable at 41.6%, yet EBIT and net margins were only neutral to low at 4.35% and 1.14%, respectively. The latest year showed declines in revenue (-1.34%) and net income (-73.89%), reflecting challenges in profitability.
Which one has the stronger fundamentals?
Kenvue exhibits stronger fundamentals with consistent favorable margins and significant net income growth over the period, despite recent earnings softness. Edgewell’s income statement reflects weaker fundamentals with substantial net income decline and margin contraction. Overall, Kenvue’s income profile is more robust, supported by better margin stability and growth trends.
Financial Ratios Comparison
The table below presents the most recent key financial ratios for Kenvue Inc. and Edgewell Personal Care Company, providing a snapshot of their profitability, liquidity, leverage, and efficiency as of their latest fiscal years.
| Ratios | Kenvue Inc. (2024) | Edgewell Personal Care Company (2025) |
|---|---|---|
| ROE | 10.7% | 1.6% |
| ROIC | 6.2% | 3.0% |
| P/E | 39.4 | 38.1 |
| P/B | 4.20 | 0.62 |
| Current Ratio | 0.96 | 1.76 |
| Quick Ratio | 0.69 | 0.90 |
| D/E (Debt-to-Equity) | 0.90 | 0.91 |
| Debt-to-Assets | 34.1% | 37.6% |
| Interest Coverage | 4.27 | 1.32 |
| Asset Turnover | 0.60 | 0.59 |
| Fixed Asset Turnover | 8.36 | 6.02 |
| Payout Ratio | 151% | 115% |
| Dividend Yield | 3.83% | 3.03% |
Interpretation of the Ratios
Kenvue Inc.
Kenvue’s ratios present a mixed picture with neutral net margin (6.66%) and return on equity (10.65%), but unfavorable valuation metrics including a high PE of 39.38 and PB of 4.2. Liquidity ratios are weak, with a current ratio below 1. Dividend yield stands at a favorable 3.83%, indicating steady shareholder returns supported by dividend payments, though some caution is warranted due to liquidity concerns.
Edgewell Personal Care Company
Edgewell shows weak profitability ratios with a low net margin of 1.14% and ROE at 1.64%, alongside unfavorable interest coverage of 1.32, indicating potential financial risk. However, valuation metrics such as PB at 0.62 and liquidity ratios including a current ratio of 1.76 are favorable. The dividend yield is 3.03%, reflecting ongoing payouts despite moderate profitability challenges.
Which one has the best ratios?
Edgewell exhibits a more balanced ratio profile with stronger liquidity and valuation metrics, though profitability remains weak. Kenvue offers higher profitability and dividend yield but suffers from weak liquidity and expensive valuation multiples. Overall, Edgewell’s neutral global ratio opinion contrasts with Kenvue’s slightly unfavorable stance, reflecting differing risk and return trade-offs.
Strategic Positioning
This section compares the strategic positioning of Kenvue Inc. and Edgewell Personal Care Company, including market position, key segments, and exposure to disruption:
Kenvue Inc.
- Large market cap of 32.6B with moderate competitive pressure in Household & Personal Products.
- Operates three broad segments: Self Care, Skin Health & Beauty, Essential Health.
- Exposure to disruption not explicitly detailed in data provided.
Edgewell Personal Care Company
- Smaller market cap of 847M, facing competitive pressure in personal care segments.
- Focused on Wet Shave, Sun & Skin Care, and Feminine Care segments.
- Exposure to disruption not explicitly detailed in data provided.
Kenvue Inc. vs Edgewell Personal Care Company Positioning
Kenvue maintains a diversified portfolio across consumer health categories, while Edgewell concentrates on personal care subsegments like razors and feminine care. Kenvue’s larger scale may provide broader market reach; Edgewell’s focus could imply specialization but less diversification.
Which has the best competitive advantage?
Based on MOAT evaluation, Kenvue shows slightly favorable positioning with growing profitability despite some value shedding, whereas Edgewell exhibits a very unfavorable status with declining profitability and value destruction.
Stock Comparison
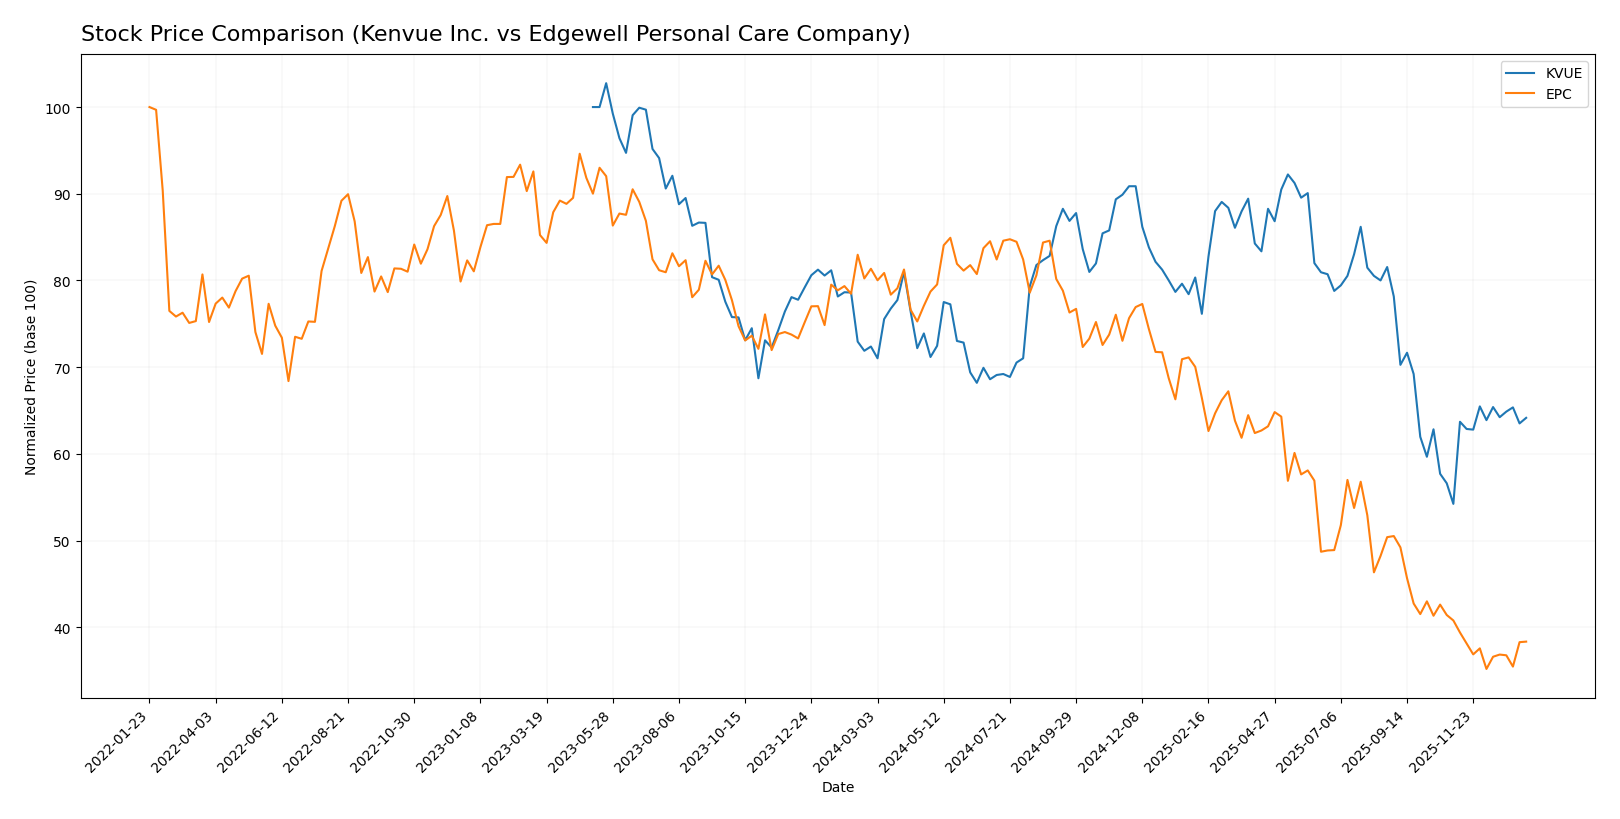
The stock prices of Kenvue Inc. and Edgewell Personal Care Company have shown significant bearish trends over the past year, with Kenvue experiencing moderate decline and recent recovery, while Edgewell faced a steep drop and continued weakness.
Trend Analysis
Kenvue Inc. (KVUE) posted an overall bearish trend with an 11.37% price decline over the past 12 months, showing acceleration and a recent rebound of 18.3% in the last 2.5 months. Edgewell Personal Care Company (EPC) experienced a sharper 52.87% price drop with accelerating bearish momentum and a further recent decline of 5.98%. Comparing both, Kenvue delivered higher market performance, exhibiting a less severe overall loss and a recent uptrend, unlike Edgewell’s ongoing downward trajectory.
Target Prices
The target price consensus for Kenvue Inc. and Edgewell Personal Care Company suggests moderate upside potential.
| Company | Target High | Target Low | Consensus |
|---|---|---|---|
| Kenvue Inc. | 23 | 15 | 18.57 |
| Edgewell Personal Care Company | 23 | 20 | 21.5 |
Analysts expect Kenvue’s stock to trade slightly above the current $17 price, while Edgewell’s consensus target of $21.5 indicates a more optimistic outlook compared to its $18.23 market price.
Analyst Opinions Comparison
This section compares analysts’ ratings and grades for Kenvue Inc. and Edgewell Personal Care Company:
Rating Comparison
Kenvue Inc. Rating
- Rating: B+ with a very favorable overall evaluation.
- Discounted Cash Flow Score: 4, indicating favorable DCF.
- ROE Score: 4, showing favorable efficiency in equity use.
- ROA Score: 4, showing favorable asset utilization.
- Debt To Equity Score: 2, indicating moderate financial risk.
- Overall Score: 3, reflecting a moderate overall rating.
Edgewell Personal Care Company Rating
- Rating: B with a very favorable overall evaluation.
- Discounted Cash Flow Score: 5, indicating very favorable DCF.
- ROE Score: 2, showing moderate efficiency in equity use.
- ROA Score: 2, showing moderate asset utilization.
- Debt To Equity Score: 2, indicating moderate financial risk.
- Overall Score: 3, reflecting a moderate overall rating.
Which one is the best rated?
Kenvue Inc. holds a higher rating (B+) with stronger ROE and ROA scores, reflecting better operational efficiency. Edgewell has a superior discounted cash flow score but lower profitability metrics, resulting in both companies sharing a moderate overall score.
Scores Comparison
Here is a comparison of the Altman Z-Score and Piotroski Score for Kenvue Inc. and Edgewell Personal Care Company:
Kenvue Scores
- Altman Z-Score: 1.95, positioned in the grey zone, indicating moderate bankruptcy risk.
- Piotroski Score: 5, an average rating reflecting moderate financial strength.
Edgewell Personal Care Scores
- Altman Z-Score: 1.44, in the distress zone, indicating high bankruptcy risk.
- Piotroski Score: 6, also average but slightly stronger financial strength.
Which company has the best scores?
Based strictly on the scores, Kenvue has a better Altman Z-Score in the grey zone versus Edgewell’s distress zone, but Edgewell holds a slightly higher Piotroski Score, both rated average. Neither company stands out as clearly superior.
Grades Comparison
The following presents a comparison of recent grades issued by recognized financial institutions for the two companies:
Kenvue Inc. Grades
The table below lists recent grades and recommendations by reputable analysts for Kenvue Inc.:
| Grading Company | Action | New Grade | Date |
|---|---|---|---|
| Barclays | maintain | Equal Weight | 2025-11-10 |
| Canaccord Genuity | downgrade | Hold | 2025-10-29 |
| Jefferies | maintain | Buy | 2025-10-27 |
| JP Morgan | maintain | Overweight | 2025-10-10 |
| Citigroup | maintain | Neutral | 2025-10-09 |
| B of A Securities | maintain | Buy | 2025-10-08 |
| UBS | maintain | Neutral | 2025-10-08 |
| Goldman Sachs | maintain | Neutral | 2025-10-02 |
| Barclays | maintain | Equal Weight | 2025-10-01 |
| Rothschild & Co | upgrade | Buy | 2025-09-26 |
Kenvue’s grades show a stable to slightly cautious trend, with multiple holds and neutrals, and some buy ratings maintained or upgraded by several major banks.
Edgewell Personal Care Company Grades
The table below lists recent grades and recommendations by reputable analysts for Edgewell Personal Care Company:
| Grading Company | Action | New Grade | Date |
|---|---|---|---|
| Wells Fargo | maintain | Overweight | 2026-01-05 |
| Morgan Stanley | maintain | Equal Weight | 2025-11-18 |
| Barclays | maintain | Equal Weight | 2025-11-14 |
| RBC Capital | maintain | Outperform | 2025-11-14 |
| Wells Fargo | maintain | Overweight | 2025-11-14 |
| Wells Fargo | maintain | Overweight | 2025-09-25 |
| Morgan Stanley | upgrade | Equal Weight | 2025-08-06 |
| UBS | maintain | Neutral | 2025-08-06 |
| Barclays | maintain | Equal Weight | 2025-08-06 |
| Canaccord Genuity | maintain | Buy | 2025-08-06 |
Edgewell shows a generally positive grading pattern, with several overweight and outperform ratings maintained by multiple firms, indicating favorable analyst sentiment.
Which company has the best grades?
Edgewell Personal Care Company has received relatively stronger grades, featuring multiple overweight and outperform ratings compared to Kenvue’s predominantly hold and neutral assessments. For investors, this suggests Edgewell might currently have a more favorable analyst outlook, potentially impacting portfolio positioning and risk perceptions.
Strengths and Weaknesses
Below is a comparative overview of key strengths and weaknesses for Kenvue Inc. (KVUE) and Edgewell Personal Care Company (EPC) based on their recent financial and operational data.
| Criterion | Kenvue Inc. (KVUE) | Edgewell Personal Care Company (EPC) |
|---|---|---|
| Diversification | Broad product mix with significant revenue from Essential Health (4.7B), Self Care (6.5B), and Skin Health & Beauty (4.2B) segments | Focused on personal care niches: Razors & Blades (~1.1B), Sun Care (460M), Tampons & Pads (260M), less diversified |
| Profitability | Neutral net margin (6.66%) and ROIC (6.25%) with slight positive ROIC trend, but high PE (39.4) and PB (4.2) ratios suggest valuation concerns | Low net margin (1.14%) and ROIC (3.0%), declining profitability and negative ROIC trend; valuation mixed with low PB (0.62) |
| Innovation | Moderate innovation implied by growing ROIC trend and favorable fixed asset turnover (8.36) | Limited innovation signal; declining ROIC trend and weak interest coverage (1.32) point to operational challenges |
| Global presence | Strong global footprint reflected in product segmentation and stable asset turnover (0.6) | More regional focus with established niche brands but less geographical diversification |
| Market Share | Solid with diversified product categories and stable revenue growth | Concentrated in specific personal care segments but facing profitability pressure and declining returns |
In summary, Kenvue shows a slightly favorable outlook with a growing ROIC and diversified revenue streams, though valuation metrics warrant caution. Edgewell struggles with declining profitability and value destruction, despite a solid product niche and neutral financial ratios. Investors should weigh Kenvue’s growth potential against Edgewell’s operational challenges carefully.
Risk Analysis
Below is a comparative risk overview of Kenvue Inc. (KVUE) and Edgewell Personal Care Company (EPC) based on the latest financial and operational data.
| Metric | Kenvue Inc. (KVUE) | Edgewell Personal Care (EPC) |
|---|---|---|
| Market Risk | Low beta (0.552) indicating lower volatility versus market. | Moderate beta (0.616), slightly higher volatility risk. |
| Debt level | Debt-to-assets 34.06%, debt-to-equity moderate; interest coverage at 4.28 (neutral). | Debt-to-assets 37.61%, interest coverage low at 1.32 (unfavorable), indicating higher debt burden risk. |
| Regulatory Risk | Moderate, operates globally in consumer health, subject to health regulations. | Moderate, personal care products under multiple regulatory frameworks globally. |
| Operational Risk | Neutral asset turnover (0.6) and strong fixed asset turnover (8.36); stable operations. | Neutral asset turnover (0.59) and lower fixed asset turnover (6.02); operational efficiency lower than KVUE. |
| Environmental Risk | Moderate, consumer health sector with growing scrutiny on sustainability. | Moderate, similar industry exposure with product safety and sustainability concerns. |
| Geopolitical Risk | Low to moderate; primarily US-based with global operations, exposure to trade policies. | Low to moderate; US-based with international markets, potential supply chain disruptions possible. |
Kenvue’s most impactful risk is a slightly unfavorable valuation with a high P/E ratio (~39.38) and liquidity concerns (current ratio below 1), though its debt and operational metrics are stable. Edgewell faces higher financial risk due to low interest coverage and weak profitability, reflected in its distress-level Altman Z-Score, signaling potential bankruptcy risk. Market volatility risk is moderate for both but slightly higher for Edgewell. Investors should weigh Kenvue’s valuation risk against Edgewell’s financial distress signals carefully.
Which Stock to Choose?
Kenvue Inc. (KVUE) shows a generally favorable income statement with strong gross and EBIT margins, despite some recent declines in earnings growth. Its financial ratios are slightly unfavorable overall, with challenges in liquidity and valuation metrics, but it maintains a moderate debt level and a solid B+ rating. The company’s MOAT is slightly favorable, indicating growing profitability but no clear competitive advantage yet.
Edgewell Personal Care Company (EPC) presents an unfavorable income statement with declining profits and margins, alongside a neutral overall financial ratio evaluation. The company carries higher debt relative to EBITDA and has weaker interest coverage, yet it holds a B rating. Its MOAT is very unfavorable, reflecting decreasing profitability and value destruction over recent years.
Investors seeking growth potential might find KVUE’s improving profitability and stable rating more appealing, whereas those prioritizing valuation metrics and financial stability could consider EPC’s neutral ratio profile and favorable price-to-book ratio. The choice might depend on the investor’s tolerance for risk and focus on either improving profitability or current valuation factors.
Disclaimer: Investment carries a risk of loss of initial capital. The past performance is not a reliable indicator of future results. Be sure to understand risks before making an investment decision.
Go Further
I encourage you to read the complete analyses of Kenvue Inc. and Edgewell Personal Care Company to enhance your investment decisions: