In the dynamic world of technology, The Trade Desk, Inc. (TTD) and Domo, Inc. (DOMO) stand out as innovative leaders in software applications, each shaping data-driven decision-making differently. While TTD revolutionizes digital advertising through its cloud platform, DOMO empowers businesses with real-time intelligence across all levels. This comparison explores their market positions and growth strategies to help you decide which company holds the most promise for your investment portfolio.
Table of contents
Companies Overview
I will begin the comparison between The Trade Desk and Domo by providing an overview of these two companies and their main differences.
The Trade Desk Overview
The Trade Desk, Inc. is a technology company specializing in a self-service cloud-based platform that enables buyers to create, manage, and optimize data-driven digital advertising campaigns. Operating globally, it supports various ad formats and channels across multiple devices. Founded in 2009 and headquartered in Ventura, California, The Trade Desk serves advertising agencies and other service providers, positioning itself as a leader in digital advertising technology.
Domo Overview
Domo, Inc. operates a cloud-based business intelligence platform designed to connect all employees within an organization to real-time data and insights, facilitating business management from smartphones. Founded in 2010 and based in American Fork, Utah, Domo serves clients in the US, Japan, and internationally. It focuses on integrating people, data, and systems to enhance decision-making and operational efficiency across enterprises.
Key similarities and differences
Both companies operate in the software application industry with cloud-based platforms aimed at improving business processes through technology. The Trade Desk focuses on digital advertising campaign management, while Domo specializes in business intelligence and data connectivity. The Trade Desk has a significantly larger market capitalization and employee count, reflecting its scale and reach, whereas Domo targets real-time data access for organizational decision-making with a smaller workforce.
Income Statement Comparison
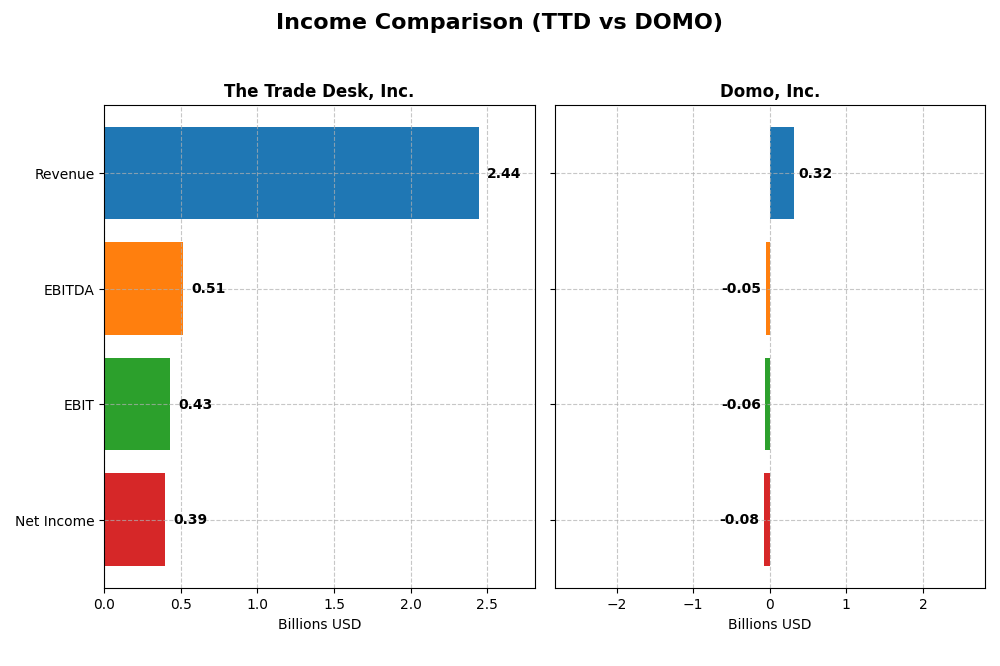
The table below presents a factual comparison of the most recent fiscal year income statement metrics for The Trade Desk, Inc. and Domo, Inc., expressed in USD.
| Metric | The Trade Desk, Inc. (TTD) | Domo, Inc. (DOMO) |
|---|---|---|
| Market Cap | 17.3B | 257M |
| Revenue | 2.44B | 317M |
| EBITDA | 515M | -50M |
| EBIT | 427M | -59M |
| Net Income | 393M | -82M |
| EPS | 0.80 | -2.13 |
| Fiscal Year | 2024 | 2025 |
Income Statement Interpretations
The Trade Desk, Inc.
The Trade Desk showed consistent revenue growth from 2020 to 2024, increasing from $836M to $2.44B, with net income rising from $242M to $393M. Margins remained strong, especially gross margin near 81%. In 2024, revenue growth accelerated by 25.63%, with net margin and earnings per share improving significantly, reflecting enhanced profitability and operational efficiency.
Domo, Inc.
Domo’s revenue grew from $210M in 2021 to $317M in 2025, but net income remained negative, with a loss of $82M in 2025. Gross margins stayed favorable around 74%, yet EBIT and net margins were negative, indicating ongoing operating losses. The latest year saw a slight revenue decline (-0.61%) and margin contraction, signaling persistent profitability challenges.
Which one has the stronger fundamentals?
The Trade Desk exhibits stronger fundamentals, supported by robust revenue and net income growth, high and stable margins, and a favorable overall income statement evaluation. Conversely, Domo struggles with negative profitability and shrinking margins despite modest revenue increases. The Trade Desk’s financial performance presents a more favorable risk profile and operational strength.
Financial Ratios Comparison
The table below presents a side-by-side comparison of key financial ratios for The Trade Desk, Inc. (TTD) and Domo, Inc. (DOMO) based on their most recent fiscal year data.
| Ratios | The Trade Desk, Inc. (TTD) | Domo, Inc. (DOMO) |
|---|---|---|
| ROE | 13.33% | 46.23% |
| ROIC | 10.02% | 194.73% |
| P/E | 146.8 | -3.98 |
| P/B | 19.56 | -1.84 |
| Current Ratio | 1.86 | 0.56 |
| Quick Ratio | 1.86 | 0.56 |
| D/E (Debt-to-Equity) | 0.11 | -0.76 |
| Debt-to-Assets | 5.11% | 63.23% |
| Interest Coverage | Not provided (0) | -2.99 |
| Asset Turnover | 0.40 | 1.48 |
| Fixed Asset Turnover | 5.17 | 8.17 |
| Payout ratio | 0 | 0 |
| Dividend yield | 0 | 0 |
Interpretation of the Ratios
The Trade Desk, Inc.
The Trade Desk shows mostly favorable financial ratios with strong net margin at 16.08% and return on invested capital (ROIC) of 10.02%, indicating operational efficiency. However, its high price-to-earnings (PE) ratio of 146.77 and price-to-book (PB) ratio of 19.56 raise valuation concerns. The company does not pay dividends, reflecting a focus on growth and reinvestment rather than shareholder payouts.
Domo, Inc.
Domo presents mixed financial ratios with a very negative net margin of -25.84%, signaling profitability challenges despite a favorable return on equity (ROE) of 46.23% and strong ROIC at 194.73%. Its weak liquidity ratios and high debt-to-assets ratio of 63.23% are notable concerns. Like The Trade Desk, Domo does not pay dividends, likely prioritizing reinvestment and growth initiatives.
Which one has the best ratios?
The Trade Desk offers a more balanced and favorable ratio profile with sound profitability and liquidity metrics, despite valuation concerns. Domo’s ratios are more polarized, showing profitability and liquidity weaknesses offset by strong returns on equity and capital, resulting in a neutral overall assessment.
Strategic Positioning
This section compares the strategic positioning of The Trade Desk, Inc. and Domo, Inc. in terms of Market position, Key segments, and Exposure to technological disruption:
The Trade Desk, Inc.
- Leading technology company with a cloud-based digital advertising platform facing typical software industry competition.
- Focused on data-driven digital advertising across multiple channels; serves advertising agencies and service providers.
- Operates in the evolving digital advertising tech space, potentially exposed to shifts in advertising technologies.
Domo, Inc.
- Smaller market cap with a cloud-based business intelligence platform serving various organizational levels.
- Revenue mainly from subscription and professional services in business intelligence and real-time data access.
- Positioned in cloud-based BI, reliant on technology trends for real-time data integration and mobile management.
The Trade Desk, Inc. vs Domo, Inc. Positioning
The Trade Desk maintains a concentrated focus on digital advertising technology, leveraging multiple ad formats and channels. Domo adopts a more diversified approach with cloud-based BI services, connecting organizational roles through data subscriptions and services. Each approach shows distinct market focus and business model dynamics.
Which has the best competitive advantage?
Domo demonstrates a very favorable moat with growing ROIC and strong value creation, indicating durable competitive advantage. The Trade Desk shows a slightly unfavorable moat with declining profitability, suggesting weaker competitive strength based on the latest MOAT evaluation.
Stock Comparison
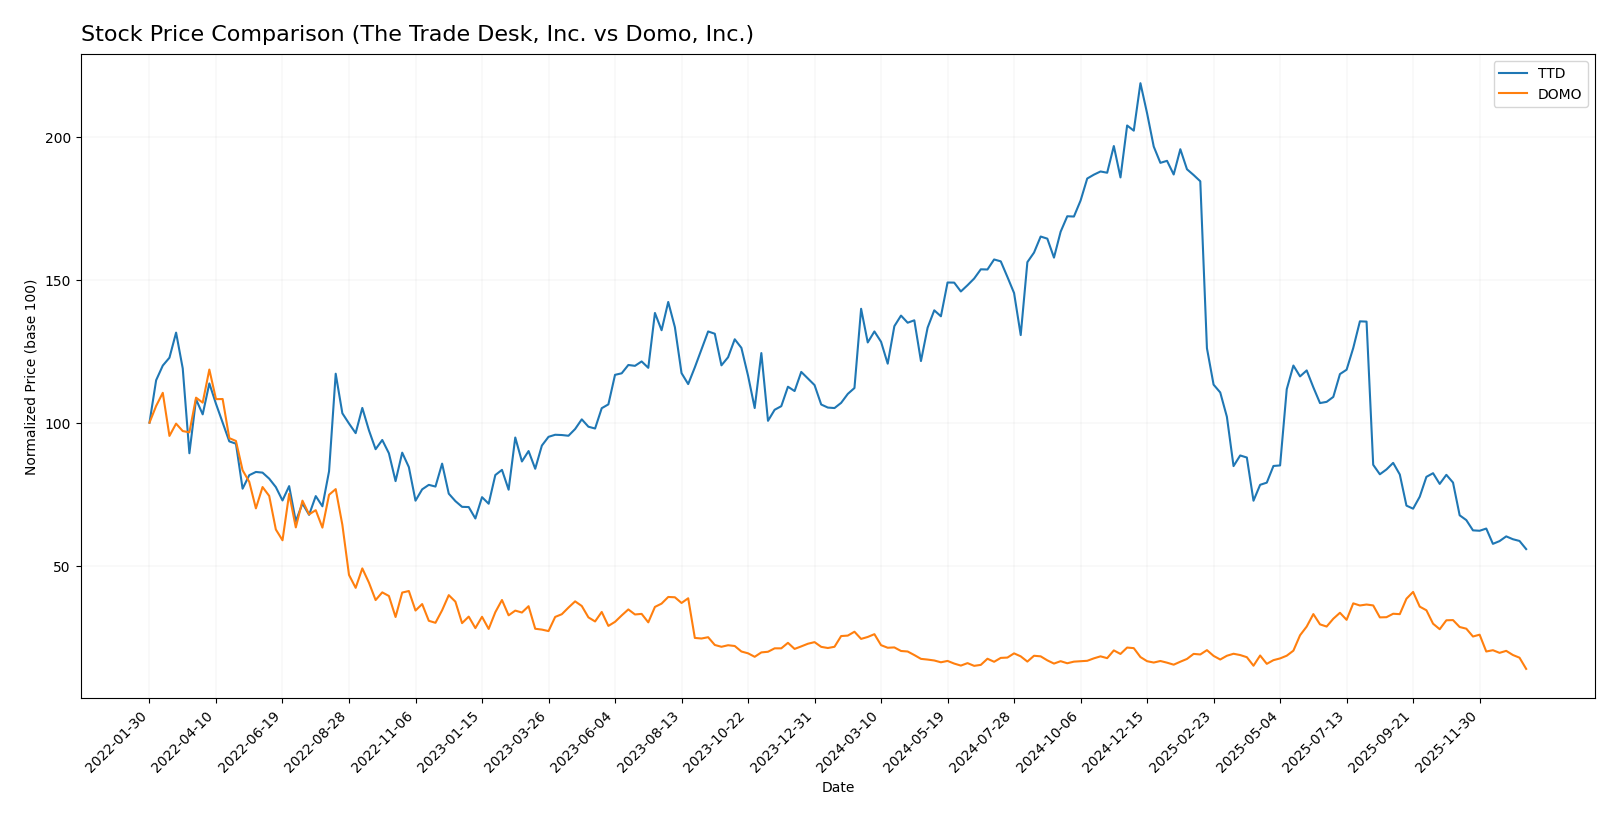
The stock prices of The Trade Desk, Inc. and Domo, Inc. have exhibited significant declines over the past 12 months, with both showing bearish trends and decelerating downtrends amid increasing trading volumes and seller dominance.
Trend Analysis
The Trade Desk, Inc. experienced a bearish trend with a -56.43% price change over the past year, marked by deceleration and high volatility (28.36 std deviation). The stock peaked at 139.11 and bottomed at 35.48.
Domo, Inc. also showed a bearish trend, falling -44.54% over the past year with deceleration. Its volatility was lower (3.01 std deviation), with a high of 18.06 and a low of 6.15.
Comparatively, The Trade Desk, Inc. delivered the weakest market performance with a larger price decline than Domo, Inc., both trending downward but with differing volatility levels.
Target Prices
Analysts provide a cautious but optimistic consensus for The Trade Desk, Inc. and Domo, Inc.
| Company | Target High | Target Low | Consensus |
|---|---|---|---|
| The Trade Desk, Inc. | 98 | 39 | 56.73 |
| Domo, Inc. | 13 | 10 | 11.5 |
The Trade Desk’s consensus target price is significantly above its current price of 35.48 USD, suggesting upside potential. Domo’s target consensus of 11.5 USD also indicates expected growth compared to its current 6.15 USD price.
Analyst Opinions Comparison
This section compares analysts’ ratings and grades for The Trade Desk, Inc. and Domo, Inc.:
Rating Comparison
The Trade Desk, Inc. Rating
- Rating: B, considered very favorable by analysts.
- Discounted Cash Flow Score: 4, favorable valuation view.
- ROE Score: 4, favorable efficiency in equity use.
- ROA Score: 4, favorable asset utilization rating.
- Debt To Equity Score: 3, moderate financial risk level.
- Overall Score: 3, moderate overall financial standing.
Domo, Inc. Rating
- Rating: C, also rated very favorable by analysts.
- Discounted Cash Flow Score: 1, very unfavorable rating.
- ROE Score: 5, very favorable performance on equity.
- ROA Score: 1, very unfavorable asset utilization.
- Debt To Equity Score: 1, very unfavorable financial risk.
- Overall Score: 2, moderate overall financial standing.
Which one is the best rated?
Based strictly on the data, The Trade Desk, Inc. holds a better overall rating (B vs. C) with stronger discounted cash flow, ROA, and debt-to-equity scores. Domo, Inc. excels only in ROE but falls behind in other key financial metrics.
Scores Comparison
Here is a comparison of financial stability and strength scores for The Trade Desk, Inc. and Domo, Inc.:
The Trade Desk Scores
- Altman Z-Score: 4.30, indicating a safe financial zone with low bankruptcy risk.
- Piotroski Score: 5, reflecting average financial strength and potential.
Domo Scores
- Altman Z-Score: -10.10, placing it firmly in the distress zone.
- Piotroski Score: 3, indicating very weak financial health.
Which company has the best scores?
Based strictly on the scores provided, The Trade Desk shows stronger financial stability with a safe Altman Z-Score and an average Piotroski Score. Domo, on the other hand, is in distress financially with a very weak Piotroski Score.
Grades Comparison
Here is a comparison of the recent grades assigned to The Trade Desk, Inc. and Domo, Inc.:
The Trade Desk, Inc. Grades
The latest grades from several reputable firms for The Trade Desk, Inc. are shown below.
| Grading Company | Action | New Grade | Date |
|---|---|---|---|
| Morgan Stanley | Maintain | Equal Weight | 2026-01-13 |
| Wells Fargo | Maintain | Equal Weight | 2026-01-12 |
| Cantor Fitzgerald | Maintain | Neutral | 2026-01-08 |
| Wolfe Research | Maintain | Outperform | 2026-01-06 |
| Guggenheim | Maintain | Buy | 2026-01-05 |
| Jefferies | Maintain | Hold | 2025-12-11 |
| Wedbush | Maintain | Neutral | 2025-12-08 |
| DA Davidson | Maintain | Buy | 2025-11-10 |
| Truist Securities | Maintain | Buy | 2025-11-07 |
| Wells Fargo | Maintain | Equal Weight | 2025-11-07 |
Overall, grades for The Trade Desk, Inc. are mixed but lean toward a positive outlook with several “Buy” and “Outperform” ratings balanced by some “Hold” and “Equal Weight” grades.
Domo, Inc. Grades
Below are the recent grades from established grading firms for Domo, Inc.
| Grading Company | Action | New Grade | Date |
|---|---|---|---|
| DA Davidson | Maintain | Neutral | 2025-12-05 |
| TD Cowen | Maintain | Buy | 2025-12-05 |
| Lake Street | Maintain | Hold | 2025-12-05 |
| DA Davidson | Maintain | Neutral | 2025-12-01 |
| JMP Securities | Maintain | Market Outperform | 2025-09-10 |
| DA Davidson | Maintain | Neutral | 2025-08-28 |
| Cantor Fitzgerald | Maintain | Overweight | 2025-08-28 |
| TD Cowen | Upgrade | Buy | 2025-08-26 |
| JMP Securities | Maintain | Market Outperform | 2025-06-25 |
| Cantor Fitzgerald | Maintain | Overweight | 2025-06-25 |
Domo, Inc. shows a generally positive grading trend with multiple “Buy,” “Market Outperform,” and “Overweight” ratings, alongside a few “Neutral” and “Hold” grades.
Which company has the best grades?
Both The Trade Desk, Inc. and Domo, Inc. have received predominantly positive grades, but The Trade Desk shows a higher quantity of “Buy” ratings, while Domo features more “Market Outperform” and “Overweight” grades. This suggests that investor sentiment is slightly more bullish on Domo’s potential for above-market returns, whereas The Trade Desk presents a solid but more balanced outlook. Investors might interpret these nuances differently based on their risk tolerance and investment goals.
Strengths and Weaknesses
The table below summarizes the key strengths and weaknesses of The Trade Desk, Inc. (TTD) and Domo, Inc. (DOMO) based on their latest financial and competitive data.
| Criterion | The Trade Desk, Inc. (TTD) | Domo, Inc. (DOMO) |
|---|---|---|
| Diversification | Moderate, focused on digital advertising | Moderate, with subscription & services |
| Profitability | Favorable net margin (16.1%), positive ROIC (10%) but declining | Negative net margin (-25.8%), very high ROIC (195%) with growth |
| Innovation | Strong in programmatic ad tech | High innovation reflected in ROIC growth |
| Global presence | Established global footprint | Growing but less global reach |
| Market Share | Significant in digital ad market | Smaller, niche in data platform market |
Key takeaways: TTD shows solid profitability and a strong market position but faces a declining ROIC trend, indicating caution. DOMO exhibits exceptional ROIC growth and innovation but struggles with profitability and liquidity, reflecting higher risk. Investors should weigh stability versus growth potential carefully.
Risk Analysis
The table below summarizes key risks for The Trade Desk, Inc. (TTD) and Domo, Inc. (DOMO) as of the most recent fiscal years.
| Metric | The Trade Desk, Inc. (TTD) | Domo, Inc. (DOMO) |
|---|---|---|
| Market Risk | Moderate (Beta 1.11) | High (Beta 1.65) |
| Debt level | Low (Debt/Equity 0.11, 5.11% assets) | High (Debt/Equity negative, 63.23% assets) |
| Regulatory Risk | Moderate (Tech advertising sector) | Moderate (Cloud BI software sector) |
| Operational Risk | Moderate (3522 employees, scale) | High (Smaller scale, 888 employees) |
| Environmental Risk | Low (Software sector) | Low (Software sector) |
| Geopolitical Risk | Moderate (Global platform exposure) | Moderate (Global operations) |
The most impactful and likely risks are market volatility and debt levels. TTD’s low debt and safe Altman Z-score (4.3) indicate financial stability, while DOMO’s high debt and distress-zone Z-score (-10.1) signal significant financial risk. DOMO’s elevated beta and weaker liquidity ratios raise caution for investors sensitive to market swings.
Which Stock to Choose?
The Trade Desk, Inc. (TTD) shows a favorable income evolution with a 25.63% revenue growth in the last year and strong profitability metrics like a 16.08% net margin. Its financial ratios are mostly favorable, including a low debt level and solid liquidity, though high valuation multiples temper the outlook. The company’s rating is very favorable with a “B” grade, supported by strong return on equity and assets scores.
Domo, Inc. (DOMO) presents an unfavorable income statement characterized by negative net margin (-25.84%) and declining revenue (-0.61% last year). Financial ratios are mixed with high returns on equity but poor liquidity and significant debt. Its rating, despite some favorable indicators, remains moderate with a “C” grade, reflecting weaker overall financial health and distress signals in its Altman Z-score.
For investors focused on stability and consistent income growth, TTD’s favorable rating and robust income evolution might appear more attractive, while risk-tolerant investors could see DOMO’s improving ROIC and occasional strong returns as potential growth opportunities. The choice could therefore depend on the investor’s appetite for risk and preference for either quality or speculative growth.
Disclaimer: Investment carries a risk of loss of initial capital. The past performance is not a reliable indicator of future results. Be sure to understand risks before making an investment decision.
Go Further
I encourage you to read the complete analyses of The Trade Desk, Inc. and Domo, Inc. to enhance your investment decisions: