ServiceTitan, Inc. and Domo, Inc. are two dynamic players in the software application industry, each championing innovation in distinct but overlapping markets. ServiceTitan focuses on field service management for residential and commercial infrastructure, while Domo delivers cloud-based business intelligence connecting organizational data in real time. Comparing these companies offers valuable insights into differing growth strategies and market positioning. Join me as we explore which company stands out as the smarter investment choice in 2026.
Table of contents
Companies Overview
I will begin the comparison between ServiceTitan and Domo by providing an overview of these two companies and their main differences.
ServiceTitan Overview
ServiceTitan, Inc. focuses on software solutions that support field service tasks necessary for installing, maintaining, and servicing infrastructure in residential and commercial buildings. Founded in 2008 and headquartered in Glendale, CA, it holds a strong position in the application software industry with a market cap of 8.5B USD and employs over 3,000 professionals.
Domo Overview
Domo, Inc. operates a cloud-based business intelligence platform designed to connect all organizational levels with real-time data and insights, accessible via smartphones. Headquartered in American Fork, UT, and established in 2010, Domo serves clients in the US, Japan, and internationally. It is smaller in scale with a market cap of 257M USD and employs 888 full-time staff.
Key similarities and differences
Both companies operate in the software application industry within the US technology sector and are publicly traded on NASDAQ. ServiceTitan targets field service management software for physical infrastructure, while Domo specializes in cloud-based business intelligence for data-driven decision-making. ServiceTitan is significantly larger in market capitalization and workforce, whereas Domo emphasizes mobile real-time data access across organizational hierarchies.
Income Statement Comparison
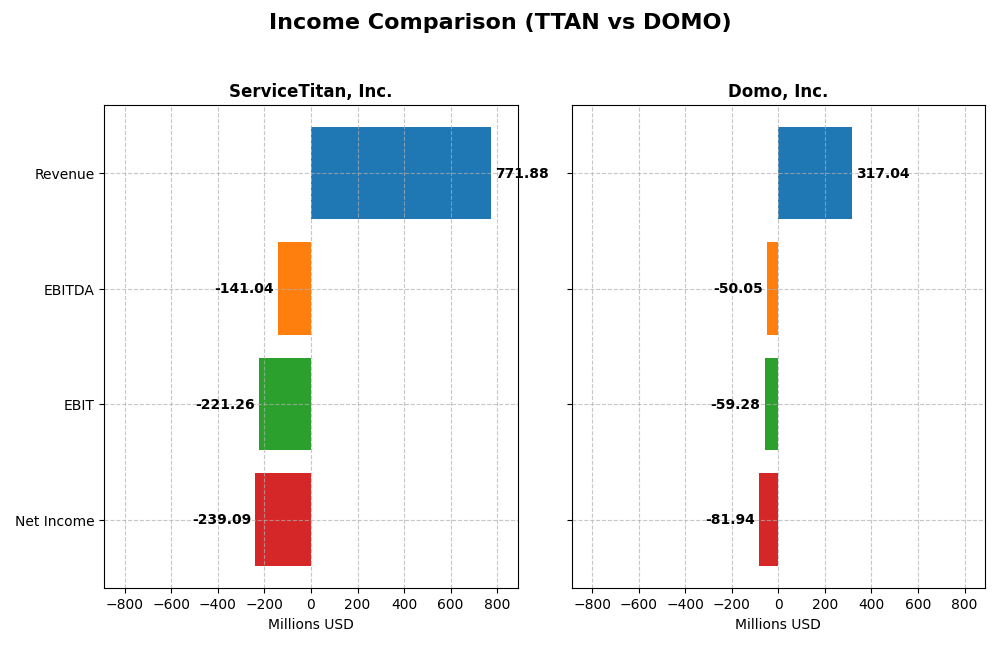
This table presents the key income statement metrics for ServiceTitan, Inc. and Domo, Inc. for the fiscal year 2025, enabling a straightforward financial comparison.
| Metric | ServiceTitan, Inc. (TTAN) | Domo, Inc. (DOMO) |
|---|---|---|
| Market Cap | 8.5B | 257M |
| Revenue | 772M | 317M |
| EBITDA | -141M | -50M |
| EBIT | -221M | -59M |
| Net Income | -239M | -82M |
| EPS | -8.53 | -2.13 |
| Fiscal Year | 2025 | 2025 |
Income Statement Interpretations
ServiceTitan, Inc.
ServiceTitan’s revenue rose strongly by 65% from 2023 to 2025, with net income also improving by 11%. Gross margins remained favorable at about 65%, though EBIT and net margins stayed negative, indicating ongoing operational challenges. In 2025, revenue growth accelerated to 25.6%, but EBIT declined by 27%, reflecting increased expenses and a widening net loss.
Domo, Inc.
Domo’s revenue grew 51% over the 2021–2025 period but slightly declined by 0.6% in 2025. Net income showed marginal improvement overall but remained deeply negative, with net margins around -26%. Gross margins are healthy at 74%, yet EBIT margins are negative and deteriorated by nearly 10% in the latest year, signaling persistent profitability issues.
Which one has the stronger fundamentals?
ServiceTitan exhibits stronger fundamentals with favorable revenue and net income growth coupled with improving margins over the period. Despite operating losses, its gross margin and interest expense ratios are better managed. Domo, while showing solid gross margins, faces worsening EBIT and net margins with declining recent growth, resulting in an overall less favorable income statement profile.
Financial Ratios Comparison
The table below presents the key financial ratios for ServiceTitan, Inc. and Domo, Inc. based on their most recent full fiscal year data (2025), offering a snapshot of profitability, liquidity, leverage, and market valuation metrics.
| Ratios | ServiceTitan, Inc. (TTAN) | Domo, Inc. (DOMO) |
|---|---|---|
| ROE | -16.4% | 46.2% |
| ROIC | -14.1% | 194.7% |
| P/E | -18.1 | -4.0 |
| P/B | 2.98 | -1.84 |
| Current Ratio | 3.74 | 0.56 |
| Quick Ratio | 3.74 | 0.56 |
| D/E (Debt-to-Equity) | 0.11 | -0.76 |
| Debt-to-Assets | 9.4% | 63.2% |
| Interest Coverage | -14.8 | -3.0 |
| Asset Turnover | 0.44 | 1.48 |
| Fixed Asset Turnover | 9.57 | 8.17 |
| Payout Ratio | 0 | 0 |
| Dividend Yield | 0 | 0 |
Interpretation of the Ratios
ServiceTitan, Inc.
ServiceTitan’s ratios present a mixed picture, with several unfavorable indicators including negative net margin (-31%) and return on equity (-16%), alongside a very high current ratio (3.74) flagged as unfavorable. The company shows strengths in debt levels and fixed asset turnover but suffers from poor interest coverage and asset turnover. ServiceTitan does not pay dividends, reflecting a possible reinvestment strategy or growth focus.
Domo, Inc.
Domo exhibits a split profile with favorable return on equity (46%) and return on invested capital (195%), and strong asset turnover ratios. However, it faces challenges with a low current ratio (0.56), high debt to assets (63%), and negative net margin (-26%). Domo also does not distribute dividends, likely prioritizing reinvestment or strategic development over shareholder payouts.
Which one has the best ratios?
Domo holds a slight edge in favorable profitability and efficiency ratios, notably ROE and ROIC, but suffers from liquidity and leverage concerns. ServiceTitan shows better debt management and liquidity but weaker profitability and coverage metrics. Both companies face notable risks, with Domo’s profile rated neutral overall and ServiceTitan’s slightly unfavorable.
Strategic Positioning
This section compares the strategic positioning of ServiceTitan, Inc. and Domo, Inc. regarding Market position, Key segments, and Exposure to technological disruption:
ServiceTitan, Inc.
- Large market cap of 8.5B with moderate competitive pressure.
- Focuses on field service software with platform and subscription revenue streams.
- Positioned in traditional field service software with moderate tech disruption risk.
Domo, Inc.
- Smaller market cap of 257M with higher beta indicating more risk.
- Operates cloud-based BI platform with subscription and services revenue.
- Cloud-based BI exposed to rapid technological innovation risks.
ServiceTitan vs Domo Positioning
ServiceTitan exhibits a concentrated focus on field service software with large scale, while Domo operates a more diversified cloud BI platform but at smaller scale. ServiceTitan benefits from scale, Domo from innovation exposure, each with distinct business drivers.
Which has the best competitive advantage?
Domo shows a very favorable moat with growing ROIC and value creation, indicating durable competitive advantage. ServiceTitan’s moat is unfavorable, with value destruction despite stable profitability.
Stock Comparison
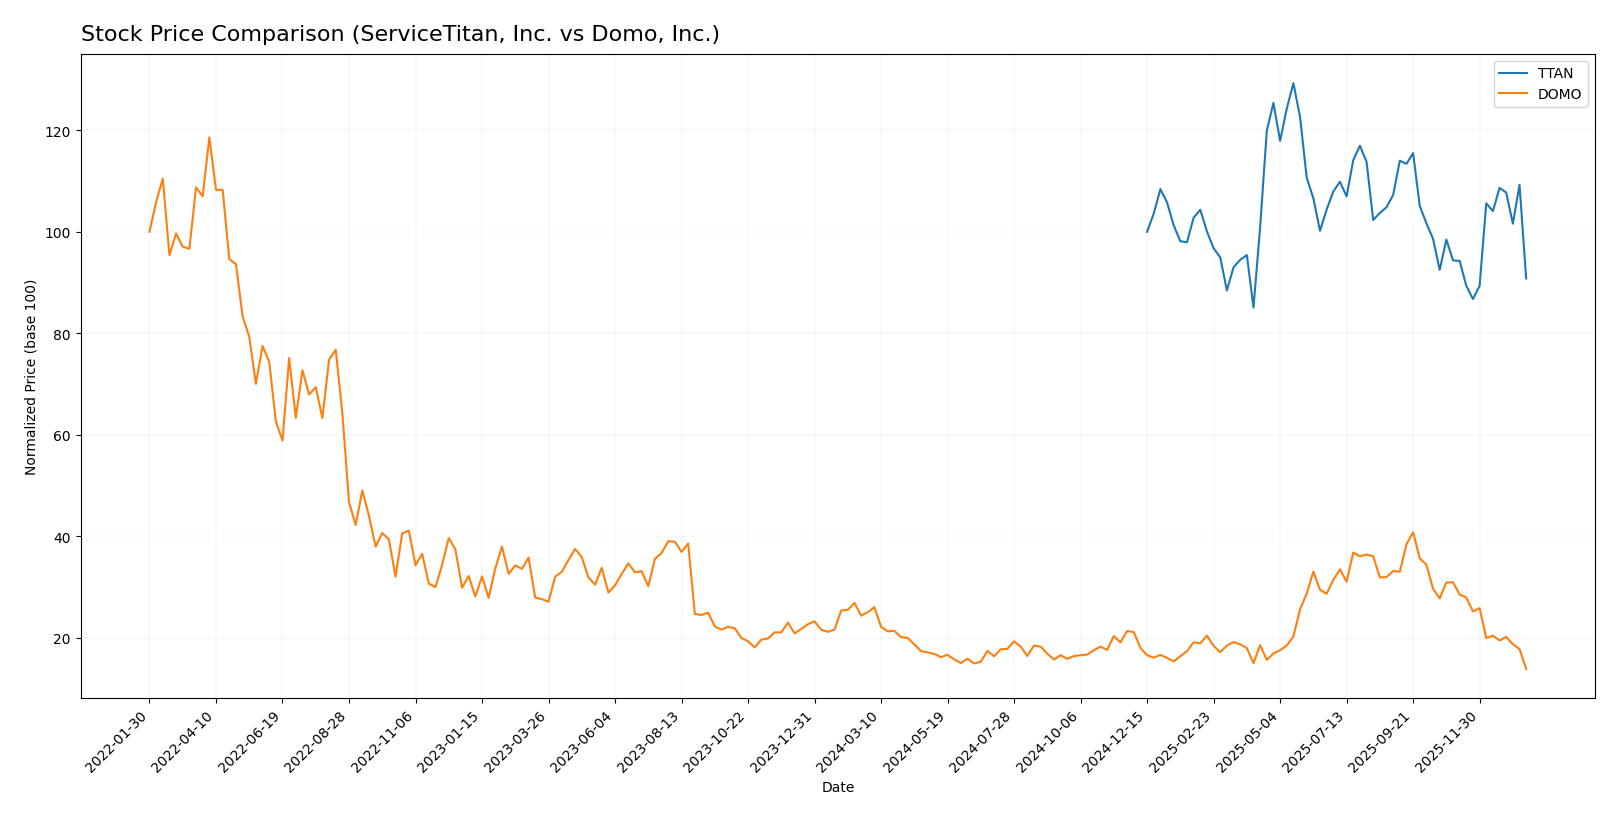
The stock price chart over the past year highlights notable bearish trends for both ServiceTitan, Inc. (TTAN) and Domo, Inc. (DOMO), with TTAN showing accelerating declines and DOMO experiencing sharper deceleration.
Trend Analysis
ServiceTitan, Inc. (TTAN) has recorded a -9.22% price change over the past 12 months, indicating a bearish trend with accelerating downward momentum. The stock’s price ranged from a high of 129.26 to a low of 85.07, and volatility is significant with a standard deviation near 9.86.
Domo, Inc. (DOMO) experienced a more severe bearish trend, dropping -44.54% over the same period. The trend shows deceleration and lower volatility at 3.01 standard deviation, with prices fluctuating between 18.06 and 6.15.
Comparing the two, TTAN delivered a higher market performance than DOMO, as its decline was less severe and showed signs of recent trend improvement relative to DOMO’s deeper and sustained losses.
Target Prices
Analysts present a clear target price consensus for both ServiceTitan, Inc. and Domo, Inc.
| Company | Target High | Target Low | Consensus |
|---|---|---|---|
| ServiceTitan, Inc. | 145 | 117 | 132.44 |
| Domo, Inc. | 13 | 10 | 11.5 |
For ServiceTitan, the consensus target price of 132.44 USD is substantially above the current 90.78 USD stock price, suggesting notable upside potential. Domo’s target consensus at 11.5 USD also exceeds its current price of 6.15 USD, indicating positive analyst expectations.
Analyst Opinions Comparison
This section compares analysts’ ratings and financial scores for ServiceTitan, Inc. and Domo, Inc.:
Rating Comparison
ServiceTitan, Inc. Rating
- Rating: C-, considered very favorable
- Discounted Cash Flow Score: Very unfavorable, score 1
- ROE Score: Very unfavorable, score 1
- ROA Score: Very unfavorable, score 1
- Debt To Equity Score: Moderate, score 3
- Overall Score: Very unfavorable, score 1
Domo, Inc. Rating
- Rating: C, considered very favorable
- Discounted Cash Flow Score: Very unfavorable, score 1
- ROE Score: Very favorable, score 5
- ROA Score: Very unfavorable, score 1
- Debt To Equity Score: Very unfavorable, score 1
- Overall Score: Moderate, score 2
Which one is the best rated?
Based strictly on provided data, Domo holds a higher overall score (2 vs. 1) and a significantly better ROE score, while ServiceTitan shows a more moderate debt-to-equity score. Thus, Domo is rated better overall.
Scores Comparison
Here is a comparison of the Altman Z-Score and Piotroski Score for ServiceTitan and Domo:
ServiceTitan Scores
- Altman Z-Score: 15.74, indicating a safe zone.
- Piotroski Score: 6, reflecting average financial strength.
Domo Scores
- Altman Z-Score: -10.10, indicating distress zone.
- Piotroski Score: 3, indicating very weak financial strength.
Which company has the best scores?
ServiceTitan exhibits significantly stronger financial health with a very high Altman Z-Score and an average Piotroski Score. In contrast, Domo’s scores indicate financial distress and very weak strength, based solely on the provided data.
Grades Comparison
The following presents a comparison of the latest reliable grades for ServiceTitan, Inc. and Domo, Inc.:
ServiceTitan, Inc. Grades
The table below summarizes recent grades from established grading companies for ServiceTitan, Inc.:
| Grading Company | Action | New Grade | Date |
|---|---|---|---|
| Piper Sandler | Maintain | Overweight | 2025-12-05 |
| BMO Capital | Maintain | Outperform | 2025-12-05 |
| TD Cowen | Maintain | Buy | 2025-12-05 |
| Morgan Stanley | Maintain | Equal Weight | 2025-12-05 |
| BMO Capital | Maintain | Outperform | 2025-11-20 |
| Wells Fargo | Maintain | Overweight | 2025-09-19 |
| Stifel | Maintain | Buy | 2025-09-19 |
| Piper Sandler | Maintain | Overweight | 2025-09-19 |
| Canaccord Genuity | Maintain | Buy | 2025-09-19 |
| Citigroup | Maintain | Neutral | 2025-09-09 |
ServiceTitan’s grades predominantly show positive analyst sentiment with multiple “Buy,” “Outperform,” and “Overweight” ratings maintained consistently.
Domo, Inc. Grades
The table below summarizes recent grades from established grading companies for Domo, Inc.:
| Grading Company | Action | New Grade | Date |
|---|---|---|---|
| DA Davidson | Maintain | Neutral | 2025-12-05 |
| TD Cowen | Maintain | Buy | 2025-12-05 |
| Lake Street | Maintain | Hold | 2025-12-05 |
| DA Davidson | Maintain | Neutral | 2025-12-01 |
| JMP Securities | Maintain | Market Outperform | 2025-09-10 |
| DA Davidson | Maintain | Neutral | 2025-08-28 |
| Cantor Fitzgerald | Maintain | Overweight | 2025-08-28 |
| TD Cowen | Upgrade | Buy | 2025-08-26 |
| JMP Securities | Maintain | Market Outperform | 2025-06-25 |
| Cantor Fitzgerald | Maintain | Overweight | 2025-06-25 |
Domo’s grades present a mixed but generally positive outlook, with a majority of “Buy,” “Market Outperform,” and “Overweight” ratings alongside several “Neutral” and “Hold” opinions.
Which company has the best grades?
Both ServiceTitan and Domo hold a “Buy” consensus rating; however, ServiceTitan has a higher number of consistent “Buy” and “Outperform” ratings across more recent dates. This stronger grade profile may indicate more robust analyst confidence, potentially influencing investor sentiment and portfolio positioning.
Strengths and Weaknesses
Below is a comparative overview of key strengths and weaknesses of ServiceTitan, Inc. (TTAN) and Domo, Inc. (DOMO) based on the most recent financial and strategic data.
| Criterion | ServiceTitan, Inc. (TTAN) | Domo, Inc. (DOMO) |
|---|---|---|
| Diversification | Strong platform and subscription revenue streams (total $1.3B in 2025); focused on service management software | Primarily subscription-based with professional services; less diversified ($315M total revenue in 2025) |
| Profitability | Negative net margin (-31%) and ROIC (-14%); destroying value with low returns on capital | Positive ROE (46%) and very high ROIC (195%); creating strong value and profitability |
| Innovation | Moderate innovation with stable but unfavorable ROIC trend | High innovation reflected in strong and growing ROIC trends indicating durable competitive advantage |
| Global presence | Focused on North American service industries; limited global footprint | Expanding presence internationally but still relatively narrow compared to industry giants |
| Market Share | Leading in service management software niche but facing margin pressures | Growing market share in cloud-based analytics but capital structure shows risk |
Key takeaways: Domo demonstrates superior profitability and value creation with a durable competitive advantage, while ServiceTitan shows strong revenue scale but struggles with profitability and capital efficiency. Investors should weigh growth potential against financial health carefully.
Risk Analysis
The table below summarizes key risk factors for ServiceTitan, Inc. (TTAN) and Domo, Inc. (DOMO) based on the most recent financial and market data from 2025.
| Metric | ServiceTitan, Inc. (TTAN) | Domo, Inc. (DOMO) |
|---|---|---|
| Market Risk | Low beta (-0.85) indicating lower market volatility risk | High beta (1.65) indicating higher market sensitivity |
| Debt level | Low debt-to-equity (0.11) and debt-to-assets (9.35%) | High debt-to-assets (63.23%) and negative debt-to-equity ratio |
| Regulatory Risk | Moderate, US-based with no major regulatory changes reported | Moderate, US-based with international exposure increasing complexity |
| Operational Risk | Negative net margin (-31%) and return on equity (-16%) indicate operational inefficiencies | Negative net margin (-25.84%) but strong ROE (46.23%) shows mixed operational performance |
| Environmental Risk | Low impact, software industry with minimal direct environmental footprint | Low impact, similar industry profile |
| Geopolitical Risk | Low, primarily US operations | Moderate due to international market presence |
ServiceTitan shows lower market and debt risk with a stable financial structure but suffers from operational inefficiencies and negative profitability. Domo faces higher market and financial leverage risks, reflected in its high debt and volatile earnings, alongside operational challenges. The most impactful risks are Domo’s high financial leverage and market volatility, and ServiceTitan’s persistent operational losses. Both require cautious risk management before investment.
Which Stock to Choose?
ServiceTitan, Inc. (TTAN) shows favorable income evolution with 26% revenue growth in 2025 and a 65% increase over 2023-2025. However, profitability remains negative with a net margin at -31%, reflected in unfavorable ROE of -16% and ROIC of -14%. Debt levels are low and manageable, with a debt-to-equity ratio of 0.11. The overall financial ratios evaluation is slightly unfavorable, while the rating is very favorable despite weak profitability.
Domo, Inc. (DOMO) has a less positive recent income trend, with a slight revenue decline of -0.6% in 2025 and mixed profit growth over 2021-2025. Profitability shows improvement with a positive ROE at 46% and a high ROIC at 195%, indicating efficient capital use, but net margin remains negative at -26%. Debt is higher, with a debt-to-assets ratio of 63%. Financial ratios evaluation is neutral, and the rating is very favorable, although financial stability scores reveal distress risks.
Which stock is the most favorable for an investor might appear to depend on the investor’s risk tolerance and focus. Investors prioritizing durable competitive advantages and value creation might find Domo’s very favorable moat and strong ROIC growth appealing despite financial distress signals. Conversely, those valuing stable income growth and lower debt exposure might lean towards ServiceTitan, which shows favorable income trends and a slightly unfavorable but improving financial profile.
Disclaimer: Investment carries a risk of loss of initial capital. The past performance is not a reliable indicator of future results. Be sure to understand risks before making an investment decision.
Go Further
I encourage you to read the complete analyses of ServiceTitan, Inc. and Domo, Inc. to enhance your investment decisions: