Home > Comparison > Technology > NOW vs DOMO
The strategic rivalry between ServiceNow, Inc. and Domo, Inc. shapes the Technology sector’s software application landscape. ServiceNow operates as a market-leading enterprise cloud platform with broad workflow automation capabilities, while Domo offers a nimble, cloud-based business intelligence solution focused on real-time data accessibility. This analysis pits ServiceNow’s scale and integration against Domo’s agility to identify which profile delivers superior risk-adjusted returns for a diversified portfolio.
Table of contents
Companies Overview
ServiceNow and Domo are key players in the software application market, each shaping enterprise digital workflows and data intelligence.
ServiceNow, Inc.: Enterprise Workflow Automation Leader
ServiceNow dominates the enterprise cloud computing space with its Now platform, which automates workflows using AI, machine learning, and robotic process automation. Its revenue primarily comes from broad IT service management and operations solutions. In 2026, ServiceNow’s strategic focus remains on expanding automation capabilities and integrating third-party partnerships to deepen enterprise footprint.
Domo, Inc.: Real-Time Business Intelligence Innovator
Domo operates a cloud-based platform linking executives to frontline workers through real-time data and insights accessible via smartphones. It generates revenue by enabling organizations to manage business operations with data-driven decision-making tools. For 2026, Domo emphasizes enhancing mobile accessibility and expanding its international reach, aiming to increase adoption among mid-market companies.
Strategic Collision: Similarities & Divergences
Both companies prioritize enhancing enterprise efficiency but diverge sharply in approach. ServiceNow builds a comprehensive workflow automation ecosystem, while Domo focuses on open-access, real-time data intelligence. Their primary battleground is enterprise digital transformation, with ServiceNow targeting large-scale IT operations and Domo appealing to agile, data-driven management. This results in distinct investment profiles: ServiceNow offers scale and integration; Domo offers nimbleness and specialized BI tools.
Income Statement Comparison
This data dissects the core profitability and scalability of both corporate engines to reveal who dominates the bottom line:
| Metric | ServiceNow, Inc. (NOW) | Domo, Inc. (DOMO) |
|---|---|---|
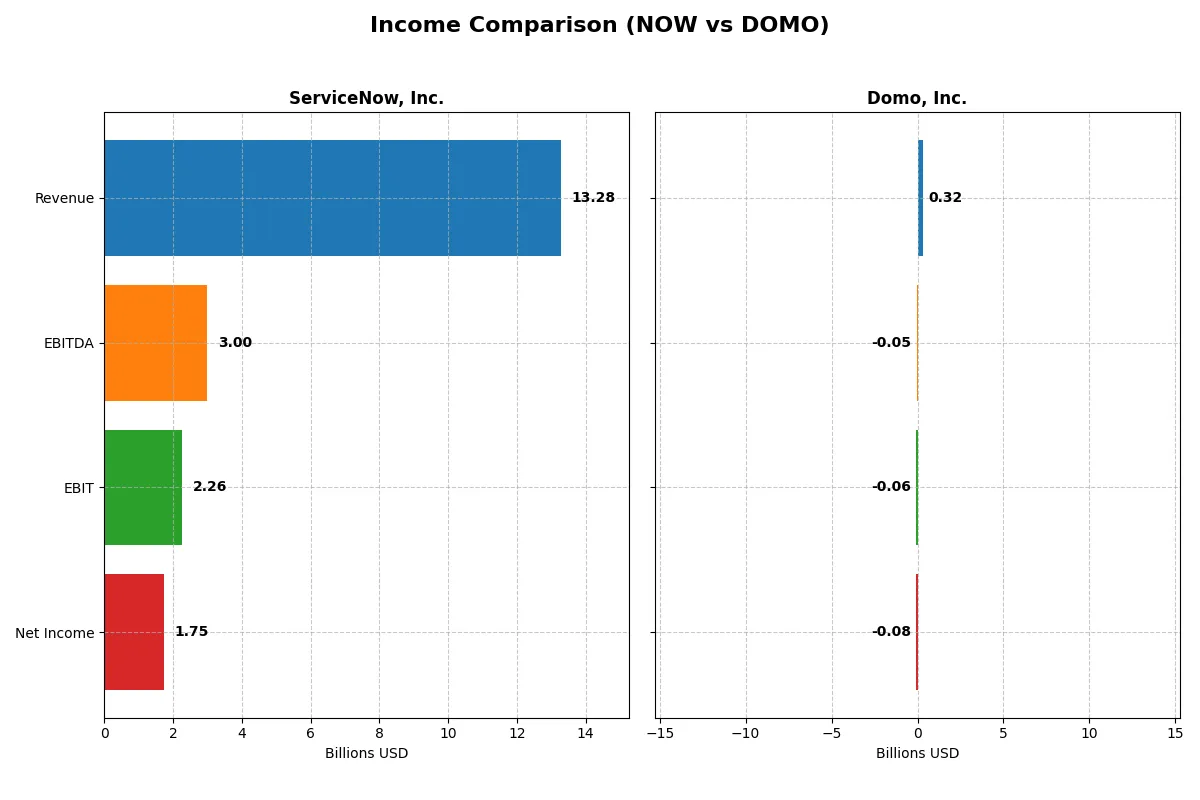
| Revenue | 13.3B | 317M |
| Cost of Revenue | 3.0B | 81M |
| Operating Expenses | 8.5B | 295M |
| Gross Profit | 10.3B | 236M |
| EBITDA | 3.0B | -50M |
| EBIT | 2.3B | -59M |
| Interest Expense | 0 | 20M |
| Net Income | 1.7B | -82M |
| EPS | 1.69 | -2.13 |
| Fiscal Year | 2025 | 2025 |
Income Statement Analysis: The Bottom-Line Duel
This income statement comparison reveals which company runs its business engine with greater efficiency and profitability over recent years.
ServiceNow, Inc. Analysis
ServiceNow’s revenue soared from 5.9B in 2021 to 13.3B in 2025, with net income surging from 230M to 1.75B. Its gross margin stays robust at 77.5%, while net margin improved to 13.2%. The 2025 figures highlight strong operational momentum and disciplined cost management driving a 28% EBIT growth.
Domo, Inc. Analysis
Domo’s revenue grew modestly from 210M in 2021 to 317M in 2025 but recently declined slightly. It remains unprofitable, with net losses widening to -82M in 2025. Gross margin holds at 74.5%, but negative EBIT and net margins (-18.7% and -25.8%) underscore ongoing operational challenges and inefficient cost control.
Verdict: Robust Profitability vs. Persistent Losses
ServiceNow dominates with strong double-digit revenue and earnings growth, superior margins, and positive net income. Domo struggles with losses and shrinking margins despite moderate revenue growth. For investors, ServiceNow presents a proven profitable profile, while Domo remains a higher-risk, turnaround play.
Financial Ratios Comparison
These vital ratios act as a diagnostic tool to expose the underlying fiscal health, valuation premiums, and capital efficiency of the companies analyzed:
| Ratios | ServiceNow, Inc. (NOW) | Domo, Inc. (DOMO) |
|---|---|---|
| ROE | 13.5% | 46.2% |
| ROIC | 9.0% | 195% |
| P/E | 90.9 | -4.0 |
| P/B | 12.3 | -1.8 |
| Current Ratio | 0.95 | 0.56 |
| Quick Ratio | 0.95 | 0.56 |
| D/E | 0.25 | -0.76 |
| Debt-to-Assets | 12.3% | 63.2% |
| Interest Coverage | 0 | -3.0 |
| Asset Turnover | 0.51 | 1.48 |
| Fixed Asset Turnover | 4.29 | 8.17 |
| Payout Ratio | 0 | 0 |
| Dividend Yield | 0 | 0 |
| Fiscal Year | 2025 | 2025 |
Efficiency & Valuation Duel: The Vital Signs
Ratios serve as a company’s DNA, exposing hidden risks and operational strengths that drive investor decisions in complex markets.
ServiceNow, Inc.
ServiceNow exhibits solid profitability with a 13.48% ROE and a favorable 13.16% net margin. However, its valuation is stretched, with a P/E of 90.88 and a P/B of 12.25, indicating high market expectations. The company retains earnings for growth rather than paying dividends, emphasizing reinvestment in R&D (22.3% of revenue).
Domo, Inc.
Domo shows a contradictory profile: a high ROE of 46.23% and exceptional ROIC of 194.73% suggest efficiency, but it posts a negative net margin (-25.84%), reflecting operational challenges. The stock trades at negative P/E and P/B ratios, indicating loss-making status. Domo’s low current ratio (0.56) signals liquidity risk, with no dividends paid.
Premium Valuation vs. Operational Volatility
ServiceNow balances operational consistency with a premium valuation, while Domo’s metrics reveal volatile profitability and liquidity concerns. Investors seeking stable growth face stretched pricing at ServiceNow. Those favoring high-risk, high-reward profiles might consider Domo’s potential but must brace for financial instability.
Which one offers the Superior Shareholder Reward?
ServiceNow, Inc. (NOW) and Domo, Inc. (DOMO) both forgo dividends, focusing on reinvestment and buybacks for shareholder returns. NOW maintains a disciplined buyback program, supported by strong free cash flow (4.4B per share) and robust margins (13% net profit margin). DOMO, however, reports negative margins and free cash flow, with negligible buyback activity and weaker liquidity (current ratio 0.56). Historically in tech, consistent buybacks backed by healthy free cash flow indicate sustainable returns. I see NOW’s capital allocation as far more sustainable and rewarding. For 2026, I favor ServiceNow’s total return profile over Domo’s risky growth bets.
Comparative Score Analysis: The Strategic Profile
The radar chart reveals the fundamental DNA and trade-offs of ServiceNow, Inc. and Domo, Inc., highlighting their financial strengths and vulnerabilities:
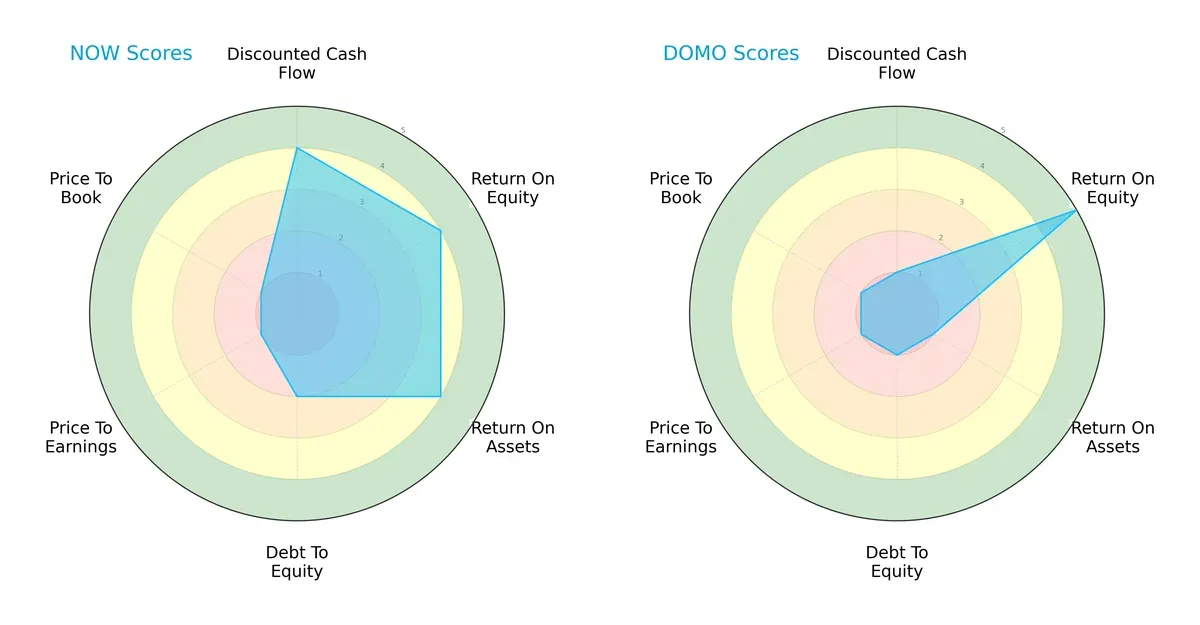
ServiceNow offers a balanced profile with strong DCF (4), ROE (4), and ROA (4) scores, indicating efficient capital use and solid asset productivity. However, its moderate debt-to-equity score (2) and very unfavorable valuation metrics (P/E and P/B at 1) suggest some market pricing concerns. Domo leans heavily on its exceptional ROE (5) but suffers from poor DCF (1), ROA (1), and debt-to-equity (1) scores, signaling financial risk and weak asset efficiency. ServiceNow’s diversified strengths contrast with Domo’s reliance on a single edge.
Bankruptcy Risk: Solvency Showdown
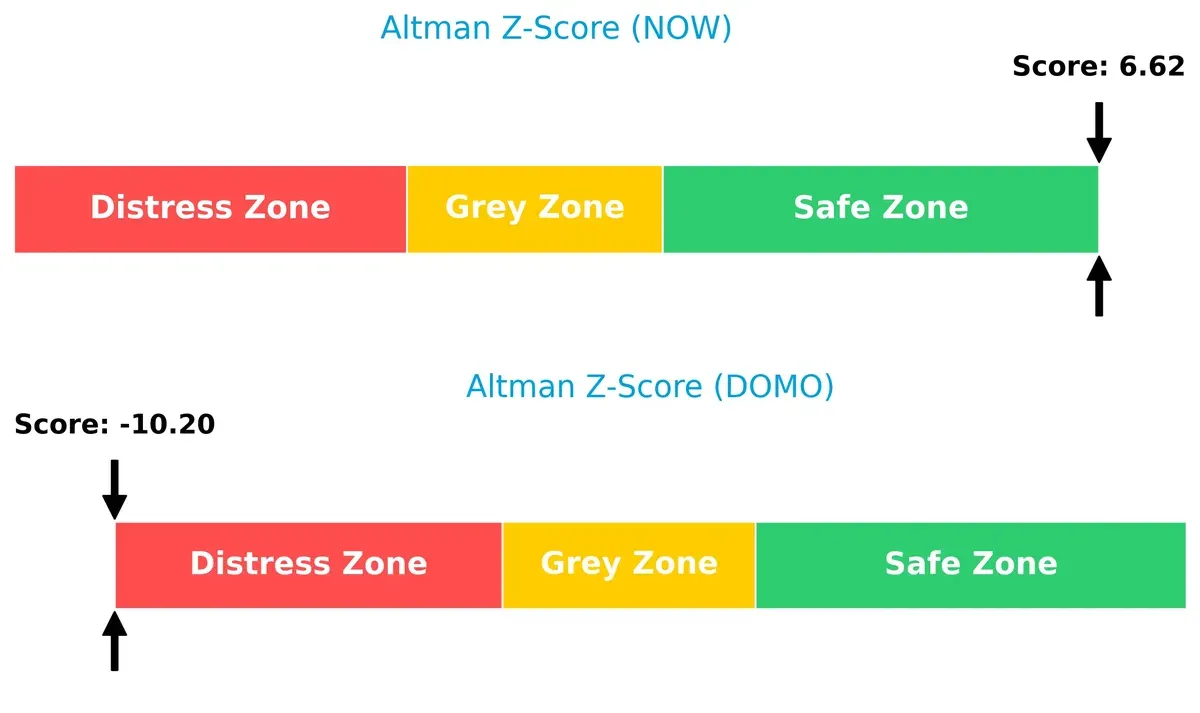
ServiceNow’s Altman Z-Score of 6.62 firmly places it in the safe zone, signaling robust financial stability and a low bankruptcy risk in this cycle. Conversely, Domo’s -10.20 score lands deep in the distress zone, indicating severe solvency issues and a high risk of default:
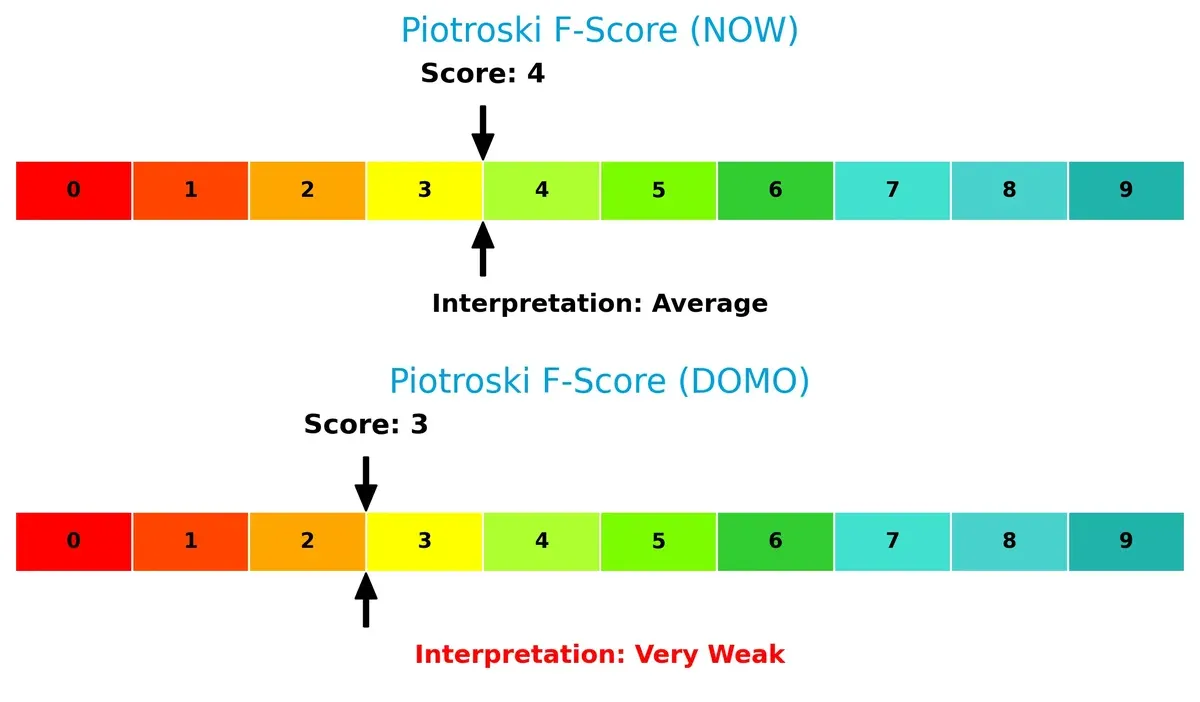
Financial Health: Quality of Operations
ServiceNow’s Piotroski F-Score of 4 suggests average financial health, with room for improvement but no immediate internal red flags. Domo scores a weaker 3, signaling very weak operational quality and raising caution for investors assessing internal financial strength:
How are the two companies positioned?
This section dissects the operational DNA of ServiceNow and Domo by comparing their revenue distribution and internal dynamics. The goal is to confront their economic moats and identify which model delivers the most resilient competitive advantage today.
Revenue Segmentation: The Strategic Mix
This visual comparison dissects how ServiceNow, Inc. and Domo, Inc. diversify their income streams and reveals where their primary sector bets lie:
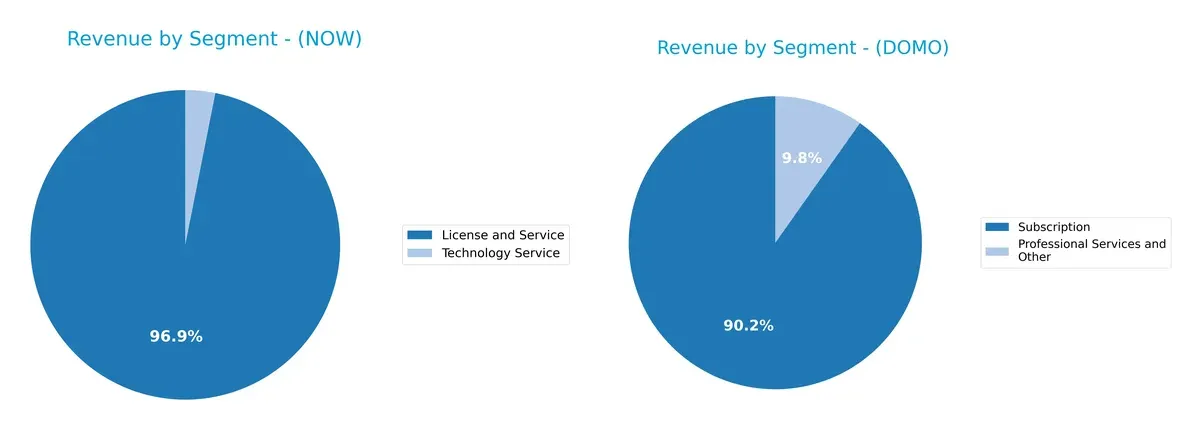
ServiceNow anchors its revenue heavily in License and Service, with $12.9B in 2025, dwarfing its smaller Technology Service segment at $414M. This concentration signals strong ecosystem lock-in in digital workflow and IT operations. Domo, by contrast, shows a more balanced mix with $286M in Subscription and $31M in Professional Services. Domo’s diversification reduces concentration risk but lacks the infrastructure dominance ServiceNow wields.
Strengths and Weaknesses Comparison
This table compares the Strengths and Weaknesses of ServiceNow, Inc. and Domo, Inc.:
ServiceNow Strengths
- Strong global presence with $8.35B North America revenue
- Diversified revenue streams in License, Service, Technology Services
- Favorable debt-to-equity and interest coverage ratios
- Consistent net margin of 13.16% supports profitability
Domo Strengths
- High ROE (46.23%) and ROIC (194.73%) indicate efficient capital use
- Favorable price-to-earnings and price-to-book ratios
- Higher asset turnover shows operational efficiency
- Subscription-based revenue provides stability
ServiceNow Weaknesses
- High valuation multiples (P/E 90.88, P/B 12.25) may limit upside
- Current ratio below 1 signals liquidity concerns
- Zero dividend yield could deter income investors
- Modest net margin (13.16%) relative to valuation
Domo Weaknesses
- Negative net margin (-25.84%) reflects ongoing losses
- Weak liquidity ratios (current and quick ratio 0.56) pose risks
- High debt-to-assets (63.23%) increases financial leverage
- Negative interest coverage warns of potential solvency issues
ServiceNow shows strong market reach and financial stability but faces valuation and liquidity challenges. Domo excels in capital efficiency but struggles with profitability and balance sheet risks. Both companies must address their distinct weaknesses to sustain long-term growth.
The Moat Duel: Analyzing Competitive Defensibility
A structural moat protects long-term profits from relentless competitive erosion. Without it, durable growth is impossible. Let’s analyze the moats of two software players:
ServiceNow, Inc.: Workflow Automation Switching Costs
ServiceNow’s primary moat stems from high switching costs entrenched in its enterprise cloud platform. Its stable 77.5% gross margin and 17% EBIT margin reflect this. Expanding AI-driven workflow tools in 2026 could deepen client lock-in.
Domo, Inc.: Agile Platform Cost Advantage
Unlike ServiceNow, Domo competes on a leaner, cost-efficient cloud BI platform. It generates value with a soaring ROIC well above WACC and accelerating profitability, but weaker revenue growth tempers its moat’s breadth. Expanding mobile data management could disrupt markets.
Moat Strength Showdown: Switching Costs vs. Cost Efficiency
ServiceNow’s switching cost moat locks in large clients but yields only slightly favorable value creation. Domo’s cost advantage fuels a very favorable moat with growing ROIC and strong value creation. I see Domo better positioned to defend and expand its market share in 2026.
Which stock offers better returns?
Both ServiceNow, Inc. (NOW) and Domo, Inc. (DOMO) experienced significant price declines over the past year, with bearish trends and decelerating momentum shaping their trading dynamics.
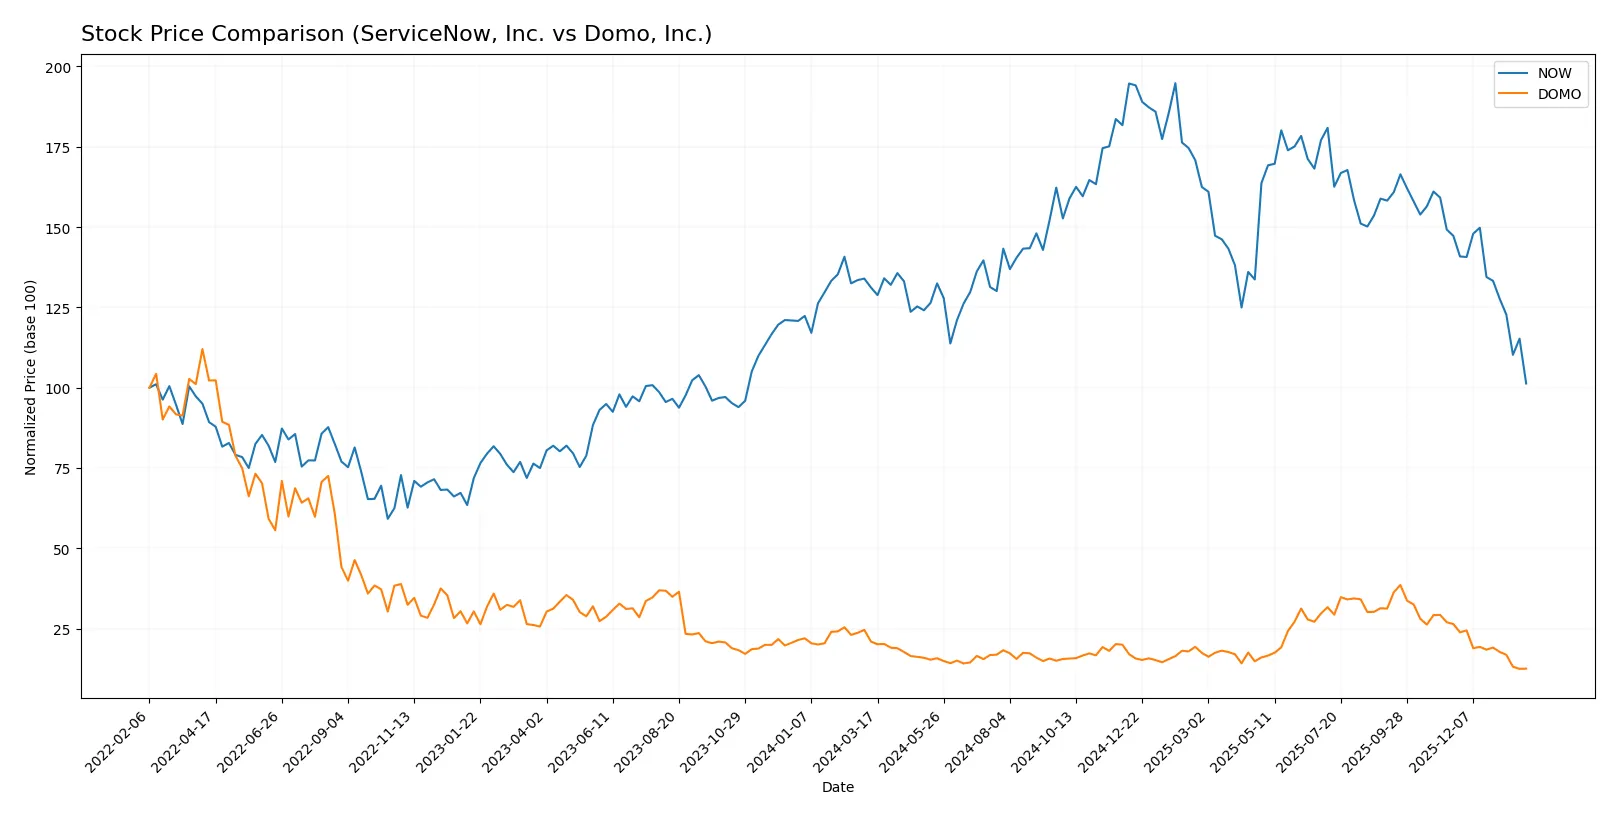
Trend Comparison
ServiceNow’s stock fell 22.79% over the past 12 months, showing a bearish trend with decelerating losses. Volatility is high, evidenced by a 24.31 std deviation and a peak at 225.0 before dropping to 117.01.
Domo’s stock declined 40.22% over the same period, also bearish with deceleration. Its volatility is lower, with a 3.05 std deviation, hitting a high of 18.06 and a low of 5.83 during the year.
Comparing these trends, ServiceNow delivered the better market performance, losing less value than Domo despite both showing bearish momentum and seller dominance in recent trading.
Target Prices
The consensus target prices for ServiceNow, Inc. and Domo, Inc. reveal a wide range of analyst expectations.
| Company | Target Low | Target High | Consensus |
|---|---|---|---|
| ServiceNow, Inc. | 115 | 1315 | 440.14 |
| Domo, Inc. | 10 | 13 | 11.5 |
ServiceNow’s target consensus at 440.14 significantly exceeds its current price of 117, indicating strong growth expectations. Domo’s consensus target of 11.5 also suggests upside from its current 5.87, but with a narrower range and higher risk.

Don’t Let Luck Decide Your Entry Point
Optimize your entry points with our advanced ProRealTime indicators. You’ll get efficient buy signals with precise price targets for maximum performance. Start outperforming now!
How do institutions grade them?
ServiceNow, Inc. Grades
The following table summarizes recent institutional grades for ServiceNow, Inc.:
| Grading Company | Action | New Grade | Date |
|---|---|---|---|
| Citigroup | Maintain | Buy | 2026-01-30 |
| BTIG | Maintain | Buy | 2026-01-29 |
| Stifel | Maintain | Buy | 2026-01-29 |
| RBC Capital | Maintain | Outperform | 2026-01-29 |
| Macquarie | Maintain | Neutral | 2026-01-29 |
| DA Davidson | Maintain | Buy | 2026-01-29 |
| Needham | Maintain | Buy | 2026-01-29 |
| Keybanc | Maintain | Underweight | 2026-01-29 |
| Evercore ISI Group | Maintain | Outperform | 2026-01-29 |
| Cantor Fitzgerald | Maintain | Overweight | 2026-01-29 |
Domo, Inc. Grades
Below are the latest institutional grades for Domo, Inc.:
| Grading Company | Action | New Grade | Date |
|---|---|---|---|
| Lake Street | Maintain | Hold | 2025-12-05 |
| DA Davidson | Maintain | Neutral | 2025-12-05 |
| TD Cowen | Maintain | Buy | 2025-12-05 |
| DA Davidson | Maintain | Neutral | 2025-12-01 |
| JMP Securities | Maintain | Market Outperform | 2025-09-10 |
| DA Davidson | Maintain | Neutral | 2025-08-28 |
| Cantor Fitzgerald | Maintain | Overweight | 2025-08-28 |
| TD Cowen | Upgrade | Buy | 2025-08-26 |
| JMP Securities | Maintain | Market Outperform | 2025-06-25 |
| Cantor Fitzgerald | Maintain | Overweight | 2025-06-25 |
Which company has the best grades?
ServiceNow, Inc. has received more consistent Buy and Outperform grades from multiple top-tier firms. Domo, Inc. shows mixed ratings, including Neutral and Hold, with fewer Buy endorsements. This suggests ServiceNow has stronger institutional confidence, potentially increasing investor interest.
Risks specific to each company
The following categories identify critical pressure points and systemic threats facing ServiceNow, Inc. and Domo, Inc. in the 2026 market environment:
1. Market & Competition
ServiceNow, Inc.
- Dominates enterprise cloud workflow automation with a broad platform and strong partnerships.
Domo, Inc.
- Operates in a niche cloud BI market, facing intense competition and limited scale.
2. Capital Structure & Debt
ServiceNow, Inc.
- Low debt-to-assets at 12.3%, strong interest coverage, stable capital structure.
Domo, Inc.
- High debt-to-assets at 63.2%, negative interest coverage signals financial stress.
3. Stock Volatility
ServiceNow, Inc.
- Beta near 1 (0.979) indicates market-aligned risk and moderate volatility.
Domo, Inc.
- Beta elevated at 1.65, implying higher market sensitivity and price swings.
4. Regulatory & Legal
ServiceNow, Inc.
- Faces typical tech sector regulatory scrutiny; no major issues flagged.
Domo, Inc.
- Similar regulatory environment but smaller scale heightens vulnerability to compliance costs.
5. Supply Chain & Operations
ServiceNow, Inc.
- Robust global operations and partnerships mitigate supply chain risks.
Domo, Inc.
- Smaller, less diversified operations increase exposure to operational disruptions.
6. ESG & Climate Transition
ServiceNow, Inc.
- Large enterprise with resources to invest in ESG initiatives and climate resilience.
Domo, Inc.
- Limited resources restrict ESG program scale, posing reputational and compliance risks.
7. Geopolitical Exposure
ServiceNow, Inc.
- Global footprint exposes it to geopolitical tensions but diversified market reduces impact.
Domo, Inc.
- Less global reach but dependence on key markets can amplify geopolitical risks.
Which company shows a better risk-adjusted profile?
ServiceNow’s low leverage and strong Altman Z-score (6.6, safe zone) indicate robust financial health. Domo’s distress Altman Z-score (-10.2) and high debt load highlight substantial bankruptcy risk. ServiceNow’s market position and capital structure provide a more stable risk-adjusted profile. The most impactful risk for ServiceNow is its high valuation multiples, which could pressure returns. For Domo, heavy debt and weak liquidity remain critical concerns. Recent financial scores confirm ServiceNow’s resilience amid market volatility, while Domo struggles to stabilize its balance sheet.
Final Verdict: Which stock to choose?
ServiceNow, Inc. (NOW) showcases a robust operational engine with steadily growing profitability and efficient capital use. Its superpower lies in consistent income quality and solid cash flow generation. A point of vigilance remains its modest current ratio below 1, suggesting liquidity constraints. NOW suits investors targeting aggressive growth with some tolerance for short-term balance sheet risks.
Domo, Inc. (DOMO) impresses with a potent strategic moat evident in its exceptional ROIC far exceeding WACC, signaling durable competitive advantage. However, it carries higher financial risk and weaker liquidity, making it less stable than NOW. DOMO aligns with investors seeking GARP—growth at a reasonable price—who can withstand volatility in pursuit of outsized returns.
If you prioritize stable growth backed by proven cash flow and moderate leverage, ServiceNow outshines due to its operational resilience and market scale. However, if you seek a higher-risk, high-reward profile with a durable moat and accelerating profitability, Domo offers better growth potential despite current financial fragility. Both present distinct analytical scenarios depending on your risk appetite and investment horizon.
Disclaimer: Investment carries a risk of loss of initial capital. The past performance is not a reliable indicator of future results. Be sure to understand risks before making an investment decision.
Go Further
I encourage you to read the complete analyses of ServiceNow, Inc. and Domo, Inc. to enhance your investment decisions: