In today’s dynamic software landscape, The Trade Desk, Inc. (TTD) and Dayforce Inc (DAY) stand out as influential players driving innovation in digital advertising and human capital management, respectively. Both operate cloud-based platforms that empower businesses with data-driven solutions, reflecting a shared commitment to technology-led growth. This article will explore their market positions and strategies to help you decide which company presents the most compelling investment opportunity in 2026.
Table of contents
Companies Overview
I will begin the comparison between The Trade Desk and Dayforce Inc by providing an overview of these two companies and their main differences.
The Trade Desk Overview
The Trade Desk, Inc. operates a cloud-based platform that enables buyers to create, manage, and optimize data-driven digital advertising campaigns across multiple formats and devices. Founded in 2009 and headquartered in Ventura, California, it serves advertising agencies and service providers globally. The company focuses on technology innovation in digital marketing and holds a market cap of approximately 17.3B USD.
Dayforce Inc Overview
Dayforce Inc. is a human capital management software company offering cloud platforms for HR, payroll, workforce, and talent management. Headquartered in Minneapolis, Minnesota, and incorporated in 2013, it serves clients in the US, Canada, and internationally through direct and third-party sales. With a market cap near 11.1B USD, Dayforce emphasizes integrated HCM solutions for businesses of varying sizes.
Key similarities and differences
Both The Trade Desk and Dayforce operate in the software application industry within the technology sector, providing cloud-based platforms internationally. However, The Trade Desk specializes in digital advertising technology, while Dayforce focuses on human capital management solutions. They differ in market capitalization, employee size, and business models, with The Trade Desk targeting advertisers and agencies, and Dayforce addressing workforce management and payroll services.
Income Statement Comparison
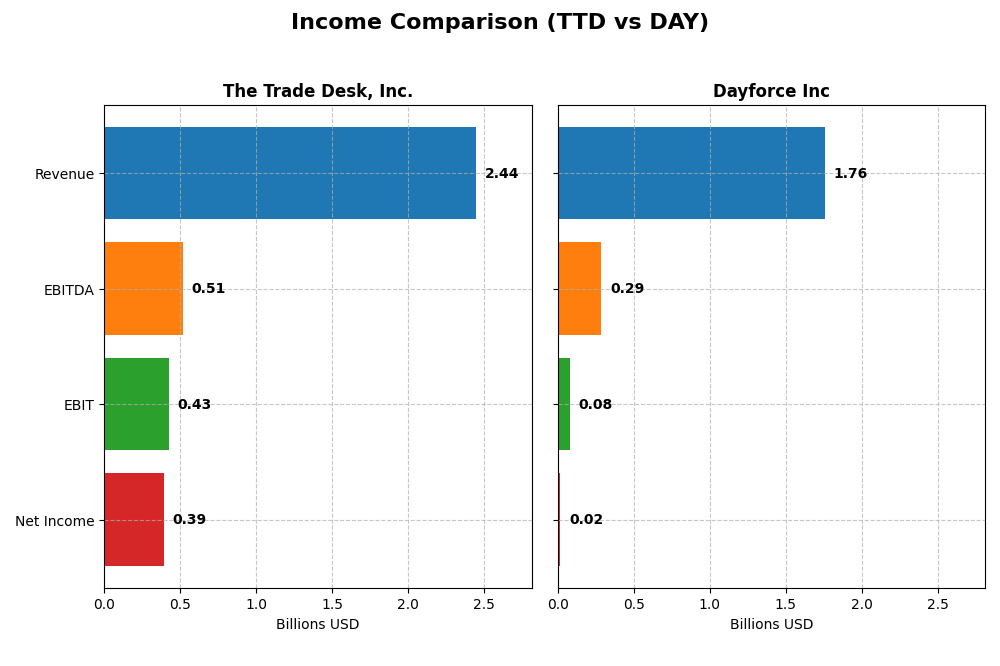
The table below compares key income statement metrics for The Trade Desk, Inc. and Dayforce Inc for the fiscal year 2024, highlighting their financial performance in terms of revenue, profitability, and earnings per share.
| Metric | The Trade Desk, Inc. | Dayforce Inc |
|---|---|---|
| Market Cap | 17.3B | 11.1B |
| Revenue | 2.44B | 1.76B |
| EBITDA | 515M | 288M |
| EBIT | 427M | 78.2M |
| Net Income | 393M | 18.1M |
| EPS | 0.80 | 0.11 |
| Fiscal Year | 2024 | 2024 |
Income Statement Interpretations
The Trade Desk, Inc.
The Trade Desk, Inc. showed strong revenue growth from $836M in 2020 to $2.44B in 2024, with net income rising from $242M to $393M over the same period. Margins remained robust, with a gross margin of 80.69% in 2024. The latest year saw a 25.63% revenue increase and a significant 113.07% EBIT growth, reflecting improved operational efficiency and profitability.
Dayforce Inc
Dayforce Inc’s revenue grew steadily from $843M in 2020 to $1.76B in 2024, while net income improved from a loss of $4M to a modest $18M. Margins were lower, with a gross margin of 46.14% and a net margin of just 1.03% in 2024. The most recent year experienced a 16.27% revenue increase but a 40.8% decline in EBIT, signaling pressure on earnings despite top-line growth.
Which one has the stronger fundamentals?
The Trade Desk exhibits stronger fundamentals with higher margins, more consistent profitability, and greater EBIT expansion in the latest year. Dayforce has shown impressive net income growth over the longer term but continues to face margin compression and declining EBIT recently. Overall, The Trade Desk’s income statement metrics suggest more stable and favorable financial performance.
Financial Ratios Comparison
The table below presents a side-by-side comparison of key financial ratios for The Trade Desk, Inc. (TTD) and Dayforce Inc (DAY) based on the most recent fiscal year 2024 data.
| Ratios | The Trade Desk, Inc. (TTD) | Dayforce Inc (DAY) |
|---|---|---|
| ROE | 13.3% | 0.71% |
| ROIC | 10.0% | 1.31% |
| P/E | 147 | 633 |
| P/B | 19.6 | 4.50 |
| Current Ratio | 1.86 | 1.13 |
| Quick Ratio | 1.86 | 1.13 |
| D/E | 0.11 | 0.48 |
| Debt-to-Assets | 5.1% | 13.5% |
| Interest Coverage | 0 | 2.56 |
| Asset Turnover | 0.40 | 0.19 |
| Fixed Asset Turnover | 5.17 | 7.46 |
| Payout ratio | 0 | 0 |
| Dividend yield | 0 | 0 |
Interpretation of the Ratios
The Trade Desk, Inc.
The Trade Desk shows a generally favorable ratio profile with strong liquidity (current and quick ratios at 1.86) and low leverage (debt to equity at 0.11). Its net margin and return on invested capital are positive, but the high price-to-earnings (PE) and price-to-book (PB) ratios suggest overvaluation risks. The company does not pay dividends, likely focusing on growth and reinvestment.
Dayforce Inc
Dayforce’s ratios indicate weaker profitability and returns, with net margin at 1.03% and return on equity below 1%. Liquidity ratios are moderate, and debt levels are higher but manageable. The PE ratio is very high at 633.29, signaling valuation concerns. Dayforce also does not pay dividends, reflecting a likely reinvestment strategy or growth phase priority.
Which one has the best ratios?
The Trade Desk exhibits a more favorable ratio set overall, with stronger profitability, returns, and liquidity metrics compared to Dayforce. Dayforce’s ratios show more weaknesses and higher valuation multiples, resulting in a less positive financial health assessment in this comparison.
Strategic Positioning
This section compares the strategic positioning of The Trade Desk and Dayforce Inc, including market position, key segments, and exposure to technological disruption:
The Trade Desk, Inc.
- Operates a cloud-based digital advertising platform; faces competition in software applications.
- Focuses on data-driven advertising across multiple channels and devices.
- Leverages cloud technology for advertising; potential risks from evolving ad tech trends.
Dayforce Inc
- Provides cloud HCM and payroll solutions; competes in human capital management software.
- Key segments include Cloud Dayforce services, Powerpay, and professional services.
- Cloud-based HCM platform; exposed to technological shifts in workforce management software.
The Trade Desk, Inc. vs Dayforce Inc Positioning
The Trade Desk pursues a focused strategy in digital advertising technology, while Dayforce offers diversified cloud-based human capital management solutions. The Trade Desk’s specialization contrasts with Dayforce’s broader service range, impacting their market exposure and operational scope.
Which has the best competitive advantage?
Both companies currently shed value, with The Trade Desk showing declining profitability and Dayforce improving ROIC despite value destruction. Their slight unfavorable moat status indicates limited but evolving competitive advantages based on recent capital efficiency trends.
Stock Comparison
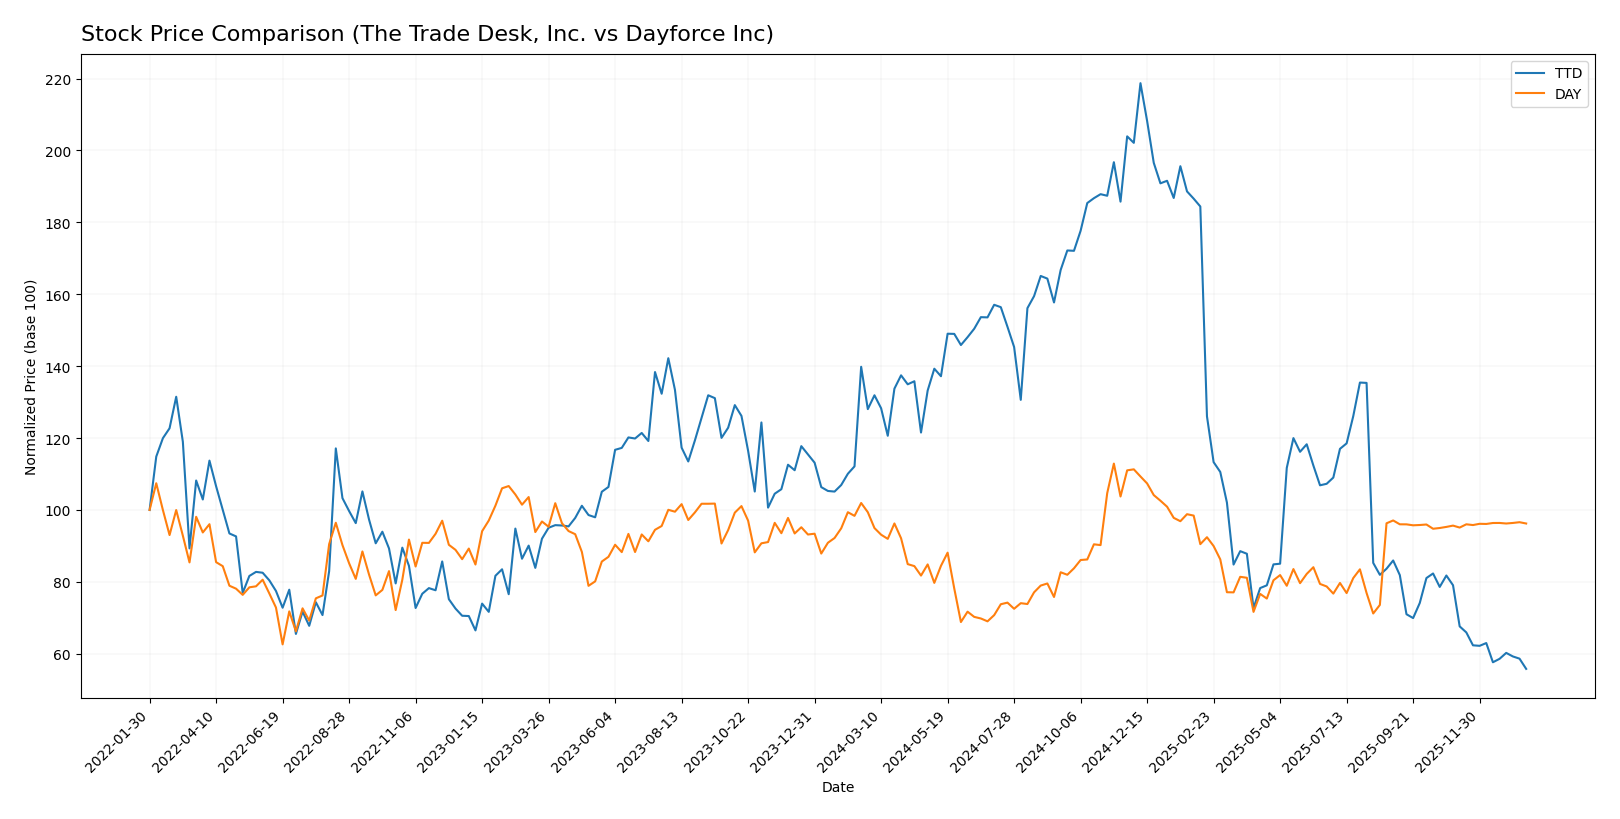
The past year reveals pronounced bearish trends for both The Trade Desk, Inc. and Dayforce Inc, with significant price declines and notable shifts in trading volume dynamics shaping their market behavior.
Trend Analysis
The Trade Desk, Inc. experienced a decisive bearish trend over the past 12 months with a 56.43% price decline and decelerating losses, marked by a high volatility of 28.36 and a recent sharper drop of 29.44%. Dayforce Inc also faced a bearish trend with a 3.16% decrease in stock price and deceleration, but with lower volatility at 7.84 and a slight recent recovery of 0.61%. Comparing the two, The Trade Desk, Inc. delivered the lowest market performance with a substantially larger decline than Dayforce Inc during the same period.
Target Prices
The current analyst consensus reveals a mixed outlook for The Trade Desk, Inc. and Dayforce Inc.
| Company | Target High | Target Low | Consensus |
|---|---|---|---|
| The Trade Desk, Inc. | 98 | 39 | 56.73 |
| Dayforce Inc | 70 | 70 | 70 |
Analysts expect The Trade Desk’s stock to appreciate significantly from its current price of $35.48, with a consensus target of $56.73. Dayforce’s target consensus at $70 aligns closely with its current trading price near $69.16, indicating a stable outlook.
Analyst Opinions Comparison
This section compares analysts’ ratings and grades for The Trade Desk, Inc. (TTD) and Dayforce Inc (DAY):
Rating Comparison
TTD Rating
- Rating: B, considered Very Favorable by analysts.
- Discounted Cash Flow Score: 4, indicating a Favorable valuation based on future cash flows.
- ROE Score: 4, reflecting strong efficiency in generating profit from equity.
- ROA Score: 4, demonstrating effective utilization of assets to generate earnings.
- Debt To Equity Score: 3, a Moderate level of financial risk from debt relative to equity.
- Overall Score: 3, assessed as Moderate overall financial standing.
DAY Rating
- Rating: C-, also considered Very Favorable.
- Discounted Cash Flow Score: 2, showing a Moderate valuation.
- ROE Score: 1, indicating very unfavorable efficiency in profit generation from equity.
- ROA Score: 1, signifying very unfavorable asset utilization.
- Debt To Equity Score: 2, a Moderate but somewhat better financial risk profile than TTD.
- Overall Score: 1, assessed as Very Unfavorable overall financial standing.
Which one is the best rated?
Based strictly on provided data, TTD is better rated with a B rating and higher scores in discounted cash flow, ROE, ROA, and overall financial standing. DAY’s scores are generally lower, reflecting a weaker financial profile despite the same Very Favorable analyst status.
Scores Comparison
The following table presents a comparison of the Altman Z-Score and Piotroski Score for The Trade Desk, Inc. and Dayforce Inc:
TTD Scores
- Altman Z-Score: 4.30, indicating a safe zone with low bankruptcy risk.
- Piotroski Score: 5, reflecting average financial strength.
DAY Scores
- Altman Z-Score: 1.24, indicating a distress zone with high bankruptcy risk.
- Piotroski Score: 5, reflecting average financial strength.
Which company has the best scores?
Based on the provided data, The Trade Desk, Inc. has a significantly stronger Altman Z-Score, placing it in the safe zone, while Dayforce Inc falls into the distress zone. Both companies share an identical Piotroski Score of 5, indicating average financial health.
Grades Comparison
The following tables display recent grades assigned to The Trade Desk, Inc. and Dayforce Inc by reputable financial institutions:
The Trade Desk, Inc. Grades
This table shows recent analyst grades and actions for The Trade Desk, Inc.:
| Grading Company | Action | New Grade | Date |
|---|---|---|---|
| Morgan Stanley | Maintain | Equal Weight | 2026-01-13 |
| Wells Fargo | Maintain | Equal Weight | 2026-01-12 |
| Cantor Fitzgerald | Maintain | Neutral | 2026-01-08 |
| Wolfe Research | Maintain | Outperform | 2026-01-06 |
| Guggenheim | Maintain | Buy | 2026-01-05 |
| Jefferies | Maintain | Hold | 2025-12-11 |
| Wedbush | Maintain | Neutral | 2025-12-08 |
| DA Davidson | Maintain | Buy | 2025-11-10 |
| Truist Securities | Maintain | Buy | 2025-11-07 |
| Wells Fargo | Maintain | Equal Weight | 2025-11-07 |
The Trade Desk’s grades predominantly range from Hold/Neutral to Buy and Outperform, indicating stable to moderately positive analyst sentiment.
Dayforce Inc Grades
This table shows recent analyst grades and actions for Dayforce Inc:
| Grading Company | Action | New Grade | Date |
|---|---|---|---|
| Needham | Maintain | Hold | 2025-10-30 |
| Stifel | Downgrade | Hold | 2025-09-19 |
| Citigroup | Downgrade | Neutral | 2025-09-17 |
| Wells Fargo | Upgrade | Equal Weight | 2025-08-22 |
| BMO Capital | Downgrade | Market Perform | 2025-08-22 |
| Keybanc | Downgrade | Sector Weight | 2025-08-22 |
| Needham | Downgrade | Hold | 2025-08-22 |
| Barclays | Maintain | Equal Weight | 2025-08-22 |
| Deutsche Bank | Maintain | Hold | 2025-08-22 |
| Jefferies | Maintain | Hold | 2025-08-21 |
Dayforce’s recent grades show a trend of downgrades from Buy/Outperform to Hold/Neutral and Market Perform, reflecting a more cautious analyst outlook.
Which company has the best grades?
The Trade Desk holds a stronger consensus with 28 Buy ratings and an overall Buy consensus, compared to Dayforce’s 7 Buy and a Hold consensus. This suggests The Trade Desk currently receives more positive analyst sentiment, which could influence investor confidence and portfolio decisions accordingly.
Strengths and Weaknesses
Below is a comparison of key strengths and weaknesses for The Trade Desk, Inc. (TTD) and Dayforce Inc (DAY) based on recent financial and operational data.
| Criterion | The Trade Desk, Inc. (TTD) | Dayforce Inc (DAY) |
|---|---|---|
| Diversification | Primarily focused on digital advertising technology; limited product diversification | Strong product diversification with Cloud Dayforce, Powerpay, and professional services |
| Profitability | Favorable net margin (16.08%) and ROIC (10.02%); but high valuation multiples (PE 146.77) | Low profitability with net margin (1.03%) and ROIC (1.31%); very high PE (633.29) |
| Innovation | Moderate innovation with declining ROIC trend; slightly unfavorable moat status | Improving profitability trend with rapidly growing ROIC; slightly unfavorable moat status |
| Global presence | Established global digital advertising reach | Expanding cloud-based HR and payroll services globally |
| Market Share | Significant share in programmatic ad tech; asset turnover low at 0.4 | Growing market share in cloud HR services; asset turnover low at 0.19 |
Key takeaways: TTD shows stronger profitability and financial health but faces challenges with valuation and declining returns. DAY demonstrates rapid improvement in profitability and diversified revenue streams but remains less profitable overall with a higher risk profile. Investors should weigh TTD’s stability against DAY’s growth potential carefully.
Risk Analysis
Below is a comparison of key risk factors for The Trade Desk, Inc. (TTD) and Dayforce Inc (DAY) based on the most recent data from 2024.
| Metric | The Trade Desk, Inc. (TTD) | Dayforce Inc (DAY) |
|---|---|---|
| Market Risk | Beta 1.105 (moderate) | Beta 1.181 (moderate-high) |
| Debt level | Debt/Equity 0.11 (low) | Debt/Equity 0.48 (moderate) |
| Regulatory Risk | Moderate, tech sector rules | Moderate, HR/payroll regulations |
| Operational Risk | Low, cloud platform stable | Moderate, complex HR solutions |
| Environmental Risk | Low, software based | Low, software based |
| Geopolitical Risk | Moderate, US-based global | Moderate, US-based global |
The most likely and impactful risks center on Dayforce’s higher financial leverage and operational complexity, which elevate its exposure to debt servicing and execution challenges. The Trade Desk’s main concerns include market volatility given its high valuation multiples and reliance on digital ad spending trends. Both companies operate in moderately regulated tech sectors with low environmental risks.
Which Stock to Choose?
The Trade Desk, Inc. (TTD) shows a strong income evolution with 25.63% revenue growth in 2024 and a favorable net margin of 16.08%. Its financial ratios are mostly favorable, including low debt and high current ratios, with a very favorable B rating despite high valuation multiples. However, its economic moat is slightly unfavorable due to declining ROIC and value shedding.
Dayforce Inc (DAY) presents moderate income growth at 16.27% in 2024, but with lower profitability metrics: a 1.03% net margin and several unfavorable ratios. The company carries higher debt levels and a distressed Altman Z-Score, though it shows improving ROIC trends. Its overall rating is very favorable C- but reflects some financial instability.
Investors prioritizing financial strength and stable profitability might view The Trade Desk as more favorable given its higher margins and stronger ratios, while those focusing on improving profitability and growth potential could see Dayforce’s improving ROIC trend as a positive sign despite higher risk. The choice could depend on one’s risk tolerance and investment strategy.
Disclaimer: Investment carries a risk of loss of initial capital. The past performance is not a reliable indicator of future results. Be sure to understand risks before making an investment decision.
Go Further
I encourage you to read the complete analyses of The Trade Desk, Inc. and Dayforce Inc to enhance your investment decisions: