In the dynamic landscape of software applications, Dayforce Inc (DAY) and ServiceTitan, Inc. (TTAN) stand out as innovative players shaping human capital and field service management. Both companies target overlapping markets with cloud-based solutions but approach growth through distinct innovation strategies and customer focuses. This article will analyze their strengths and risks to help you decide which company presents the most compelling investment opportunity in 2026.
Table of contents
Companies Overview
I will begin the comparison between Dayforce Inc and ServiceTitan, Inc. by providing an overview of these two companies and their main differences.
Dayforce Inc Overview
Dayforce Inc operates as a human capital management (HCM) software company providing a cloud HCM platform with human resources, payroll, benefits, workforce management, and talent management functionalities. It also offers solutions for small businesses and payroll services, targeting markets in the US, Canada, and internationally. Headquartered in Minneapolis, Dayforce has a market cap of 11.1B USD and employs about 9,600 people.
ServiceTitan, Inc. Overview
ServiceTitan, Inc. specializes in software supporting field service activities for residential and commercial infrastructure installation, maintenance, and servicing. Founded in 2008 and based in Glendale, California, it serves the technology sector with a focus on application software. The company has a market cap of 8.5B USD and employs approximately 3,000 people.
Key similarities and differences
Both companies operate in the technology sector under the software application industry, focusing on cloud-based solutions. Dayforce centers on human capital management software, while ServiceTitan targets field service management for infrastructure. Dayforce is larger in market capitalization and workforce, whereas ServiceTitan, a younger company, trades on NASDAQ compared to Dayforce’s NYSE listing. Their business models serve distinct operational needs within the software market.
Income Statement Comparison
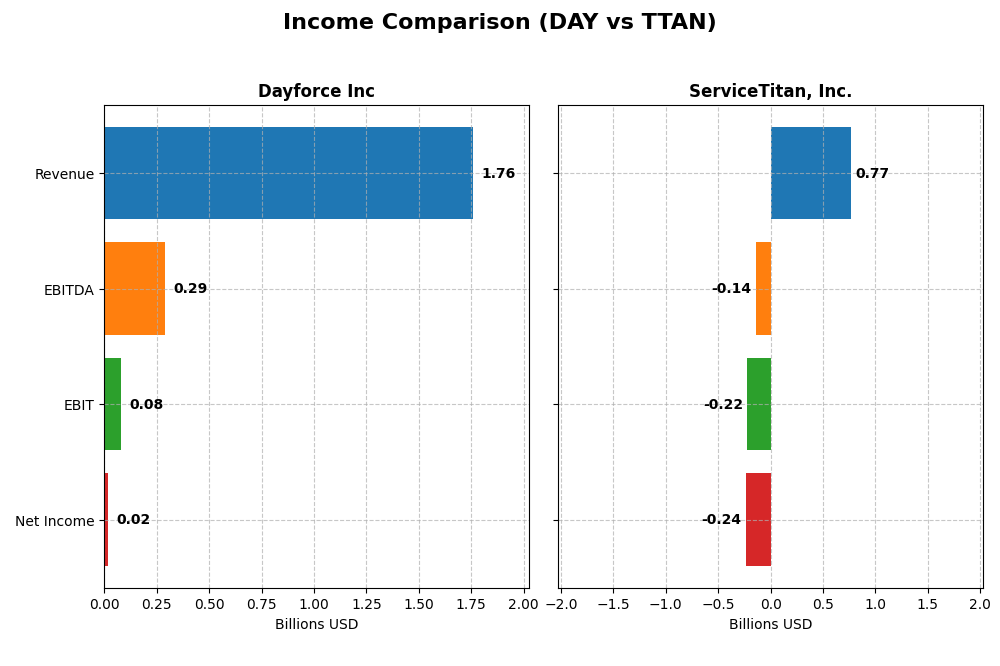
This table presents a side-by-side comparison of key income statement metrics for Dayforce Inc and ServiceTitan, Inc. based on their most recent fiscal years.
| Metric | Dayforce Inc (2024) | ServiceTitan, Inc. (2025) |
|---|---|---|
| Market Cap | 11.1B | 8.5B |
| Revenue | 1.76B | 772M |
| EBITDA | 288M | -141M |
| EBIT | 78.2M | -221M |
| Net Income | 18.1M | -239M |
| EPS | 0.11 | -8.53 |
| Fiscal Year | 2024 | 2025 |
Income Statement Interpretations
Dayforce Inc
Dayforce Inc showed strong revenue growth from 2020 to 2024, rising from $842M to $1.76B, with net income turning positive after losses in earlier years. Gross margin remained favorable at 46.14%, while EBIT margin was neutral at 4.44%. In 2024, revenue grew 16.3% but EBIT declined 40.8%, reflecting margin pressure despite higher top-line growth.
ServiceTitan, Inc.
ServiceTitan, Inc. experienced revenue growth from $468M in 2023 to $772M in 2025, with gross margin favorable at 64.9%. However, EBIT margin was deeply negative at -28.67%, and net margin also unfavorable at -30.98%. The latest year saw revenue up 25.6%, but continued operating losses and EPS deterioration highlight ongoing profitability challenges.
Which one has the stronger fundamentals?
Both companies exhibit favorable revenue and gross profit growth, but Dayforce demonstrates a more consistent path to profitability, with positive net income and improving margins over five years. ServiceTitan shows higher gross margins but sustained and significant operating losses, signaling weaker earnings fundamentals despite growth. Overall, Dayforce’s income statement metrics suggest comparatively stronger financial health.
Financial Ratios Comparison
Below is a comparison of key financial ratios for Dayforce Inc and ServiceTitan, Inc. based on their most recent reported fiscal year data.
| Ratios | Dayforce Inc (2024) | ServiceTitan, Inc. (2025) |
|---|---|---|
| ROE | 0.71% | -16.44% |
| ROIC | 1.31% | -14.11% |
| P/E | 633.29 | -18.12 |
| P/B | 4.50 | 2.98 |
| Current Ratio | 1.13 | 3.74 |
| Quick Ratio | 1.13 | 3.74 |
| D/E | 0.48 | 0.11 |
| Debt-to-Assets | 13.52% | 9.35% |
| Interest Coverage | 2.56 | -14.82 |
| Asset Turnover | 0.19 | 0.44 |
| Fixed Asset Turnover | 7.46 | 9.57 |
| Payout Ratio | 0 | 0 |
| Dividend Yield | 0% | 0% |
Interpretation of the Ratios
Dayforce Inc
Dayforce Inc shows mostly unfavorable profitability ratios, with a net margin of 1.03% and ROE at 0.71%, indicating weak earnings performance. The company has a high P/E of 633.29 and moderate leverage with a debt-to-equity of 0.48. Liquidity ratios are neutral to favorable, but interest coverage is low at 1.93. Dayforce does not pay dividends, likely prioritizing growth and reinvestment.
ServiceTitan, Inc.
ServiceTitan exhibits negative profitability metrics, including a net margin of -30.98% and ROE of -16.44%, reflecting ongoing losses. The firm maintains a low debt-to-equity ratio of 0.11 and a strong quick ratio of 3.74, though its current ratio is flagged unfavorable. A negative P/E ratio reflects its unprofitability. ServiceTitan also pays no dividends, consistent with reinvestment and growth focus.
Which one has the best ratios?
Comparing both, Dayforce has more unfavorable profitability ratios and a much higher P/E, while ServiceTitan shows deeper losses but better capital structure and liquidity ratios. Dayforce’s fixed asset turnover is favorable but offset by weak returns. ServiceTitan’s ratios suggest early-stage challenges with slightly better leverage and liquidity, resulting in a slightly unfavorable overall rating versus Dayforce’s unfavorable standing.
Strategic Positioning
This section compares the strategic positioning of Dayforce Inc and ServiceTitan, Inc., including Market position, Key segments, and exposure to disruption:
Dayforce Inc
- Large market cap of 11B with competitive pressure in cloud HCM software
- Key segments: Cloud HCM platform, payroll, benefits, workforce management, and small business payroll
- Exposure to technological disruption through cloud-based HR and payroll solutions
ServiceTitan, Inc.
- Smaller market cap of 8.5B, focused on field service software
- Key segments: platform and subscription revenue from field service activities
- Exposure focused on digitalizing field service infrastructure and maintenance
Dayforce Inc vs ServiceTitan, Inc. Positioning
Dayforce has a diversified approach with multiple HCM services and payroll solutions, supporting a broad client base. ServiceTitan concentrates on field service software, focusing on niche operational efficiencies but with less diversification.
Which has the best competitive advantage?
Both companies are shedding value relative to their cost of capital. Dayforce shows a growing ROIC trend, while ServiceTitan’s profitability is stable but unfavorable, indicating Dayforce may have a slightly stronger competitive moat despite current challenges.
Stock Comparison
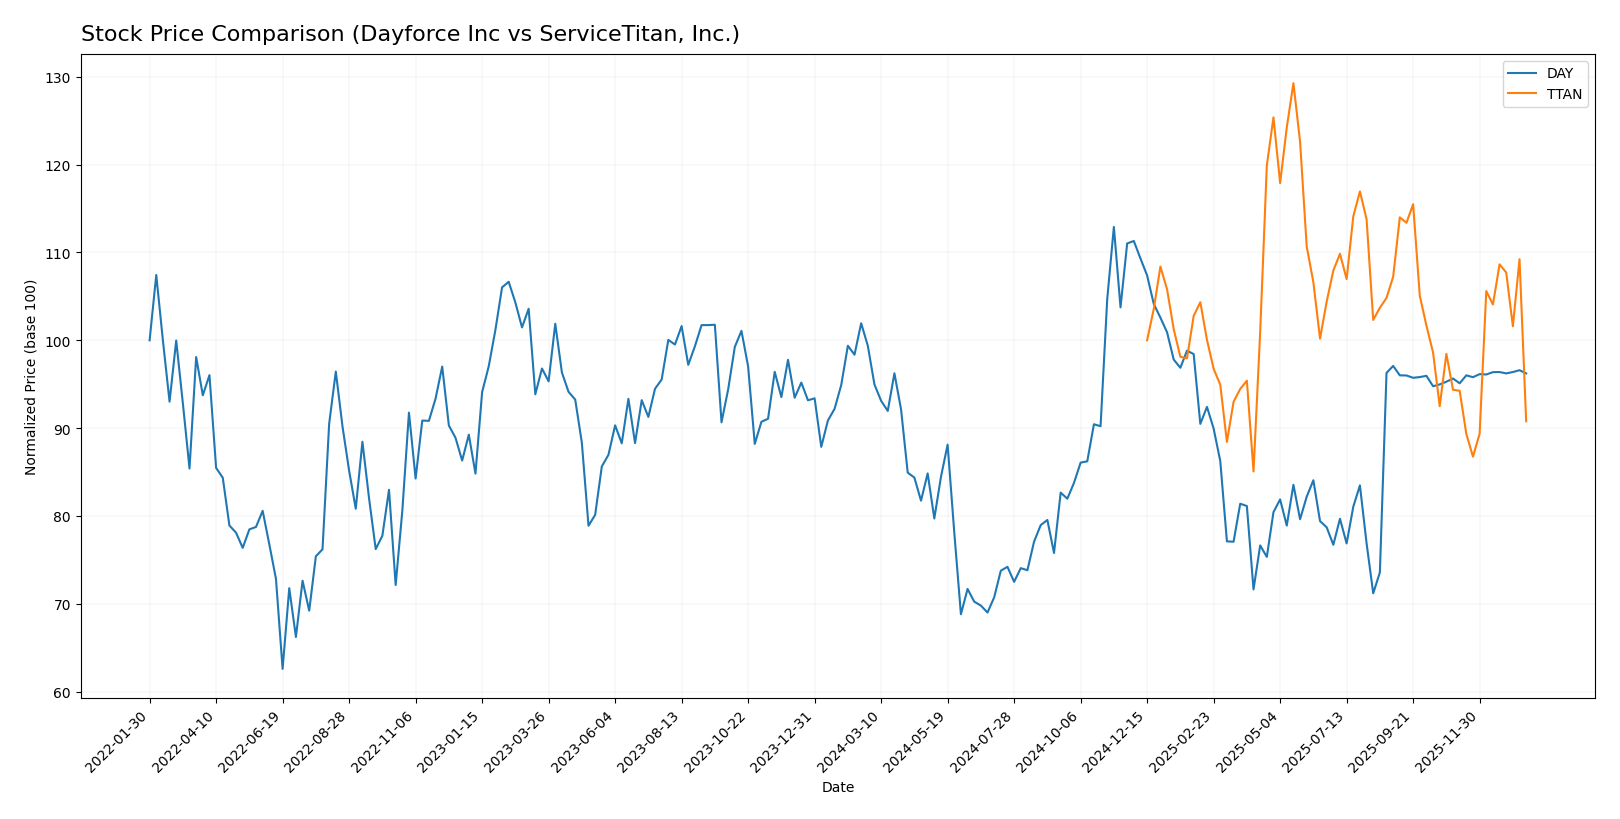
The stock prices of Dayforce Inc and ServiceTitan, Inc. have exhibited notable bearish trends over the past 12 months, with differing momentum and trading volume dynamics influencing their relative performance.
Trend Analysis
Dayforce Inc’s stock price declined by 3.16% over the past year, indicating a bearish trend with deceleration. The price fluctuated between a high of 81.14 and a low of 49.46, with a standard deviation of 7.84 reflecting moderate volatility.
ServiceTitan, Inc.’s stock showed a steeper 9.22% decline over the same period, confirming a bearish trend with accelerating downward momentum. The price ranged from 129.26 to 85.07, with higher volatility measured by a 9.86 standard deviation.
Comparing the two, Dayforce Inc delivered a less severe decline and outperformed ServiceTitan, Inc., which experienced a more pronounced negative trend and higher volatility over the past year.
Target Prices
The consensus target prices for Dayforce Inc and ServiceTitan, Inc. suggest positive upside potential based on analyst evaluations.
| Company | Target High | Target Low | Consensus |
|---|---|---|---|
| Dayforce Inc | 70 | 70 | 70 |
| ServiceTitan, Inc. | 145 | 117 | 132.44 |
Analysts expect Dayforce’s stock to hold steady near its current price of $69.16, while ServiceTitan’s consensus target price of $132.44 implies significant upside from its current $90.78 level.
Analyst Opinions Comparison
This section compares analysts’ ratings and grades for Dayforce Inc and ServiceTitan, Inc.:
Rating Comparison
Dayforce Inc Rating
- Rating: C-, classified as Very Favorable
- Discounted Cash Flow Score: 2, indicating Moderate status
- ROE Score: 1, indicating Very Unfavorable status
- ROA Score: 1, indicating Very Unfavorable status
- Debt To Equity Score: 2, indicating Moderate status
- Overall Score: 1, indicating Very Unfavorable status
ServiceTitan, Inc. Rating
- Rating: C-, classified as Very Favorable
- Discounted Cash Flow Score: 1, indicating Very Unfavorable
- ROE Score: 1, indicating Very Unfavorable status
- ROA Score: 1, indicating Very Unfavorable status
- Debt To Equity Score: 3, indicating Moderate status
- Overall Score: 1, indicating Very Unfavorable status
Which one is the best rated?
Both Dayforce Inc and ServiceTitan, Inc. share the same overall rating of C- and identical overall scores of 1. Dayforce shows a better discounted cash flow score, while ServiceTitan has a higher debt to equity score.
Scores Comparison
Here is a comparison of the Altman Z-Score and Piotroski Score for Dayforce Inc and ServiceTitan, Inc.:
Dayforce Inc Scores
- Altman Z-Score: 1.24, indicating financial distress zone
- Piotroski Score: 5, representing an average financial health
ServiceTitan, Inc. Scores
- Altman Z-Score: 15.74, well within the safe zone
- Piotroski Score: 6, also showing average financial health
Which company has the best scores?
ServiceTitan, Inc. has a significantly higher Altman Z-Score, placing it in the safe zone, unlike Dayforce Inc in distress. Both have average Piotroski Scores, with ServiceTitan slightly higher. Overall, ServiceTitan shows stronger financial stability based on these scores.
Grades Comparison
Here is a comparison of the recent grades and rating trends for Dayforce Inc and ServiceTitan, Inc.:
Dayforce Inc Grades
The table below shows Dayforce Inc’s latest grades from recognized grading companies.
| Grading Company | Action | New Grade | Date |
|---|---|---|---|
| Needham | Maintain | Hold | 2025-10-30 |
| Stifel | Downgrade | Hold | 2025-09-19 |
| Citigroup | Downgrade | Neutral | 2025-09-17 |
| Wells Fargo | Upgrade | Equal Weight | 2025-08-22 |
| BMO Capital | Downgrade | Market Perform | 2025-08-22 |
| Keybanc | Downgrade | Sector Weight | 2025-08-22 |
| Needham | Downgrade | Hold | 2025-08-22 |
| Barclays | Maintain | Equal Weight | 2025-08-22 |
| Deutsche Bank | Maintain | Hold | 2025-08-22 |
| Jefferies | Maintain | Hold | 2025-08-21 |
Dayforce’s grades show a general downgrade trend from Buy/Outperform levels toward Hold/Equal Weight ratings in recent months.
ServiceTitan, Inc. Grades
Below is a summary of recent grades for ServiceTitan, Inc. from established grading firms.
| Grading Company | Action | New Grade | Date |
|---|---|---|---|
| Piper Sandler | Maintain | Overweight | 2025-12-05 |
| BMO Capital | Maintain | Outperform | 2025-12-05 |
| TD Cowen | Maintain | Buy | 2025-12-05 |
| Morgan Stanley | Maintain | Equal Weight | 2025-12-05 |
| BMO Capital | Maintain | Outperform | 2025-11-20 |
| Wells Fargo | Maintain | Overweight | 2025-09-19 |
| Stifel | Maintain | Buy | 2025-09-19 |
| Piper Sandler | Maintain | Overweight | 2025-09-19 |
| Canaccord Genuity | Maintain | Buy | 2025-09-19 |
| Citigroup | Maintain | Neutral | 2025-09-09 |
ServiceTitan maintains predominantly Buy and Outperform ratings with consistent positive assessments over the last year.
Which company has the best grades?
ServiceTitan, Inc. holds a stronger consensus with many Buy and Outperform grades, while Dayforce Inc shows a general downgrade trend to Hold ratings. Investors may interpret ServiceTitan’s better grades as greater analyst confidence, potentially influencing portfolio allocation decisions.
Strengths and Weaknesses
Below is a comparison of key strengths and weaknesses for Dayforce Inc and ServiceTitan, Inc based on their latest financial and strategic data.
| Criterion | Dayforce Inc | ServiceTitan, Inc. |
|---|---|---|
| Diversification | Moderate: Main revenues from Cloud Dayforce and Powerpay recurring services plus professional services | Focused: Primarily platform and subscription revenues with less product variety |
| Profitability | Low profitability: Net margin 1.03%, ROIC 1.31%, shedding value but improving ROIC trend | Negative profitability: Net margin -30.98%, ROIC -14.11%, stable but unfavorable |
| Innovation | Moderate: Growing ROIC trend suggests operational improvements | Unclear: Neutral ROIC trend, innovation impact less evident |
| Global presence | Established recurring services indicate broad adoption | Growing platform revenue suggests expanding footprint |
| Market Share | Solid in cloud workforce management, but intense competition | Niche in service management software, but financially challenged |
Key takeaways: Dayforce shows improving profitability and operational efficiency despite current value destruction, indicating potential for recovery. ServiceTitan struggles with significant losses and neutral growth trends, requiring cautious evaluation before investment. Both companies face risks, but Dayforce’s growth trajectory appears more promising.
Risk Analysis
The table below summarizes key risk factors for Dayforce Inc and ServiceTitan, Inc. based on the most recent financial and operational data.
| Metric | Dayforce Inc (DAY) | ServiceTitan, Inc. (TTAN) |
|---|---|---|
| Market Risk | Beta 1.18; moderate volatility | Beta -0.85; inverse market correlation |
| Debt level | Debt/Equity 0.48; moderate debt load | Debt/Equity 0.11; low leverage |
| Regulatory Risk | Moderate; operates in multiple jurisdictions | Moderate; US-focused, subject to tech regulations |
| Operational Risk | High; large workforce (9.6K employees), integration challenges | Moderate; smaller size (3K employees), growth phase risks |
| Environmental Risk | Low; software sector, minimal direct impact | Low; software sector, minimal direct impact |
| Geopolitical Risk | Moderate; international exposure | Low; primarily US operations |
The most significant risks for Dayforce are operational complexity and moderate leverage, alongside unfavorable profitability ratios, increasing financial vulnerability. ServiceTitan faces high market risk due to negative beta and operational challenges typical for a younger company, but benefits from low debt and a strong Altman Z-score, indicating lower bankruptcy risk. Both companies have limited environmental risk but must navigate regulatory uncertainties in their sectors.
Which Stock to Choose?
Dayforce Inc (DAY) shows favorable income growth with a 108.9% revenue increase over five years and positive net income trends, despite some recent margin declines. Its financial ratios are mostly unfavorable, though it benefits from low debt levels and a favorable quick ratio. The company’s profitability is improving but remains low, and it currently carries moderate net debt. Its overall rating is very favorable, yet key profitability scores are weak.
ServiceTitan, Inc. (TTAN) exhibits strong recent revenue growth of 25.64% and a higher gross margin of 64.9%, but suffers from significant negative net margin and profitability ratios. Debt levels are low, and some ratios like quick ratio and fixed asset turnover are favorable. However, the company is shedding value with an unfavorable moat status and a very unfavorable overall rating despite a safe Altman Z-Score.
Investors focused on growth and appreciating improving profitability trends might find Dayforce’s favorable income evolution and rating appealing, while those who prioritize financial stability and lower debt exposure could see ServiceTitan’s stronger liquidity and safe bankruptcy score as positive. Each stock’s profile could appeal differently depending on risk tolerance and investment strategy.
Disclaimer: Investment carries a risk of loss of initial capital. The past performance is not a reliable indicator of future results. Be sure to understand risks before making an investment decision.
Go Further
I encourage you to read the complete analyses of Dayforce Inc and ServiceTitan, Inc. to enhance your investment decisions: