Home > Comparison > Technology > NOW vs DAY
The strategic rivalry between ServiceNow, Inc. and Dayforce Inc. shapes the evolution of enterprise software solutions. ServiceNow dominates as a broad-based workflow automation platform, while Dayforce specializes in human capital management software. This contrast reflects a broader battle between platform scale and niche focus. This analysis aims to identify which company offers superior risk-adjusted returns, guiding investors in constructing a balanced, future-proof technology portfolio.
Table of contents
Companies Overview
ServiceNow and Dayforce stand as pivotal players in the software application market, shaping enterprise workflows and human capital management.
ServiceNow, Inc.: Leader in Enterprise Workflow Automation
ServiceNow dominates the enterprise cloud computing sector with its Now platform, offering workflow automation, AI, and IT service management. Its core revenue stems from subscription-based solutions that streamline IT operations and business service delivery. In 2026, ServiceNow emphasizes expanding automation capabilities and strategic partnerships to enhance process efficiency across industries.
Dayforce Inc: Human Capital Management Innovator
Dayforce excels in the human capital management (HCM) software space, generating revenue through its cloud-based platform for HR, payroll, and workforce management. It targets both large enterprises and small businesses with tailored solutions like Powerpay. The company’s 2026 strategy focuses on broadening its global footprint and enhancing payroll and talent management functionalities.
Strategic Collision: Similarities & Divergences
Both companies operate in the software application industry but diverge in focus—ServiceNow pursues a broad enterprise workflow automation ecosystem, while Dayforce zeroes in on specialized HCM solutions. Their competition centers on delivering seamless cloud platforms that optimize business processes and workforce efficiency. Investors face distinct profiles: ServiceNow offers scale and integration breadth, whereas Dayforce provides targeted human capital management expertise.
Income Statement Comparison
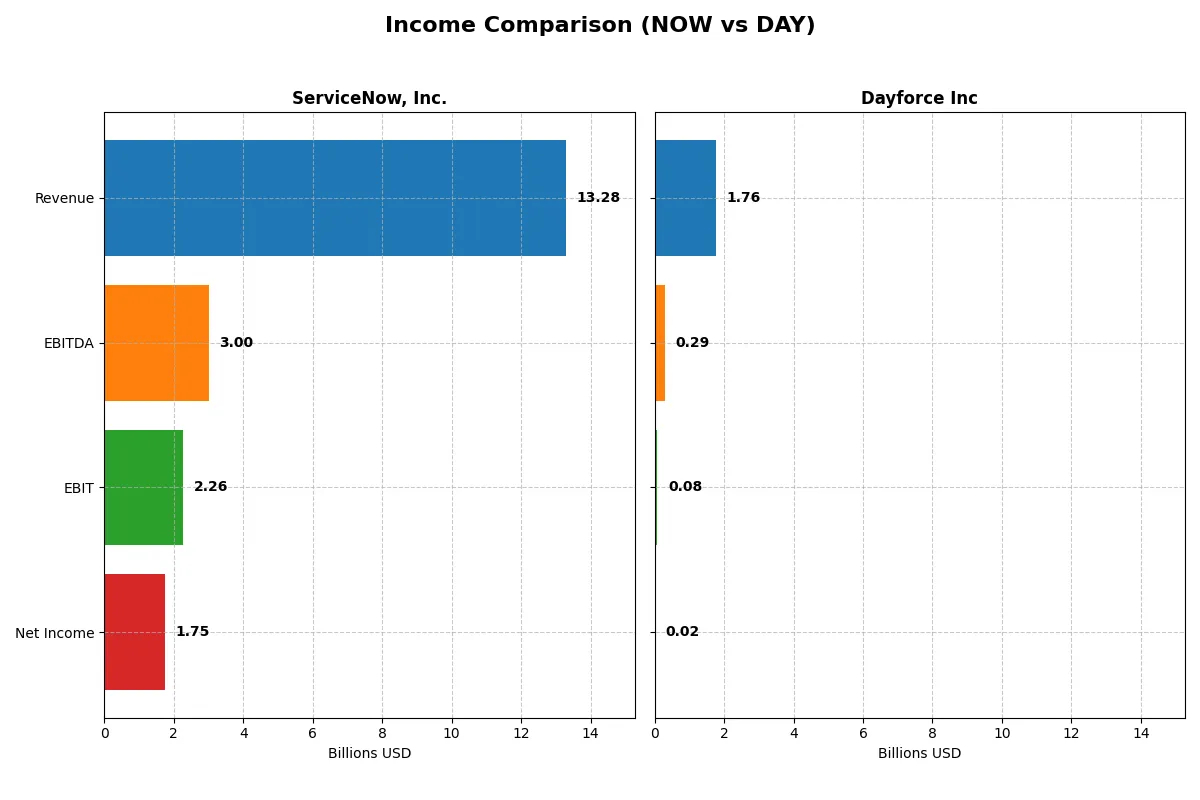
This data dissects the core profitability and scalability of both corporate engines to reveal who dominates the bottom line:
| Metric | ServiceNow, Inc. (NOW) | Dayforce Inc (DAY) |
|---|---|---|
| Revenue | 13.3B | 1.76B |
| Cost of Revenue | 3.0B | 948M |
| Operating Expenses | 8.47B | 708M |
| Gross Profit | 10.3B | 812M |
| EBITDA | 3.0B | 288M |
| EBIT | 2.26B | 78.2M |
| Interest Expense | 0 | 40.6M |
| Net Income | 1.75B | 18.1M |
| EPS | 1.69 | 0.11 |
| Fiscal Year | 2025 | 2024 |
Income Statement Analysis: The Bottom-Line Duel
This income statement comparison reveals the true efficiency and profitability of ServiceNow, Inc. and Dayforce Inc as corporate engines.
ServiceNow, Inc. Analysis
ServiceNow’s revenue surged from 5.9B in 2021 to 13.3B in 2025, with net income jumping from 230M to 1.75B. Its gross margin holds strong at 77.5%, while the net margin improved to 13.2%, signaling robust profitability. In 2025, ServiceNow accelerated EBIT by 28%, reflecting operational momentum and disciplined cost control.
Dayforce Inc Analysis
Dayforce grew revenue from 842M in 2020 to 1.76B in 2024, with net income rising from a -4M loss to 18M profit. Gross margin stands at a favorable 46.1%, but net margin remains thin at just 1%. Despite solid revenue gains, Dayforce’s EBIT declined 41% in the latest year, indicating challenges in scaling operating efficiency.
Verdict: Margin Strength vs. Growth Struggles
ServiceNow dominates with superior margins and accelerating profitability, demonstrating operational excellence and scalable growth. Dayforce shows impressive top-line growth but struggles with thin net margins and deteriorating EBIT. For investors, ServiceNow’s profile offers a more attractive balance of growth and sustainable earnings power.
Financial Ratios Comparison
These vital ratios act as a diagnostic tool to expose the underlying fiscal health, valuation premiums, and capital efficiency of the companies compared below:
| Ratios | ServiceNow (NOW) | Dayforce (DAY) |
|---|---|---|
| ROE | 13.5% | 0.7% |
| ROIC | 9.0% | 1.3% |
| P/E | 90.9 | 633.3 |
| P/B | 12.3 | 4.5 |
| Current Ratio | 0.95 | 1.13 |
| Quick Ratio | 0.95 | 1.13 |
| D/E | 0.25 | 0.48 |
| Debt-to-Assets | 12.3% | 13.5% |
| Interest Coverage | 0 | 2.6 |
| Asset Turnover | 0.51 | 0.19 |
| Fixed Asset Turnover | 4.29 | 7.46 |
| Payout ratio | 0 | 0 |
| Dividend yield | 0 | 0 |
| Fiscal Year | 2025 | 2024 |
Efficiency & Valuation Duel: The Vital Signs
Financial ratios act as a company’s DNA, exposing hidden risks and operational excellence that numbers alone cannot reveal.
ServiceNow, Inc.
ServiceNow displays a solid net margin of 13.16% and a neutral ROE of 13.48%, signaling consistent profitability. Its P/E ratio at 90.88 indicates a stretched valuation relative to earnings. The company does not pay dividends, instead reinvesting heavily in R&D to fuel growth and maintain its competitive edge.
Dayforce Inc
Dayforce struggles with thin profitability metrics, showing a net margin of 1.03% and an ROE of just 0.71%, both unfavorable. Its P/E ratio soars to 633.29, marking the stock as highly expensive. The firm neither offers dividends nor robust cash returns, focusing on internal investments amid operational challenges.
Premium Valuation vs. Operational Safety
ServiceNow balances profitability with a stretched valuation but retains favorable leverage and asset efficiency. Dayforce’s ratios reveal weak profitability and a sky-high valuation, raising risk concerns. Investors seeking growth with operational discipline may lean toward ServiceNow, while those tolerating risk face Dayforce’s volatile profile.
Which one offers the Superior Shareholder Reward?
ServiceNow (NOW) and Dayforce (DAY) both eschew dividends, focusing on reinvestment and buybacks. NOW’s free cash flow per share of 4.41 and aggressive buybacks create sustainable shareholder value. DAY’s weaker FCF at 1.09 and limited buyback intensity offer less total return. I favor ServiceNow’s distribution model for superior long-term reward in 2026.
Comparative Score Analysis: The Strategic Profile
The radar chart reveals the fundamental DNA and trade-offs of ServiceNow, Inc. and Dayforce Inc, highlighting their core financial strengths and vulnerabilities:
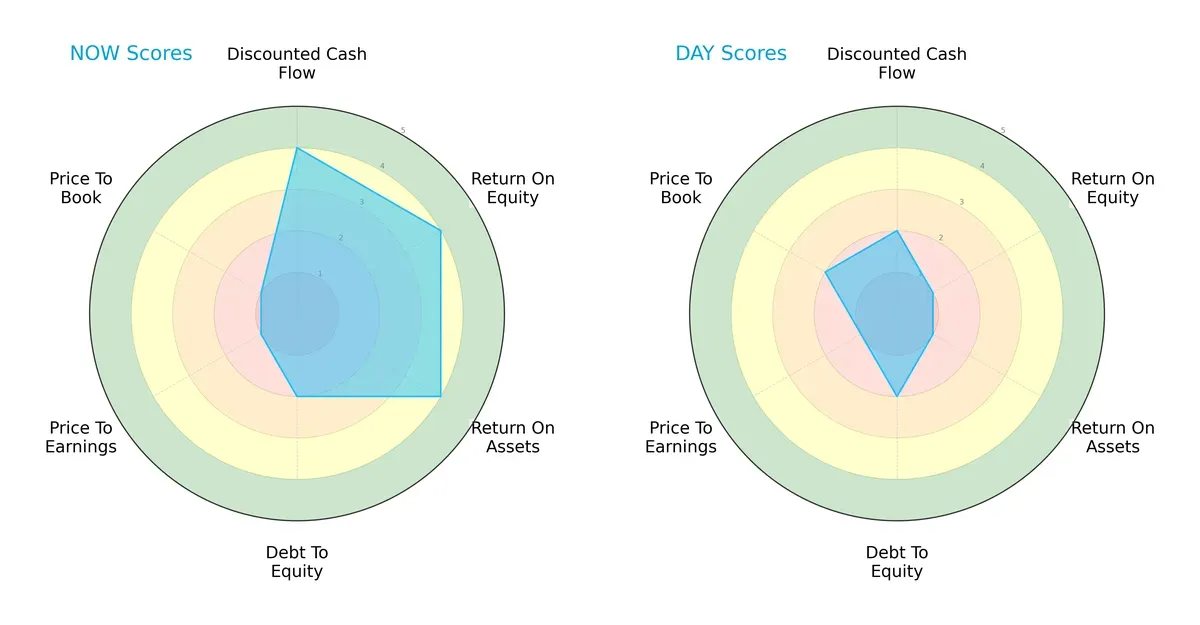
ServiceNow demonstrates strong operational efficiency with high DCF, ROE, and ROA scores, but suffers from poor valuation metrics (PE/PB). Dayforce shows weaker profitability but maintains a comparable debt profile. ServiceNow’s profile is more balanced, while Dayforce relies heavily on moderate leverage and undervalued book ratios.
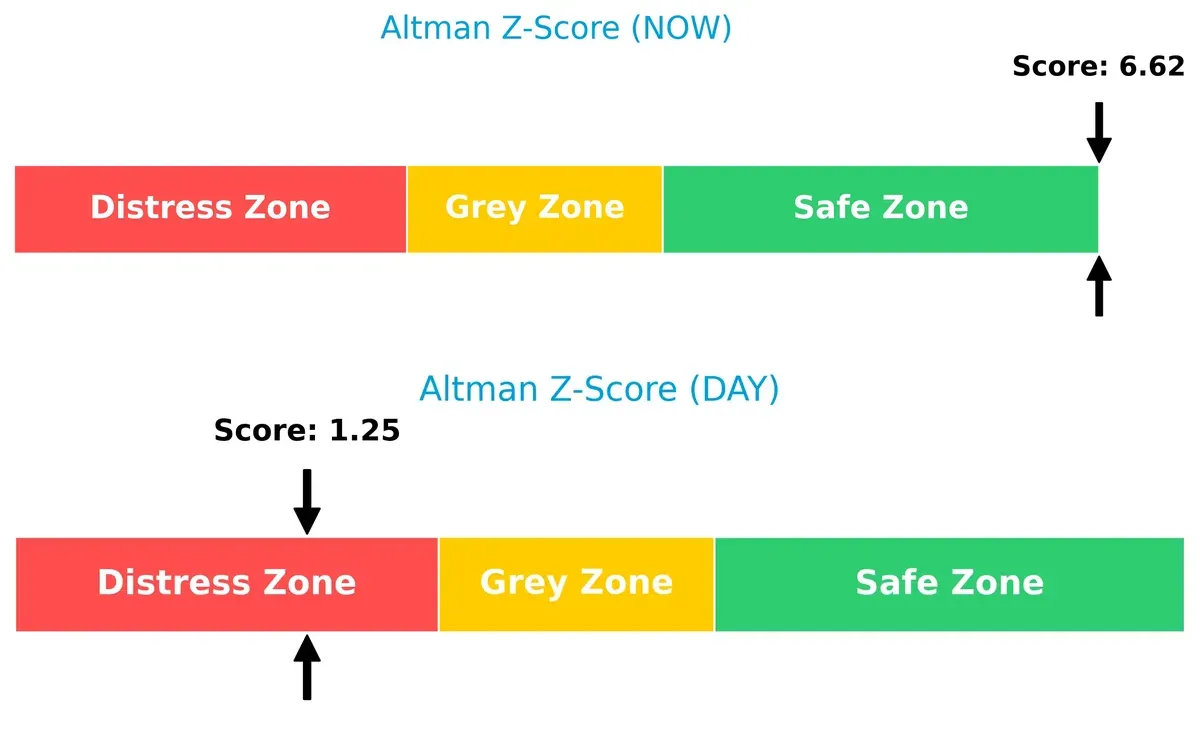
Bankruptcy Risk: Solvency Showdown
ServiceNow’s Altman Z-Score of 6.6 places it firmly in the safe zone, indicating robust financial stability. Dayforce’s 1.2 signals distress risk, raising concerns about its long-term survival in this cycle:
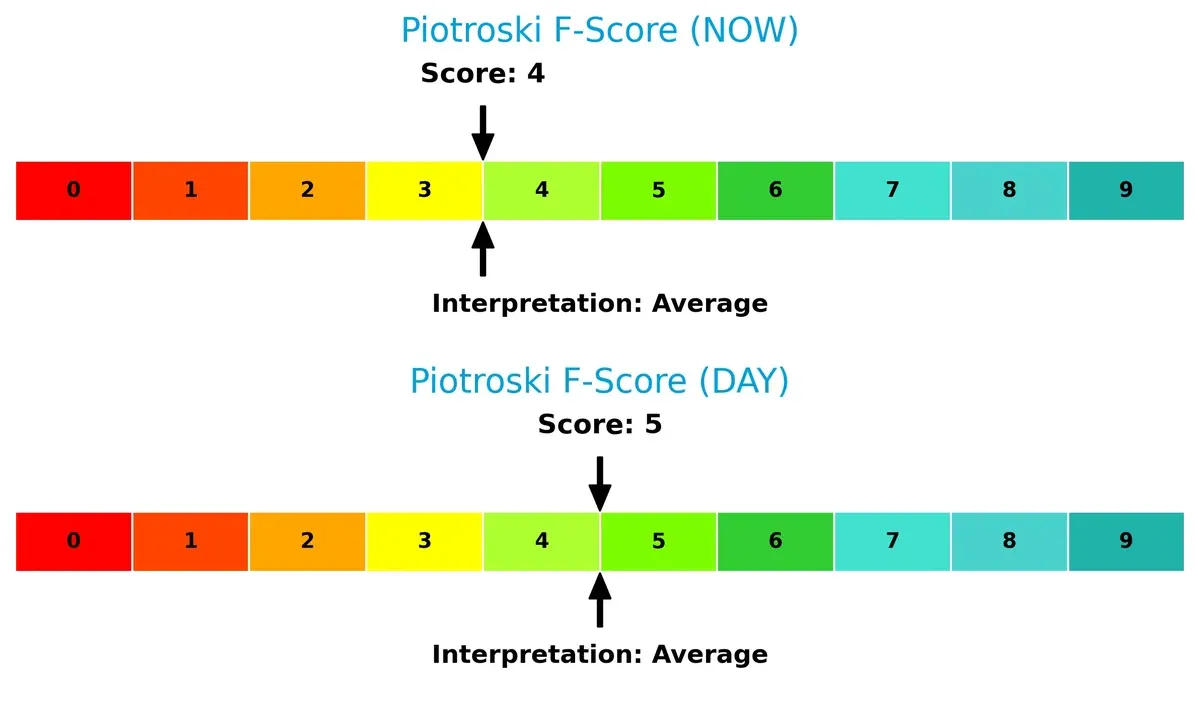
Financial Health: Quality of Operations
Both firms exhibit average Piotroski F-Scores—ServiceNow at 4 and Dayforce at 5—indicating neither is in peak financial health. Dayforce slightly edges out ServiceNow, but both show room for improvement:
How are the two companies positioned?
This section dissects the operational DNA of ServiceNow and Dayforce by comparing their revenue distribution and internal dynamics. The goal is to confront their economic moats to identify which model offers the most resilient and sustainable advantage today.
Revenue Segmentation: The Strategic Mix
This visual comparison dissects how ServiceNow, Inc. and Dayforce Inc diversify their income streams and where their primary sector bets lie:
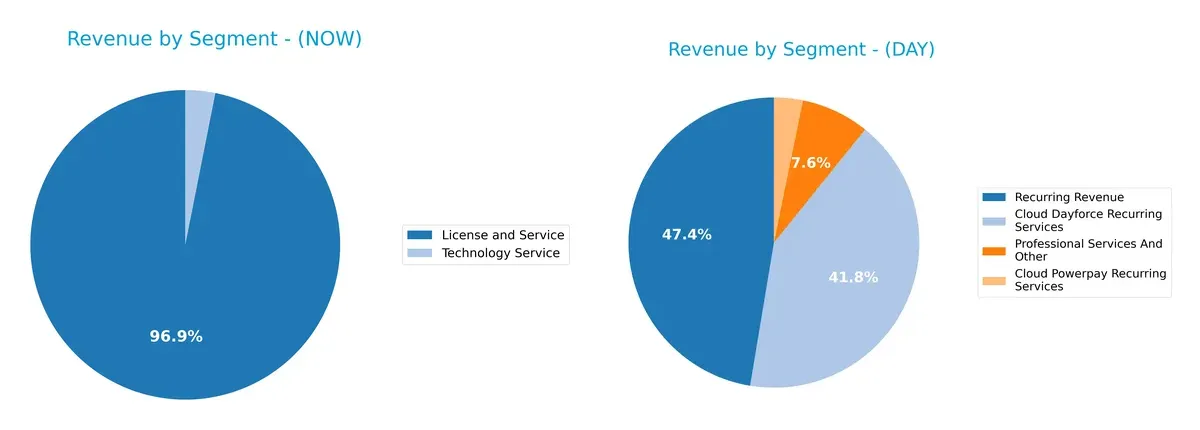
ServiceNow leans heavily on its License and Service segment, which dwarfs Technology Service revenue at $12.9B versus $414M, showing a dominant focus on digital workflow and ITOM products. Dayforce presents a more fragmented mix, with its Cloud Dayforce Recurring Services ($1.34B) anchoring revenue but supported by Cloud Powerpay and Professional Services. ServiceNow’s concentration signals ecosystem lock-in, while Dayforce’s spread reduces single-segment risk but may dilute scale advantages.
Strengths and Weaknesses Comparison
This table compares the Strengths and Weaknesses of ServiceNow, Inc. (NOW) and Dayforce Inc (DAY):
NOW Strengths
- Strong net margin at 13.16%
- Favorable debt-to-equity at 0.25
- High fixed asset turnover at 4.29
- Significant global presence across North America, EMEA, Asia Pacific
- Large and diversified revenue from License and Service segments
DAY Strengths
- Favorable quick ratio at 1.13
- Manageable debt-to-assets at 13.52%
- High fixed asset turnover at 7.46
- Solid North American revenue base with notable presence in Canada and U.S.
- Recurring revenue model from Cloud Dayforce and Powerpay services
NOW Weaknesses
- Unfavorable valuation multiples: PE at 90.88 and PB at 12.25
- Current ratio below 1 at 0.95, indicating liquidity risk
- Zero dividend yield
- ROE and ROIC only neutral, signaling average capital efficiency
DAY Weaknesses
- Poor profitability with net margin at 1.03% and ROE at 0.71%
- Unfavorable PE of 633.29 and PB at 4.5
- Low asset turnover at 0.19 and weak interest coverage at 1.93
- No dividend yield
- Limited geographic diversification beyond North America
ServiceNow demonstrates financial strength through profitability, capital structure, and global reach, though valuations and liquidity raise caution. Dayforce shows operational efficiency in assets but struggles with profitability and geographic concentration, which may affect resilience.
The Moat Duel: Analyzing Competitive Defensibility
A structural moat shields long-term profits from relentless competition erosion. Without it, sustainable advantage vanishes quickly:
ServiceNow, Inc.: Workflow Automation with Intangible Assets
ServiceNow leverages intangible assets like proprietary AI and automation workflows. Its 77.5% gross margin and stable EBIT margin showcase margin resilience. Expansion into new AI-driven services in 2026 could deepen this intangible moat.
Dayforce Inc: Human Capital Management via Cost Efficiency
Dayforce’s moat hinges on cost advantage in cloud-based HCM solutions. Compared to ServiceNow’s intangible edge, Dayforce operates with thinner margins (46.1%) and lower EBIT efficiency. Its growing ROIC trend signals improving profitability and potential market share gains.
Intangible Assets vs. Cost Advantage: The Defensibility Contest
ServiceNow’s intangible asset moat offers wider, more durable competitive insulation than Dayforce’s cost-based edge. I see ServiceNow better positioned to defend and grow its market share amid evolving enterprise software demands.
Which stock offers better returns?
Over the past 12 months, ServiceNow, Inc. and Dayforce Inc have shown contrasting price movements, with ServiceNow experiencing a notable decline while Dayforce posted moderate gains amid shifting trading dynamics.
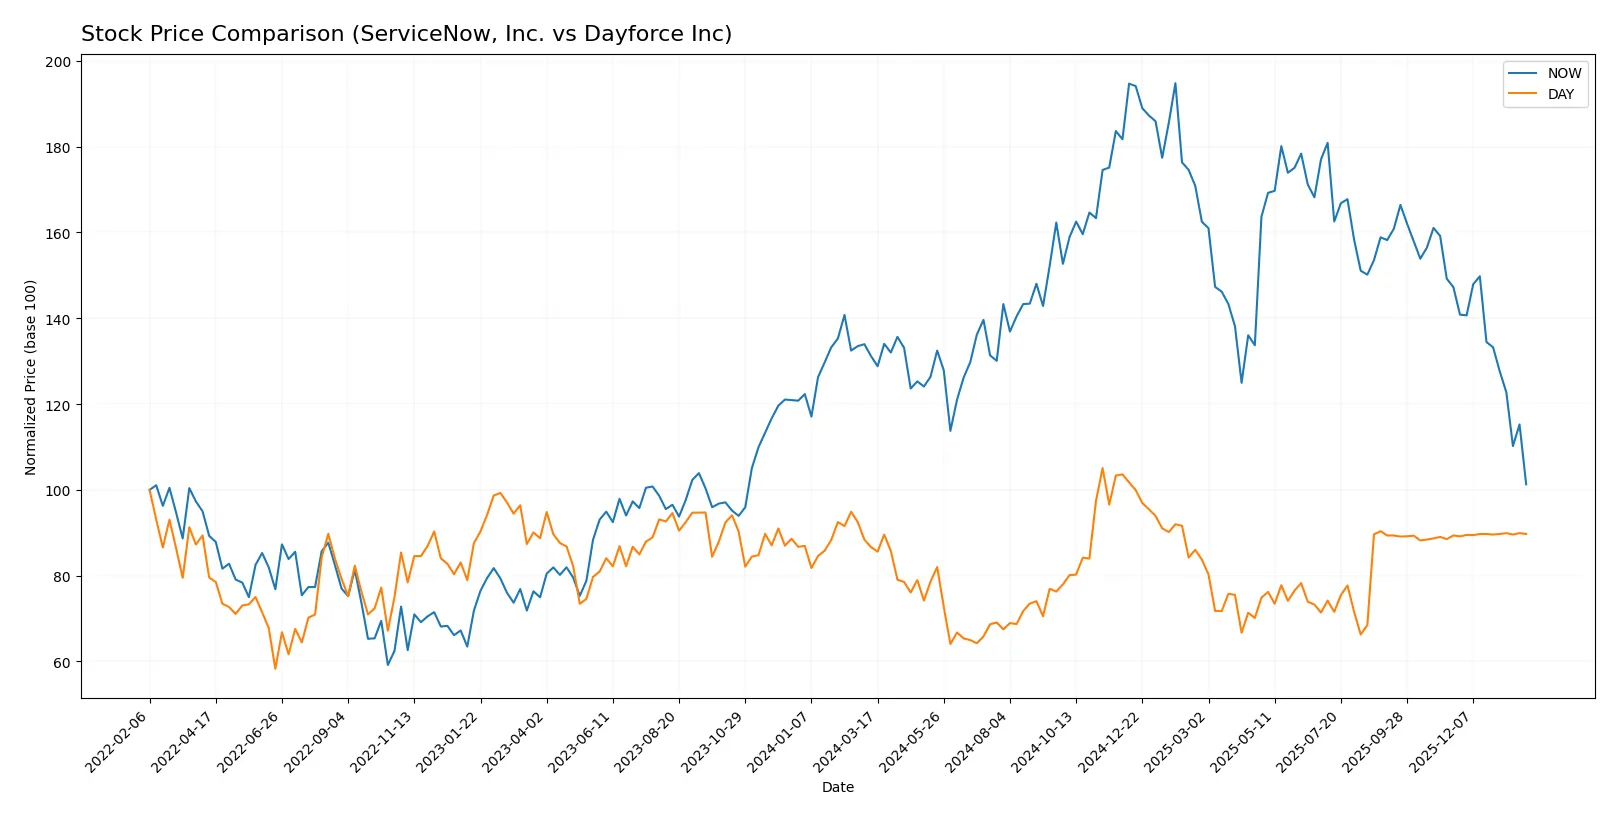
Trend Comparison
ServiceNow, Inc. shows a bearish trend over the past year with a -22.79% price change and decelerating decline. The stock ranged between 117.01 and 225.0, exhibiting high volatility (24.31 std deviation).
Dayforce Inc displays a bullish trend with a 3.51% price increase and decelerating momentum. The stock traded between 49.46 and 81.14, with significantly lower volatility (7.83 std deviation).
Comparing both, Dayforce delivered the highest market performance, as ServiceNow’s stock declined sharply while Dayforce maintained modest gains.
Target Prices
Analysts present a wide target price range for ServiceNow, Inc., while Dayforce Inc. shows a tight consensus.
| Company | Target Low | Target High | Consensus |
|---|---|---|---|
| ServiceNow, Inc. | 115 | 1315 | 440.14 |
| Dayforce Inc | 70 | 70 | 70 |
ServiceNow’s consensus target of 440.14 far exceeds its current price of 117, indicating strong bullish expectations. Dayforce’s target matches its current price closely, suggesting market stability or limited upside.

Don’t Let Luck Decide Your Entry Point
Optimize your entry points with our advanced ProRealTime indicators. You’ll get efficient buy signals with precise price targets for maximum performance. Start outperforming now!
How do institutions grade them?
ServiceNow, Inc. Grades
The following table summarizes recent grade updates from major institutions for ServiceNow, Inc.:
| Grading Company | Action | New Grade | Date |
|---|---|---|---|
| Citigroup | Maintain | Buy | 2026-01-30 |
| BTIG | Maintain | Buy | 2026-01-29 |
| Stifel | Maintain | Buy | 2026-01-29 |
| RBC Capital | Maintain | Outperform | 2026-01-29 |
| Macquarie | Maintain | Neutral | 2026-01-29 |
| DA Davidson | Maintain | Buy | 2026-01-29 |
| Needham | Maintain | Buy | 2026-01-29 |
| Keybanc | Maintain | Underweight | 2026-01-29 |
| Evercore ISI Group | Maintain | Outperform | 2026-01-29 |
| Cantor Fitzgerald | Maintain | Overweight | 2026-01-29 |
Dayforce Inc Grades
The following table summarizes recent grade updates from major institutions for Dayforce Inc:
| Grading Company | Action | New Grade | Date |
|---|---|---|---|
| Needham | Maintain | Hold | 2025-10-30 |
| Stifel | Downgrade | Hold | 2025-09-19 |
| Citigroup | Downgrade | Neutral | 2025-09-17 |
| Deutsche Bank | Maintain | Hold | 2025-08-22 |
| BMO Capital | Downgrade | Market Perform | 2025-08-22 |
| Keybanc | Downgrade | Sector Weight | 2025-08-22 |
| Needham | Downgrade | Hold | 2025-08-22 |
| Barclays | Maintain | Equal Weight | 2025-08-22 |
| Wells Fargo | Upgrade | Equal Weight | 2025-08-22 |
| Jefferies | Maintain | Hold | 2025-08-21 |
Which company has the best grades?
ServiceNow, Inc. consistently receives Buy and Outperform ratings from multiple respected firms, indicating stronger analyst confidence. Dayforce Inc faces multiple downgrades and Hold ratings, signaling more cautious sentiment. This disparity may influence investor perception and risk assessment.
Risks specific to each company
The following categories identify the critical pressure points and systemic threats facing both firms in the 2026 market environment:
1. Market & Competition
ServiceNow, Inc.
- Dominates enterprise cloud workflow automation with a strong direct sales force and strategic partnerships.
Dayforce Inc
- Faces intense competition in human capital management software with less market share and smaller scale.
2. Capital Structure & Debt
ServiceNow, Inc.
- Low debt-to-equity (0.25) and strong interest coverage indicate robust financial stability.
Dayforce Inc
- Higher debt-to-equity (0.48) and weaker interest coverage (1.93) increase refinancing risk.
3. Stock Volatility
ServiceNow, Inc.
- Beta near 1 (0.98) suggests market-level volatility; range indicates significant price swings.
Dayforce Inc
- Higher beta (1.18) implies greater stock volatility and sensitivity to market shifts.
4. Regulatory & Legal
ServiceNow, Inc.
- Operates globally in regulated industries; compliance complexity could increase costs.
Dayforce Inc
- Also global, with payroll and benefits services subject to evolving labor laws and regulations.
5. Supply Chain & Operations
ServiceNow, Inc.
- Relies on cloud infrastructure; risks include service disruptions but benefits from scale.
Dayforce Inc
- Dependent on cloud platforms and third-party channels, exposing it to operational risks.
6. ESG & Climate Transition
ServiceNow, Inc.
- Increasing pressure to demonstrate environmental responsibility and social governance.
Dayforce Inc
- Must address ESG standards while scaling, with potential lag behind larger peers.
7. Geopolitical Exposure
ServiceNow, Inc.
- Global footprint exposes it to geopolitical tensions affecting tech and cloud services.
Dayforce Inc
- International operations face similar risks, but smaller scale may limit impact.
Which company shows a better risk-adjusted profile?
ServiceNow’s strongest risk is market competition, given its high valuation multiples that pressure execution. Dayforce’s critical risk lies in capital structure, with weaker profitability and debt coverage raising financial distress concerns. ServiceNow presents a markedly better risk-adjusted profile, supported by a robust Altman Z-score (6.6, safe zone) versus Dayforce’s distress zone (1.25). The stark contrast in profitability margins and financial health underlines why ServiceNow commands premium valuation despite market competition risks.
Final Verdict: Which stock to choose?
ServiceNow, Inc. (NOW) impresses with its superpower as a cash-generating machine fueled by strong revenue growth and improving profitability. Its point of vigilance lies in a stretched valuation and a current ratio below 1, which could pressure liquidity during downturns. It fits best in aggressive growth portfolios seeking exposure to a leading SaaS innovator.
Dayforce Inc (DAY) leverages a strategic moat in workforce management software with steady recurring revenues that anchor its business. While it currently sheds value and carries higher financial risk, its improving ROIC trend and stronger liquidity profile offer relative safety compared to NOW. It suits investors favoring GARP – growth at a reasonable price.
If you prioritize high-growth potential and can tolerate valuation risks, ServiceNow outshines with accelerating profitability and scale. However, if you seek better stability with a focus on improving fundamentals and manageable risk, Dayforce offers a more conservative scenario despite its challenges. Each appeals to distinct investor profiles balancing growth and risk appetite.
Disclaimer: Investment carries a risk of loss of initial capital. The past performance is not a reliable indicator of future results. Be sure to understand risks before making an investment decision.
Go Further
I encourage you to read the complete analyses of ServiceNow, Inc. and Dayforce Inc to enhance your investment decisions: