Datadog, Inc. (DDOG) and The Trade Desk, Inc. (TTD) are two prominent players in the technology sector, both specializing in innovative software solutions with significant market overlap in cloud-based platforms. Datadog focuses on IT infrastructure monitoring, while The Trade Desk excels in data-driven digital advertising. This comparison highlights their growth strategies and market positions to help you identify which company offers the most compelling investment opportunity in 2026. Let’s dive in to find the best fit for your portfolio.
Table of contents
Companies Overview
I will begin the comparison between Datadog, Inc. and The Trade Desk, Inc. by providing an overview of these two companies and their main differences.
Datadog Overview
Datadog, Inc. provides a cloud-based monitoring and analytics platform designed for developers, IT operations teams, and business users globally. Its SaaS platform integrates infrastructure monitoring, application performance, log management, and security monitoring, delivering real-time observability of technology stacks. Founded in 2010 and headquartered in New York, Datadog serves a broad market with a focus on automation and collaboration tools.
The Trade Desk Overview
The Trade Desk, Inc. operates a self-service cloud platform that enables buyers to manage and optimize data-driven digital advertising campaigns across diverse formats and devices. The company serves advertising agencies and service providers internationally, focusing on delivering value-added data services. Founded in 2009 and based in Ventura, California, The Trade Desk is a key player in the digital advertising technology sector.
Key similarities and differences
Both companies operate in the technology sector providing cloud-based software solutions. Datadog focuses on IT infrastructure and application monitoring, while The Trade Desk specializes in digital advertising campaign management. Each serves a global clientele, but their business models differ: Datadog targets technology operations with real-time analytics, whereas The Trade Desk offers advertising optimization and data services, reflecting distinct market applications within software services.
Income Statement Comparison
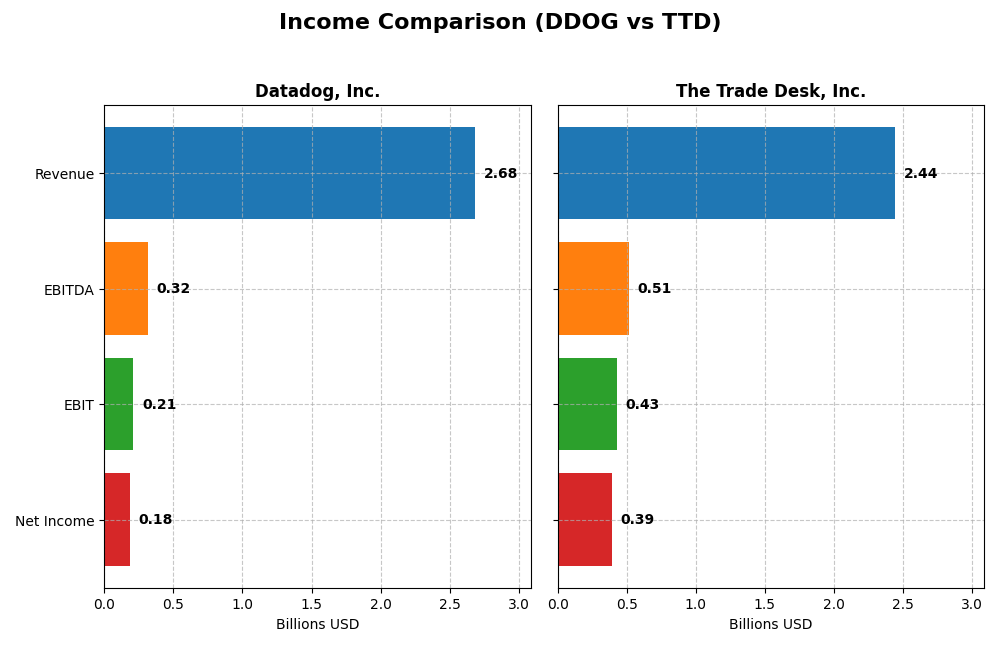
The table below presents a side-by-side comparison of key income statement metrics for Datadog, Inc. and The Trade Desk, Inc. for the fiscal year 2024.
| Metric | Datadog, Inc. (DDOG) | The Trade Desk, Inc. (TTD) |
|---|---|---|
| Market Cap | 41.7B | 17.3B |
| Revenue | 2.68B | 2.44B |
| EBITDA | 318M | 515M |
| EBIT | 211M | 427M |
| Net Income | 184M | 393M |
| EPS | 0.55 | 0.80 |
| Fiscal Year | 2024 | 2024 |
Income Statement Interpretations
Datadog, Inc.
Datadog’s revenue surged from 603M in 2020 to 2.68B in 2024, with net income turning positive and rising to 184M in 2024. Gross margin remained strong near 81%, while net margin improved significantly to 6.85%. The latest year showed solid revenue growth of 26.1%, with EBIT and net margins also expanding, reflecting robust operational leverage.
The Trade Desk, Inc.
The Trade Desk’s revenue grew steadily from 836M in 2020 to 2.44B in 2024, with net income increasing to 393M. Gross margin held firm at about 80.7%, and EBIT margin improved to 17.5%. In 2024, revenue rose by 25.6%, accompanied by strong EBIT growth and a net margin of 16.1%, indicating efficient cost management and profitability gains.
Which one has the stronger fundamentals?
Both companies show favorable income statement trends with strong revenue growth and improving profitability. Datadog exhibits higher overall net income growth and margin improvement, while The Trade Desk maintains superior EBIT and net margins. Datadog’s rapid margin expansion contrasts with The Trade Desk’s steadier profitability, suggesting different strengths in earnings quality and growth dynamics.
Financial Ratios Comparison
This table presents a side-by-side comparison of the most recent key financial ratios for Datadog, Inc. and The Trade Desk, Inc. based on their fiscal year 2024 data.
| Ratios | Datadog, Inc. (DDOG) | The Trade Desk, Inc. (TTD) |
|---|---|---|
| ROE | 6.77% | 13.33% |
| ROIC | 1.07% | 10.02% |
| P/E | 261.4 | 146.8 |
| P/B | 17.70 | 19.56 |
| Current Ratio | 2.64 | 1.86 |
| Quick Ratio | 2.64 | 1.86 |
| D/E (Debt to Equity) | 0.68 | 0.11 |
| Debt-to-Assets | 31.8% | 5.11% |
| Interest Coverage | 7.68 | 0 |
| Asset Turnover | 0.46 | 0.40 |
| Fixed Asset Turnover | 6.72 | 5.17 |
| Payout Ratio | 0 | 0 |
| Dividend Yield | 0 | 0 |
Interpretation of the Ratios
Datadog, Inc.
Datadog’s ratios show a mixed profile with strengths in liquidity, evidenced by a solid current ratio of 2.64, and strong interest coverage at 29.85. However, the company faces challenges with unfavorable returns on equity (6.77%) and invested capital (1.07%), alongside high valuation multiples (PE at 261.42 and PB at 17.7). Datadog does not pay dividends, reflecting its reinvestment focus amid growth and prioritization of R&D.
The Trade Desk, Inc.
The Trade Desk displays generally favorable ratios, with a robust net margin of 16.08% and a strong return on invested capital of 10.02%. Liquidity metrics are good, with a current ratio of 1.86, and its debt levels are low, as shown by a debt-to-assets ratio of 5.11%. Like Datadog, The Trade Desk does not issue dividends, likely due to ongoing investment in growth and innovation.
Which one has the best ratios?
The Trade Desk exhibits a more favorable overall ratio profile, with a higher proportion of favorable indicators (57.14%) compared to Datadog’s 28.57%. While both companies face high valuation multiples and lack dividend payouts, The Trade Desk’s stronger profitability metrics and lower leverage suggest a more balanced financial position than Datadog’s slightly unfavorable ratio evaluation.
Strategic Positioning
This section compares the strategic positioning of Datadog, Inc. and The Trade Desk, Inc. focusing on Market position, Key segments, and exposure to disruption:
Datadog, Inc.
- Positioned in software application monitoring with significant NASDAQ presence and higher market cap at $41.7B.
- Focuses on cloud-based monitoring and analytics for IT operations and developers globally.
- Faces technological disruption through integration and automation of infrastructure and security monitoring.
The Trade Desk, Inc.
- Operates in digital advertising software with a smaller market cap of $17.3B and high trading volume.
- Provides a self-service cloud platform for data-driven advertising campaigns across multiple media formats.
- Exposed to disruption in digital ad formats and channels across devices, requiring constant platform innovation.
Datadog, Inc. vs The Trade Desk, Inc. Positioning
Datadog has a diversified platform targeting IT and cloud monitoring, benefiting from broader application scope and larger scale. The Trade Desk concentrates on digital advertising technology, emphasizing multi-channel campaign management but with narrower business focus and smaller scale.
Which has the best competitive advantage?
Both companies show a slightly unfavorable moat status. Datadog is shedding value but with growing profitability, while The Trade Desk is also shedding value with declining profitability, indicating Datadog has a marginally stronger competitive advantage based on recent MOAT evaluation.
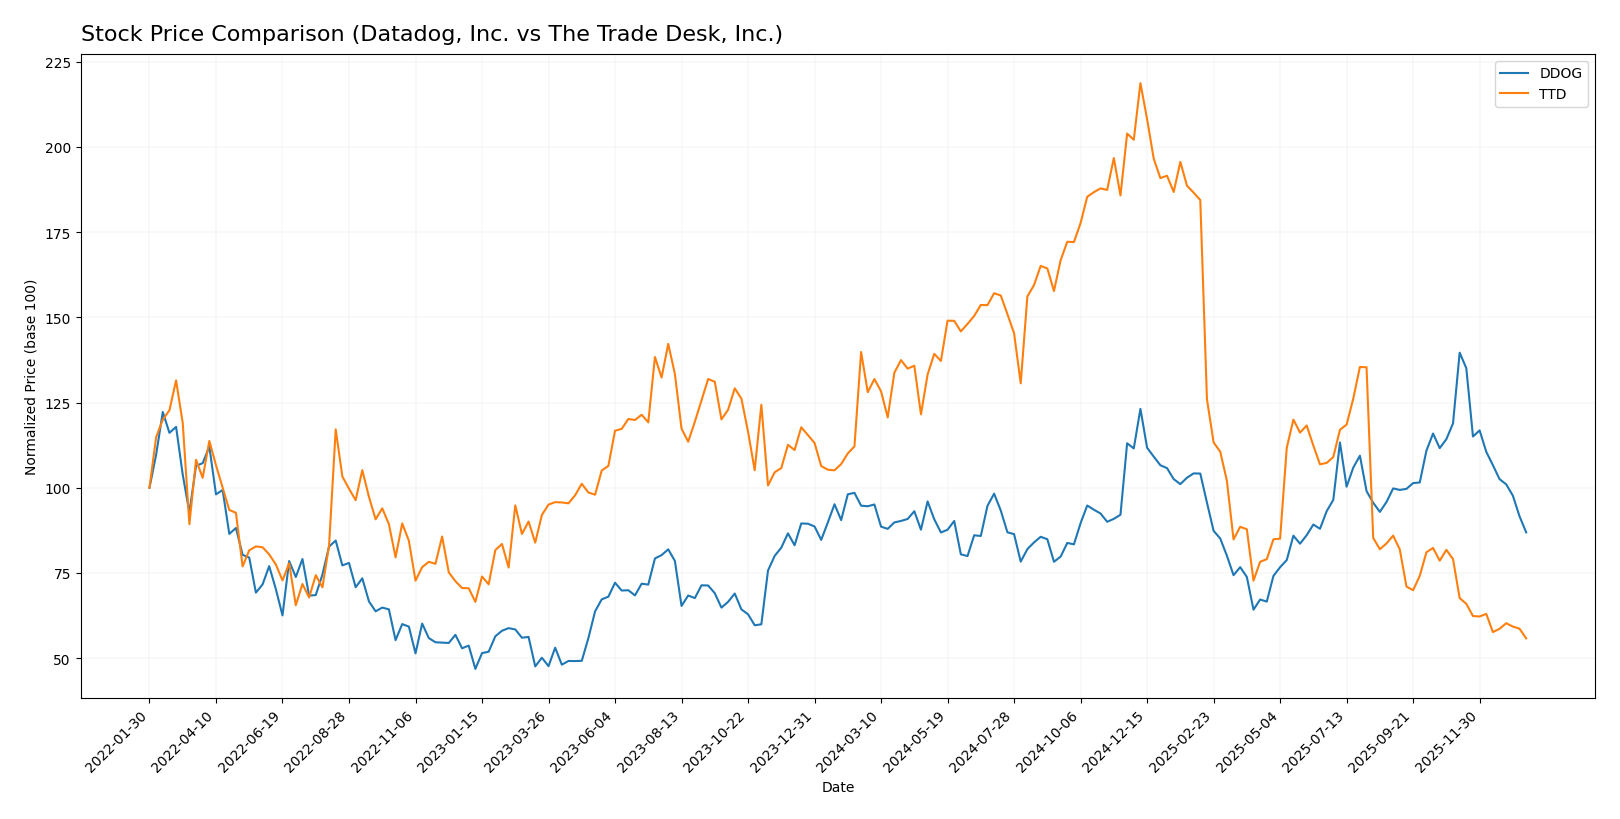
Stock Comparison
The stock price movements of Datadog, Inc. (DDOG) and The Trade Desk, Inc. (TTD) reflect significant downward trends over the past 12 months, marked by notable declines and deceleration in both cases.
Trend Analysis
Datadog, Inc. (DDOG) experienced a bearish trend over the past year with an 8.1% price decline, showing deceleration. The stock fluctuated within a range of 87.93 to 191.24 and exhibited high volatility with a 18.63 standard deviation.
The Trade Desk, Inc. (TTD) displayed a stronger bearish trend with a 56.43% decrease in price over the same period. Its decelerating trend included a wider price range from 35.48 to 139.11 and higher volatility at 28.36 standard deviation.
Comparing both companies, The Trade Desk, Inc. underperformed Datadog, Inc., delivering the lowest market performance with a sharper decline in stock price over the past year.
Target Prices
Analysts present a mixed but generally optimistic consensus for Datadog, Inc. and The Trade Desk, Inc.
| Company | Target High | Target Low | Consensus |
|---|---|---|---|
| Datadog, Inc. | 215 | 105 | 177.67 |
| The Trade Desk, Inc. | 98 | 39 | 56.73 |
Datadog’s target consensus at 177.67 significantly exceeds its current price of 119.02, indicating potential upside. The Trade Desk’s consensus of 56.73 is also well above the current 35.48, suggesting room for growth according to analysts.
Analyst Opinions Comparison
This section compares analysts’ ratings and grades for Datadog, Inc. and The Trade Desk, Inc.:
Rating Comparison
Datadog, Inc. Rating
- Rating: C+ with a status of Very Favorable.
- Discounted Cash Flow Score: 4, Favorable.
- Return on Equity Score: 2, Moderate.
- Return on Assets Score: 3, Moderate.
- Debt To Equity Score: 2, Moderate.
- Overall Score: 2, Moderate.
The Trade Desk, Inc. Rating
- Rating: B with a status of Very Favorable.
- Discounted Cash Flow Score: 4, Favorable.
- Return on Equity Score: 4, Favorable.
- Return on Assets Score: 4, Favorable.
- Debt To Equity Score: 3, Moderate.
- Overall Score: 3, Moderate.
Which one is the best rated?
Based strictly on the provided data, The Trade Desk, Inc. holds a higher rating (B) and better scores in ROE, ROA, debt-to-equity, and overall score than Datadog, Inc., indicating a stronger analyst assessment overall.
Scores Comparison
Here is a comparison of the financial scores for Datadog, Inc. and The Trade Desk, Inc.:
DDOG Scores
- Altman Z-Score: 11.37, indicating a strong safe zone status
- Piotroski Score: 6, reflecting average financial strength
TTD Scores
- Altman Z-Score: 4.30, also in the safe zone but lower
- Piotroski Score: 5, showing average financial strength
Which company has the best scores?
Datadog has a higher Altman Z-Score, indicating stronger financial stability against bankruptcy risk. Both companies show average Piotroski Scores, with Datadog slightly ahead.
Grades Comparison
Here is a detailed comparison of the recent grades assigned to Datadog, Inc. and The Trade Desk, Inc.:
Datadog, Inc. Grades
The following table summarizes recent grades from reputable grading companies for Datadog, Inc.:
| Grading Company | Action | New Grade | Date |
|---|---|---|---|
| Barclays | Maintain | Overweight | 2026-01-12 |
| Keybanc | Maintain | Overweight | 2026-01-12 |
| Morgan Stanley | Upgrade | Overweight | 2026-01-12 |
| Truist Securities | Maintain | Hold | 2026-01-07 |
| RBC Capital | Maintain | Outperform | 2026-01-05 |
| Jefferies | Maintain | Buy | 2026-01-05 |
| Piper Sandler | Maintain | Overweight | 2026-01-05 |
| Citigroup | Maintain | Buy | 2025-11-12 |
| Truist Securities | Maintain | Hold | 2025-11-07 |
| DA Davidson | Maintain | Buy | 2025-11-07 |
Overall, Datadog’s grades predominantly indicate an overweight or buy stance, with occasional hold ratings, reflecting generally positive analyst sentiment.
The Trade Desk, Inc. Grades
The following table summarizes recent grades from reputable grading companies for The Trade Desk, Inc.:
| Grading Company | Action | New Grade | Date |
|---|---|---|---|
| Morgan Stanley | Maintain | Equal Weight | 2026-01-13 |
| Wells Fargo | Maintain | Equal Weight | 2026-01-12 |
| Cantor Fitzgerald | Maintain | Neutral | 2026-01-08 |
| Wolfe Research | Maintain | Outperform | 2026-01-06 |
| Guggenheim | Maintain | Buy | 2026-01-05 |
| Jefferies | Maintain | Hold | 2025-12-11 |
| Wedbush | Maintain | Neutral | 2025-12-08 |
| DA Davidson | Maintain | Buy | 2025-11-10 |
| Truist Securities | Maintain | Buy | 2025-11-07 |
| Wells Fargo | Maintain | Equal Weight | 2025-11-07 |
The Trade Desk’s grades show a mixed pattern, with a significant number of equal weight and neutral ratings alongside some buy and outperform grades, suggesting a more cautious analyst outlook.
Which company has the best grades?
Datadog, Inc. has received stronger and more consistent buy and overweight grades compared to The Trade Desk, Inc., which has more neutral and equal weight ratings. This difference may influence investors toward perceiving Datadog as having stronger growth potential or analyst confidence.
Strengths and Weaknesses
Below is a comparative overview of key strengths and weaknesses for Datadog, Inc. (DDOG) and The Trade Desk, Inc. (TTD) based on their latest financial and operational metrics.
| Criterion | Datadog, Inc. (DDOG) | The Trade Desk, Inc. (TTD) |
|---|---|---|
| Diversification | Moderate product focus, limited segments | Focused on advertising technology |
| Profitability | Net margin 6.85% (neutral); ROIC 1.07% (unfavorable) | Net margin 16.08% (favorable); ROIC 10.02% (favorable) |
| Innovation | Growing ROIC trend indicates improving profitability | Declining ROIC trend signals challenges |
| Global presence | Strong with solid liquidity ratios | Strong with low debt and high interest coverage |
| Market Share | High valuation multiples reflect growth expectations | High valuation but better value creation than DDOG |
Key takeaways: While Datadog shows improving profitability trends, it still sheds value and has less favorable return metrics compared to The Trade Desk, which maintains stronger profitability and financial health despite a slight decline in ROIC. Investors should weigh DDOG’s growth potential against TTD’s current value creation and financial stability.
Risk Analysis
Below is a comparative risk overview of Datadog, Inc. (DDOG) and The Trade Desk, Inc. (TTD) based on the most recent data from 2024.
| Metric | Datadog, Inc. (DDOG) | The Trade Desk, Inc. (TTD) |
|---|---|---|
| Market Risk | Beta 1.26, high valuation risks (PE 261.4) | Beta 1.11, high valuation risks (PE 146.8) |
| Debt Level | Moderate debt-to-equity 0.68, neutral risk | Low debt-to-equity 0.11, favorable risk |
| Regulatory Risk | Moderate, tech sector scrutiny | Moderate, ad-tech privacy regulations |
| Operational Risk | Moderate, SaaS platform reliance | Moderate, platform dependence on ad demand |
| Environmental Risk | Low, software company with minor footprint | Low, primarily digital operations |
| Geopolitical Risk | Moderate, international exposure | Moderate, global advertising market exposure |
Datadog’s most significant risks stem from its high stock valuation and moderate debt, while The Trade Desk benefits from lower financial leverage but faces similar valuation pressures. Both companies operate in dynamic regulatory environments, particularly regarding data privacy.
Which Stock to Choose?
Datadog, Inc. (DDOG) shows strong income growth with a 344.81% revenue increase over five years and a favorable global income statement rating. Its financial ratios are slightly unfavorable overall, with moderate profitability and manageable debt. The company’s rating is very favorable (C+), supported by a safe Altman Z-Score but moderate Piotroski score. Its MOAT evaluation signals value destruction despite rising profitability.
The Trade Desk, Inc. (TTD) also exhibits favorable income metrics, with 192.43% revenue growth over five years and a favorable global income statement rating, though net margin growth is negative long term. TTD’s financial ratios are favorable overall, featuring higher profitability and lower debt levels. It holds a very favorable rating (B) with a safe Altman Z-Score and average Piotroski score. However, its MOAT status shows value destruction with declining profitability.
Investors seeking stronger financial ratios and higher profitability might find The Trade Desk appealing, while those valuing rapid income growth and improving profitability could lean toward Datadog. The differing MOAT trends suggest that risk-tolerant investors may weigh growth potential more, whereas risk-averse profiles might consider financial stability indicators more closely.
Disclaimer: Investment carries a risk of loss of initial capital. The past performance is not a reliable indicator of future results. Be sure to understand risks before making an investment decision.
Go Further
I encourage you to read the complete analyses of Datadog, Inc. and The Trade Desk, Inc. to enhance your investment decisions: