Home > Comparison > Technology > NOW vs DDOG
The strategic rivalry between ServiceNow, Inc. and Datadog, Inc. shapes the dynamics of the enterprise software sector. ServiceNow operates as an established, capital-intensive platform provider specializing in workflow automation and IT service management. In contrast, Datadog delivers a high-growth, SaaS-based monitoring and analytics platform focused on real-time cloud observability. This analysis aims to identify which business model offers superior risk-adjusted returns for a diversified portfolio navigating today’s technology landscape.
Table of contents
Companies Overview
ServiceNow and Datadog both command significant influence in the enterprise software landscape, shaping digital workflows and observability respectively.
ServiceNow, Inc.: Workflow Automation Pioneer
ServiceNow dominates enterprise cloud computing by offering the Now platform, which automates IT service management, security operations, and customer service. Its revenue stems primarily from subscription-based solutions that unify workflows across departments. In 2026, ServiceNow focuses on expanding automation capabilities and deepening strategic partnerships, such as with process mining leader Celonis, to enhance client process optimization.
Datadog, Inc.: Cloud Monitoring Innovator
Datadog leads with a SaaS-based monitoring and analytics platform that delivers real-time observability across infrastructure, applications, and security layers. Its core revenue model is subscription-driven, targeting developers and IT operations globally. The company’s 2026 strategy emphasizes broadening its security monitoring suite and integrating developer-focused observability to capture growing demand for comprehensive cloud visibility.
Strategic Collision: Similarities & Divergences
Both companies operate in the Software – Application sector but pursue distinct philosophies. ServiceNow invests in a closed ecosystem focused on workflow automation, while Datadog champions open, integrated observability solutions. Their battleground lies in enterprise IT optimization—ServiceNow automates processes, whereas Datadog monitors performance. This divergence creates contrasting investment profiles: ServiceNow offers scale and diversification, Datadog emphasizes innovation and rapid cloud adoption.
Income Statement Comparison
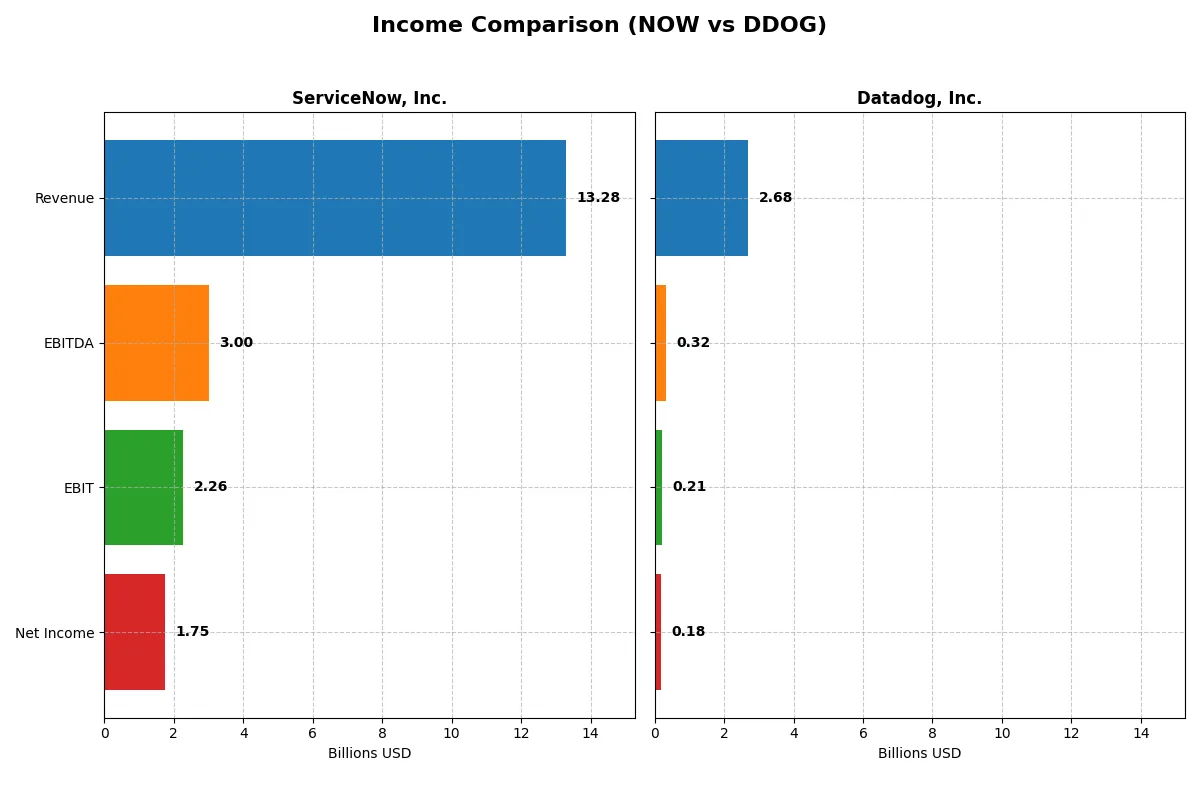
This data dissects the core profitability and scalability of both corporate engines to reveal who dominates the bottom line:
| Metric | ServiceNow, Inc. (NOW) | Datadog, Inc. (DDOG) |
|---|---|---|
| Revenue | 13.3B | 2.7B |
| Cost of Revenue | 3.0B | 516M |
| Operating Expenses | 8.5B | 2.1B |
| Gross Profit | 10.3B | 2.2B |
| EBITDA | 3.0B | 318M |
| EBIT | 2.3B | 211M |
| Interest Expense | 0 | 7M |
| Net Income | 1.7B | 184M |
| EPS | 1.69 | 0.55 |
| Fiscal Year | 2025 | 2024 |
Income Statement Analysis: The Bottom-Line Duel
This income statement comparison reveals the true efficiency and growth momentum driving each company’s financial engine.
ServiceNow, Inc. Analysis
ServiceNow’s revenue surged from 5.9B in 2021 to 13.3B in 2025, with net income climbing from 230M to 1.75B. The company sustains a strong gross margin of 77.5%, reflecting efficient cost control. Its net margin of 13.2% in 2025 signals solid profitability, underpinned by a 21.9% EPS growth last year. The accelerating EBIT margin at 17% highlights operational leverage and momentum.
Datadog, Inc. Analysis
Datadog’s revenue jumped from 603M in 2020 to 2.7B in 2024, with net income turning positive at 184M after years of losses. The firm boasts a higher gross margin of 80.8%, suggesting strong product pricing power. However, its EBIT margin remains modest at 7.9%, indicating ongoing investment. Notably, net margin nearly tripled last year, reflecting improved cost efficiency and rapid scale.
Margin Strength vs. Growth Velocity
ServiceNow dominates with superior net and EBIT margins, translating to more efficient profitability at scale. Datadog impresses with faster revenue and net income growth, recovering from early losses to post positive earnings. Investors seeking robust margin power may lean toward ServiceNow, while those favoring rapid expansion might prefer Datadog’s high-growth profile.
Financial Ratios Comparison
These vital ratios act as a diagnostic tool to expose the underlying fiscal health, valuation premiums, and capital efficiency of the companies compared below:
| Ratios | ServiceNow, Inc. (NOW) | Datadog, Inc. (DDOG) |
|---|---|---|
| ROE | 13.5% | 6.8% |
| ROIC | 9.0% | 1.1% |
| P/E | 90.9x | 261.4x |
| P/B | 12.3x | 17.7x |
| Current Ratio | 0.95 | 2.64 |
| Quick Ratio | 0.95 | 2.64 |
| D/E (Debt-to-Equity) | 0.25 | 0.68 |
| Debt-to-Assets | 12.3% | 31.8% |
| Interest Coverage | 0 | 7.7 |
| Asset Turnover | 0.51 | 0.46 |
| Fixed Asset Turnover | 4.29 | 6.72 |
| Payout Ratio | 0% | 0% |
| Dividend Yield | 0% | 0% |
| Fiscal Year | 2025 | 2024 |
Efficiency & Valuation Duel: The Vital Signs
Financial ratios act as a company’s DNA, uncovering hidden operational strengths and risks that influence investment decisions.
ServiceNow, Inc.
ServiceNow shows solid profitability with a 13.48% ROE and a 13.16% net margin, signaling operational efficiency. Its valuation appears stretched, with a high P/E of 90.88 and P/B of 12.25. The company retains earnings for growth, lacking dividends but investing heavily in R&D, supporting long-term shareholder value.
Datadog, Inc.
Datadog posts moderate profitability, with a 6.77% ROE and 6.85% net margin, reflecting cautious efficiency. However, its valuation is significantly stretched, evidenced by a P/E of 261.42 and P/B of 17.7. It generates no dividends, focusing instead on aggressive reinvestment in R&D to fuel growth, despite weaker returns on invested capital.
Premium Valuation vs. Operational Safety
ServiceNow offers a better balance of profitability and valuation risk than Datadog, with stronger returns and more favorable leverage metrics. Investors seeking operational safety and moderate risk may prefer ServiceNow’s profile, while those targeting high growth at elevated valuation face greater uncertainty with Datadog.
Which one offers the Superior Shareholder Reward?
I observe that both ServiceNow (NOW) and Datadog (DDOG) refrain from dividends, focusing on reinvestment and buybacks for shareholder returns. NOW boasts a robust free cash flow per share of 4.4, nearly double DDOG’s 2.5, supporting a stronger buyback program. NOW’s payout ratio is zero but free cash flow coverage is solid, indicating capacity for sustainable buybacks. DDOG shows a higher current ratio (2.6 vs. 0.95), signaling stronger liquidity but also carries more debt relative to assets (32% vs. 12%). NOW’s capital expenditure coverage ratio is lower but steady. I view NOW’s disciplined capital allocation and consistent buybacks as a more sustainable model. For 2026, I favor ServiceNow’s superior total shareholder return potential over Datadog.
Comparative Score Analysis: The Strategic Profile
The radar chart reveals the fundamental DNA and trade-offs of ServiceNow, Inc. and Datadog, Inc., showcasing their financial strengths and valuation challenges:
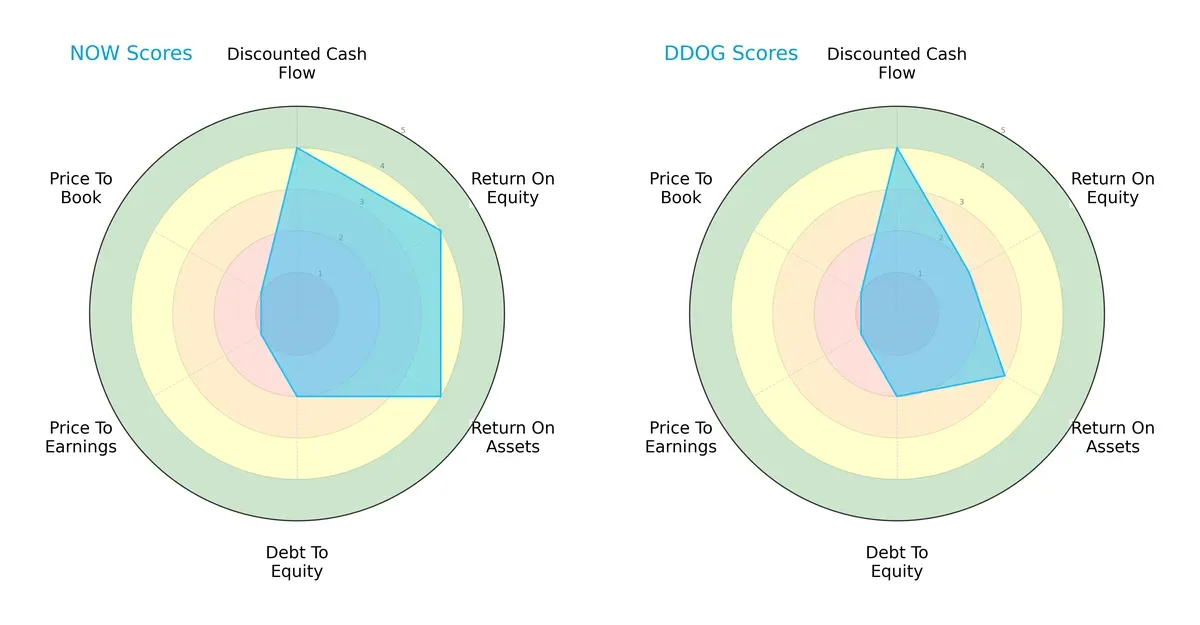
ServiceNow leads with higher scores in ROE (4 vs. 2) and ROA (4 vs. 3), indicating superior profitability and asset efficiency. Both firms share strong DCF scores (4), signaling robust cash flow expectations. Debt-to-equity scores are equal (2), reflecting similar leverage profiles. However, both suffer from very unfavorable valuation scores (PE and PB at 1), suggesting market skepticism or overvaluation. ServiceNow presents a more balanced profile, while Datadog relies more on cash flow strength despite weaker profitability metrics.
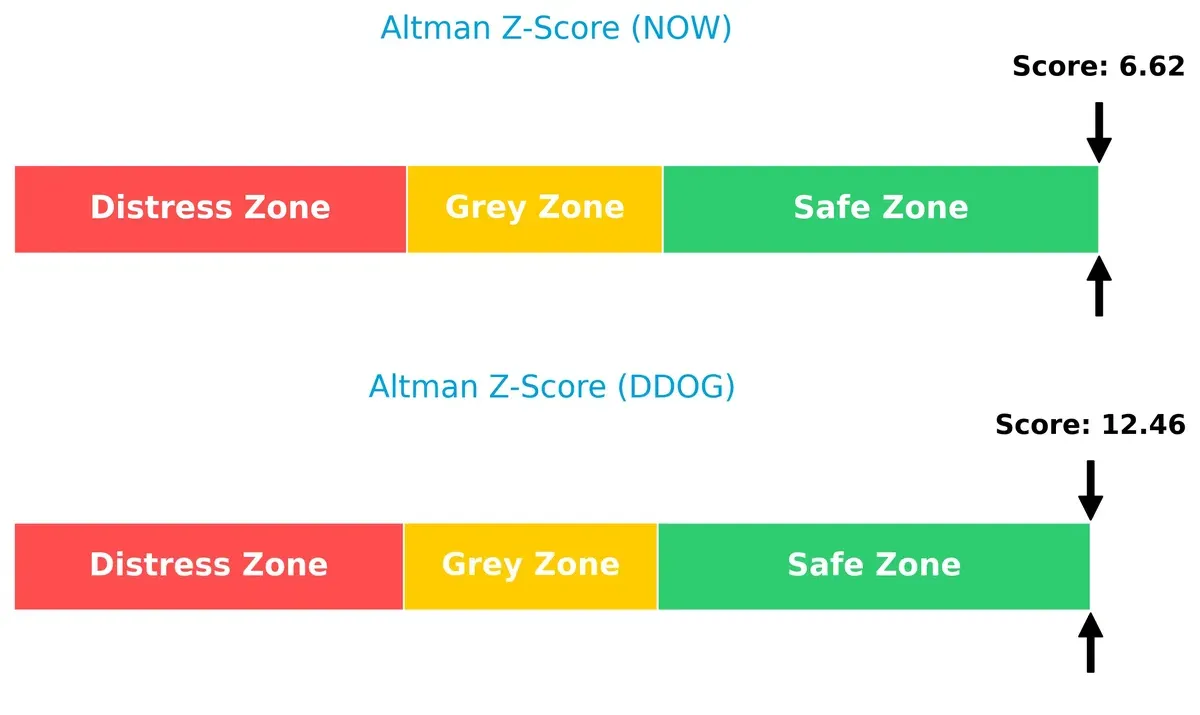
Bankruptcy Risk: Solvency Showdown
ServiceNow’s Altman Z-Score of 6.6 versus Datadog’s 12.5 underscores both firms’ strong solvency but highlights Datadog’s exceptionally safer position for long-term survival in this cycle:
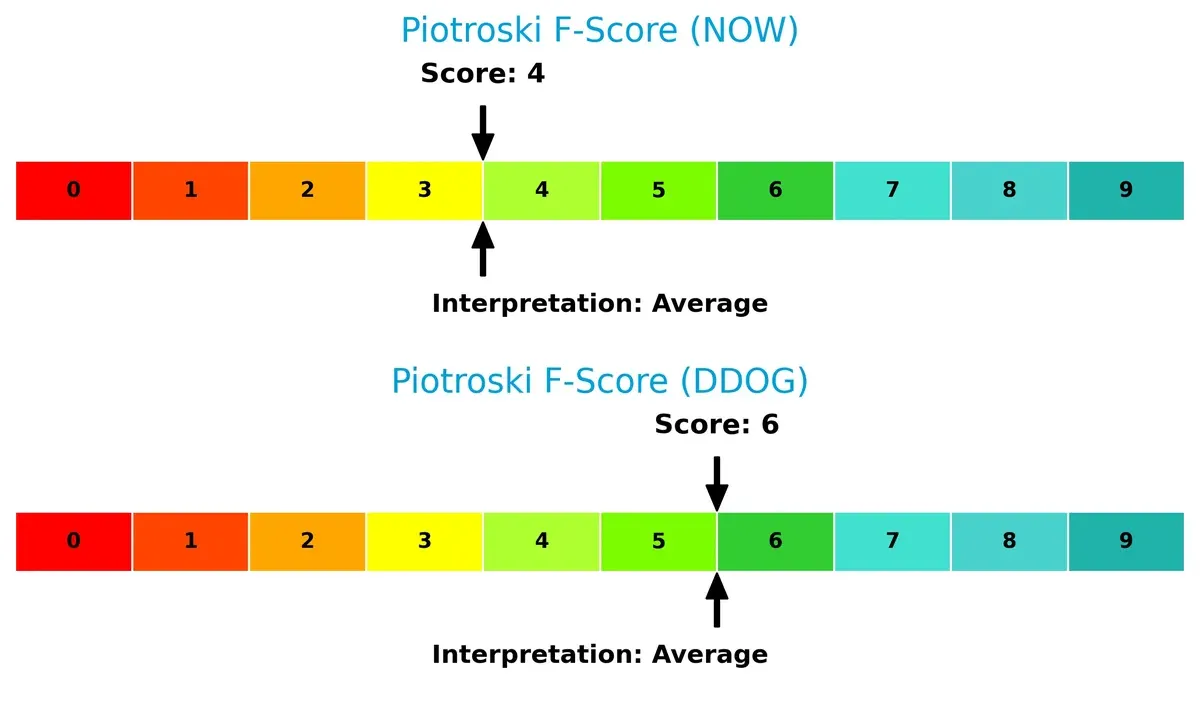
Financial Health: Quality of Operations
Datadog’s Piotroski F-Score of 6 outperforms ServiceNow’s 4, indicating healthier internal financial metrics and operational quality. ServiceNow’s average score signals some red flags in profitability or efficiency compared to Datadog’s stronger position:
How are the two companies positioned?
This section dissects the operational DNA of ServiceNow and Datadog by comparing their revenue distribution by segment and internal dynamics. The final goal is to confront their economic moats to identify which model offers the most resilient, sustainable advantage today.
Revenue Segmentation: The Strategic Mix
The following visual comparison dissects how ServiceNow, Inc. and Datadog, Inc. diversify their income streams and where their primary sector bets lie:
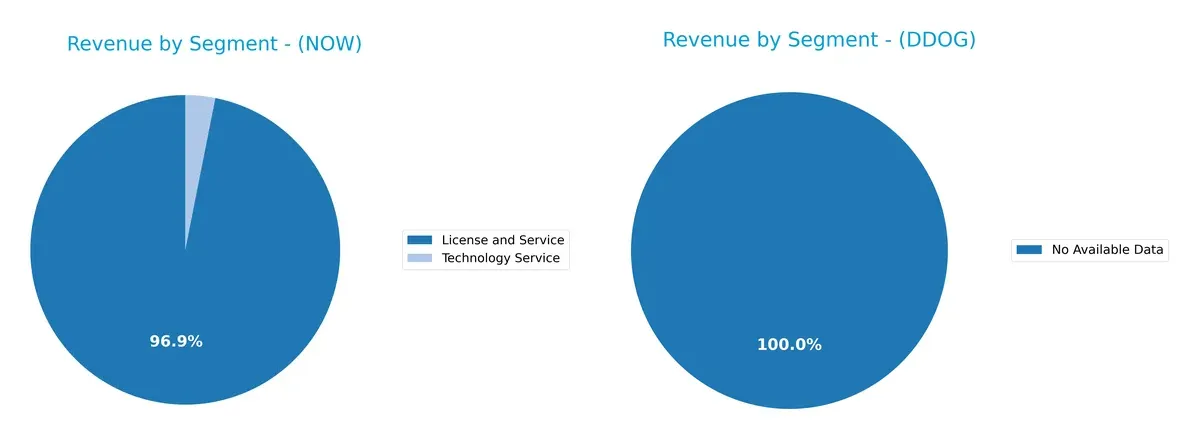
ServiceNow anchors its revenue heavily in License and Service, with $12.9B in 2025, dwarfing its Technology Service segment at $414M. This concentration signals a strong ecosystem lock-in around digital workflow products. Datadog lacks available segment data, so I cannot assess its diversification. ServiceNow’s reliance on a dominant segment suggests infrastructure dominance but also concentration risk if market dynamics shift.
Strengths and Weaknesses Comparison
This table compares the Strengths and Weaknesses of ServiceNow and Datadog:
ServiceNow Strengths
- High net margin at 13.16%
- Favorable debt ratios with 12.3% debt-to-assets
- Strong fixed asset turnover at 4.29
- Broad global presence across North America, EMEA, Asia Pacific
- Significant market share in License and Service segments
Datadog Strengths
- Strong current and quick ratios at 2.64
- High interest coverage at 29.85
- Favorable fixed asset turnover at 6.72
- Increasing international and North American revenue presence
ServiceNow Weaknesses
- Low current ratio at 0.95 signals liquidity risk
- High PE and PB ratios indicating expensive valuation
- No dividend yield
- Neutral ROIC close to WACC suggests limited value creation
Datadog Weaknesses
- Lower net margin at 6.85%
- Unfavorable ROE and ROIC metrics
- Elevated PE and PB ratios indicate valuation risk
- Asset turnover below ServiceNow at 0.46
- No dividend yield
ServiceNow demonstrates stronger profitability and conservative leverage but faces liquidity concerns and valuation risks. Datadog shows robust liquidity and interest coverage but weaker profitability and valuation challenges. These factors shape their strategic flexibility and capital allocation priorities.
The Moat Duel: Analyzing Competitive Defensibility
A structural moat is the only reliable shield protecting long-term profits from relentless competition erosion. Let’s dissect the moat dynamics of two cloud software leaders:
ServiceNow, Inc.: Workflow Automation Switching Costs
ServiceNow’s moat stems from high switching costs embedded in its Now platform, which delivers stable, high ROIC and margin consistency. Expansion into AI-enhanced service management deepens this advantage in 2026.
Datadog, Inc.: Rapid Innovation Network Effects
Datadog leverages network effects via its integrated cloud monitoring platform, driving explosive revenue growth but with weaker ROIC versus ServiceNow. Its innovation pace fuels potential market disruption ahead.
Workflow Switching Costs vs. Network Effects Innovation
ServiceNow’s wider moat is anchored in entrenched customer workflows and steady profitability. Datadog’s moat is narrower but intensifying through product innovation. ServiceNow remains better positioned to defend market share long term.
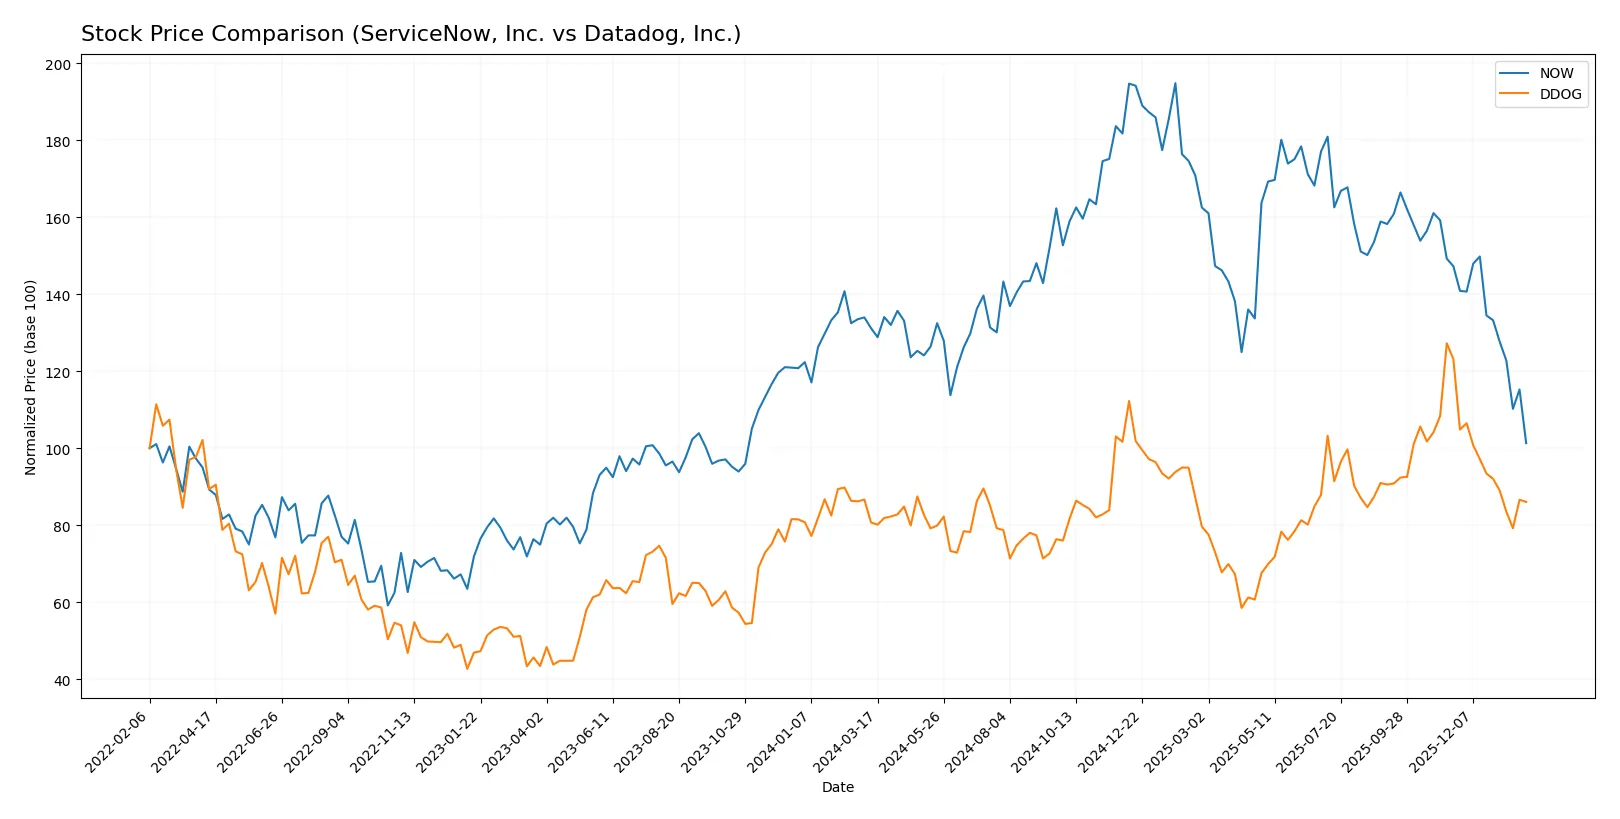
Which stock offers better returns?
The past year reveals contrasting price dynamics: ServiceNow, Inc. declines sharply while Datadog, Inc. edges higher before recent weakness.
Trend Comparison
ServiceNow, Inc. shows a bearish trend with a -22.79% price drop over 12 months. The decline decelerates despite high volatility and a recent sharper fall of -31.21%.
Datadog, Inc. posts a bullish trend with a 6.6% gain over the same period but also faces decelerating momentum. Recent trading mirrors ServiceNow’s weakness with a -30.1% fall.
Datadog outperformed ServiceNow in market returns over the past year, despite both stocks weakening significantly in the recent quarter.
Target Prices
Analysts present a wide consensus range for ServiceNow and Datadog, reflecting varied growth expectations.
| Company | Target Low | Target High | Consensus |
|---|---|---|---|
| ServiceNow, Inc. | 115 | 1315 | 440.14 |
| Datadog, Inc. | 105 | 215 | 175.84 |
ServiceNow’s target consensus at 440.14 far exceeds its current 117.01 price, signaling strong bullish sentiment. Datadog’s consensus of 175.84 also implies substantial upside from its 129.32 market price.

Don’t Let Luck Decide Your Entry Point
Optimize your entry points with our advanced ProRealTime indicators. You’ll get efficient buy signals with precise price targets for maximum performance. Start outperforming now!
How do institutions grade them?
ServiceNow, Inc. Grades
Here are the latest grades given by major financial institutions for ServiceNow, Inc.:
| Grading Company | Action | New Grade | Date |
|---|---|---|---|
| Citigroup | Maintain | Buy | 2026-01-30 |
| BTIG | Maintain | Buy | 2026-01-29 |
| Stifel | Maintain | Buy | 2026-01-29 |
| RBC Capital | Maintain | Outperform | 2026-01-29 |
| Macquarie | Maintain | Neutral | 2026-01-29 |
| DA Davidson | Maintain | Buy | 2026-01-29 |
| Needham | Maintain | Buy | 2026-01-29 |
| Keybanc | Maintain | Underweight | 2026-01-29 |
| Evercore ISI Group | Maintain | Outperform | 2026-01-29 |
| Cantor Fitzgerald | Maintain | Overweight | 2026-01-29 |
Datadog, Inc. Grades
Below are the current institutional grades for Datadog, Inc. from reputable sources:
| Grading Company | Action | New Grade | Date |
|---|---|---|---|
| Rosenblatt | Maintain | Buy | 2026-01-30 |
| Scotiabank | Maintain | Sector Outperform | 2026-01-27 |
| Stifel | Upgrade | Buy | 2026-01-22 |
| Mizuho | Maintain | Outperform | 2026-01-21 |
| TD Cowen | Maintain | Buy | 2026-01-21 |
| Citigroup | Maintain | Buy | 2026-01-16 |
| Keybanc | Maintain | Overweight | 2026-01-12 |
| Barclays | Maintain | Overweight | 2026-01-12 |
| Morgan Stanley | Upgrade | Overweight | 2026-01-12 |
| Truist Securities | Maintain | Hold | 2026-01-07 |
Which company has the best grades?
ServiceNow, Inc. generally holds consistent “Buy” and “Outperform” ratings, with some neutrality and one underweight. Datadog, Inc. features multiple upgrades to “Buy” and “Overweight,” with a strong “Sector Outperform” rating. Investors might view Datadog’s recent upgrades as signs of growing confidence, while ServiceNow’s steady ratings reflect stable institutional support.
Risks specific to each company
The following categories identify critical pressure points and systemic threats facing ServiceNow, Inc. and Datadog, Inc. in the 2026 market environment:
1. Market & Competition
ServiceNow, Inc.
- Established leader with broad enterprise cloud platform faces intense competition from legacy and emerging SaaS providers.
Datadog, Inc.
- Rapid growth in cloud monitoring but contends with larger incumbents and evolving tech stacks.
2. Capital Structure & Debt
ServiceNow, Inc.
- Conservative debt levels with 0.25 debt/equity ratio and strong interest coverage indicate financial stability.
Datadog, Inc.
- Higher leverage with 0.68 debt/equity ratio increases financial risk, though interest coverage remains healthy at 29.85.
3. Stock Volatility
ServiceNow, Inc.
- Beta near 1 (0.979) suggests moderate volatility aligned with market swings.
Datadog, Inc.
- Elevated beta (1.263) implies greater price fluctuation and higher investor risk exposure.
4. Regulatory & Legal
ServiceNow, Inc.
- Operates globally, exposed to data privacy and compliance risks in regulated sectors like healthcare and finance.
Datadog, Inc.
- Faces regulatory scrutiny in cross-border data handling and cloud security compliance amid expanding international operations.
5. Supply Chain & Operations
ServiceNow, Inc.
- Robust platform with diversified service offerings limits operational disruption risks.
Datadog, Inc.
- Dependence on cloud infrastructure providers could expose Datadog to service outages or cost pressures.
6. ESG & Climate Transition
ServiceNow, Inc.
- Increasing focus on governance and social responsibility but limited public disclosures on climate impact.
Datadog, Inc.
- Emerging ESG initiatives are in early stages; greater transparency needed to meet investor expectations.
7. Geopolitical Exposure
ServiceNow, Inc.
- Moderate exposure due to global customer base, vulnerable to trade tensions and data sovereignty laws.
Datadog, Inc.
- Concentrated U.S. presence mitigates some geopolitical risks but limits diversification benefits.
Which company shows a better risk-adjusted profile?
ServiceNow’s most impactful risk lies in its stretched valuation metrics and moderate liquidity risk. Datadog’s greatest concern is elevated leverage combined with higher stock volatility. Overall, ServiceNow presents a better risk-adjusted profile, supported by stronger balance sheet health and more stable stock behavior. The stark contrast in debt-to-equity ratios and beta values justifies heightened caution on Datadog’s financial risk.
Final Verdict: Which stock to choose?
ServiceNow’s superpower lies in its robust cash generation and steadily improving profitability. Its growing ROIC signals rising operational efficiency, though a current ratio below 1 remains a point of vigilance. This stock fits well in portfolios targeting aggressive growth with a tolerance for balance sheet tightness.
Datadog benefits from a clear strategic moat in cloud monitoring with strong liquidity and operational scalability. It offers a safer financial profile than ServiceNow, supported by a higher current ratio and solid interest coverage. Datadog suits investors seeking growth at a reasonable price with better short-term stability.
If you prioritize efficient capital deployment and strong cash flows, ServiceNow is the compelling choice due to its improving profitability despite liquidity concerns. However, if you seek greater balance sheet safety and a durable cloud moat, Datadog offers better stability, albeit at a higher valuation premium. Both present distinct opportunities aligned with different risk appetites.
Disclaimer: Investment carries a risk of loss of initial capital. The past performance is not a reliable indicator of future results. Be sure to understand risks before making an investment decision.
Go Further
I encourage you to read the complete analyses of ServiceNow, Inc. and Datadog, Inc. to enhance your investment decisions: