Home > Comparison > Healthcare > DHR vs RDNT
The strategic rivalry between Danaher Corporation and RadNet, Inc. shapes healthcare diagnostics and research innovation. Danaher operates as a global medical technology conglomerate with diversified, capital-intensive segments. RadNet focuses on outpatient diagnostic imaging services, leveraging AI to enhance radiology interpretations. This analysis explores their contrasting operational models and growth trajectories. I aim to identify which company offers a superior risk-adjusted return, essential for investors seeking balanced exposure in the evolving healthcare sector.

Table of contents
Companies Overview
Danaher Corporation and RadNet, Inc. are key players shaping the medical diagnostics and research landscape in the US healthcare sector.
Danaher Corporation: Diversified Innovator in Life Sciences and Diagnostics
Danaher dominates the medical diagnostics and research industry with a broad portfolio spanning Life Sciences, Diagnostics, and Environmental & Applied Solutions. Its revenue base relies on advanced instruments and consumables serving pharmaceutical, biopharmaceutical, and healthcare customers globally. In 2026, Danaher emphasizes innovation in genomics, automation, and diagnostics systems to strengthen its integrated solutions and extend its competitive moat.
RadNet, Inc.: Outpatient Imaging and AI Solutions Leader
RadNet specializes in outpatient diagnostic imaging services across multiple modalities including MRI, CT, and mammography. The company generates revenue by operating over 340 imaging centers and enhancing diagnostic accuracy through AI-powered software suites for cancer detection. In 2026, RadNet focuses on expanding its imaging network and deploying AI tools to improve radiologist workflow and patient outcomes.
Strategic Collision: Similarities & Divergences
Both companies operate in diagnostics but diverge sharply: Danaher pursues a diversified technology platform with a global footprint while RadNet focuses on a service-driven outpatient imaging model primarily in the US. Their competition centers on diagnostic precision and innovation, with Danaher leveraging scale and R&D, and RadNet capitalizing on AI-enhanced clinical services. This contrast defines distinct investment profiles—Danaher as a tech-driven industrial leader, RadNet as a niche healthcare service provider.
Income Statement Comparison
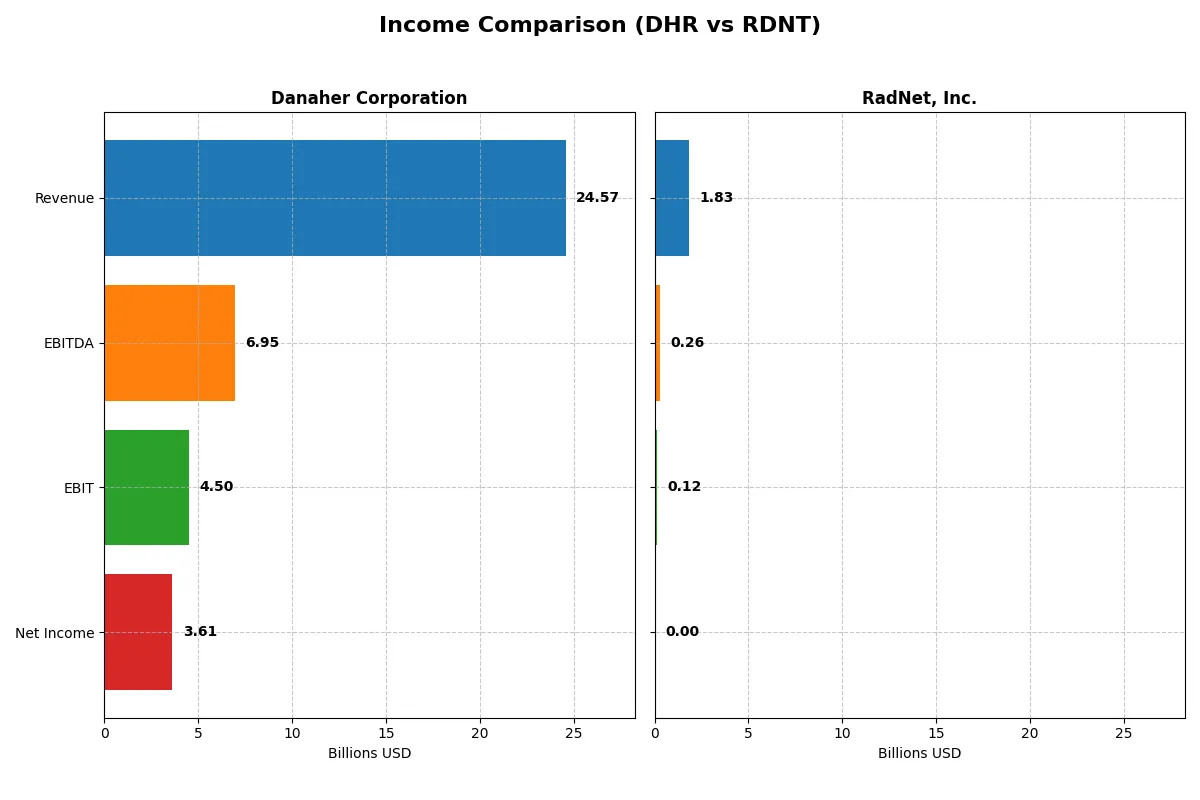
The following data dissects the core profitability and scalability of both corporate engines to reveal who dominates the bottom line:
| Metric | Danaher Corporation (DHR) | RadNet, Inc. (RDNT) |
|---|---|---|
| Revenue | 24.6B | 1.83B |
| Cost of Revenue | 9.60B | 1.58B |
| Operating Expenses | 9.83B | 144.5M |
| Gross Profit | 14.97B | 249.1M |
| EBITDA | 6.95B | 262.5M |
| EBIT | 4.50B | 124.7M |
| Interest Expense | 265M | 79.8M |
| Net Income | 3.61B | 2.79M |
| EPS | 5.07 | 0.038 |
| Fiscal Year | 2025 | 2024 |
Income Statement Analysis: The Bottom-Line Duel
This income statement comparison reveals which company operates with greater efficiency and financial discipline in their core business.
Danaher Corporation Analysis
Danaher’s revenue declined 16.6% from 2021 to 2025, with net income shrinking 43.8% over the same period. Despite this, it maintains a strong gross margin near 61% and a net margin of 14.7%, signaling robust profitability. However, recent declines in EBIT (-8.7%) and EPS (-4.7%) suggest weakening momentum in 2025.
RadNet, Inc. Analysis
RadNet’s revenue surged 70.7% from 2020 to 2024, alongside a net income growth of 118.8%. Its gross margin is thin at 13.6%, and net margin nearly breaks even at 0.15%. The company shows positive EBIT growth (+20.7%) in 2024, yet its net margin and EPS contracted last year, indicating operational challenges despite top-line expansion.
Margin Strength vs. Growth Trajectory
Danaher delivers superior margin quality and profitability, though it faces revenue and earnings contraction. RadNet achieves rapid top-line and net income growth but suffers from razor-thin margins and recent profitability dips. For investors, Danaher’s profile suits those prioritizing stable profits, while RadNet appeals to growth seekers willing to accept higher operational risks.
Financial Ratios Comparison
These vital ratios act as a diagnostic tool to expose the underlying fiscal health, valuation premiums, and capital efficiency of the companies analyzed:
| Ratios | Danaher Corporation (DHR) | RadNet, Inc. (RDNT) |
|---|---|---|
| ROE | 6.9% | 0.3% |
| ROIC | 5.7% | 3.1% |
| P/E | 44.8 | 1826.3 |
| P/B | 3.08 | 5.65 |
| Current Ratio | 1.87 | 2.12 |
| Quick Ratio | 1.51 | 2.12 |
| D/E | 0.35 | 1.92 |
| Debt-to-Assets | 22.1% | 52.6% |
| Interest Coverage | 19.4 | 1.31 |
| Asset Turnover | 0.29 | 0.56 |
| Fixed Asset Turnover | 4.44 | 1.37 |
| Payout Ratio | 24.3% | 0% |
| Dividend Yield | 0.54% | 0% |
| Fiscal Year | 2025 | 2024 |
Efficiency & Valuation Duel: The Vital Signs
Financial ratios serve as a company’s DNA, uncovering hidden risks and operational strengths that shape investor decisions.
Danaher Corporation
Danaher posts a solid 14.7% net margin but a modest 6.9% ROE, indicating moderate profitability. Its P/E ratio at 44.8 signals a stretched valuation. The company maintains a 0.54% dividend yield, reflecting some shareholder returns amid ongoing reinvestment in R&D and operational efficiency.
RadNet, Inc.
RadNet struggles with a razor-thin 0.15% net margin and a negligible 0.31% ROE, highlighting weak profitability. Its P/E soars to 1826, marking the stock as extremely expensive. The absence of dividends points to a growth-focused reinvestment strategy, but elevated debt ratios raise caution.
Premium Valuation vs. Operational Safety
Danaher offers a more balanced risk-reward profile with favorable operational metrics despite a premium valuation. RadNet’s lofty multiples and poor profitability suggest higher risk. Conservative investors may prefer Danaher’s steadier returns; growth seekers might find RadNet’s profile more speculative.
Which one offers the Superior Shareholder Reward?
Danaher Corporation (DHR) delivers a superior shareholder reward compared to RadNet, Inc. (RDNT). DHR pays a modest but sustainable dividend yield of 0.54%, with a conservative 24% payout ratio backed by strong free cash flow coverage (82%). It pairs this with aggressive buybacks, enhancing total returns. RDNT offers no dividends and suffers from weak free cash flow (only 19% coverage of operating cash flow), relying on reinvestment amid high debt (debt-to-equity above 1.9x) and limited buyback activity. Historically, DHR’s balanced distribution model supports long-term value, while RDNT’s growth strategy carries elevated financial risk. I favor DHR for a more reliable and attractive total return in 2026.
Comparative Score Analysis: The Strategic Profile
The radar chart reveals the fundamental DNA and trade-offs of Danaher Corporation and RadNet, Inc., highlighting their financial strengths and vulnerabilities:
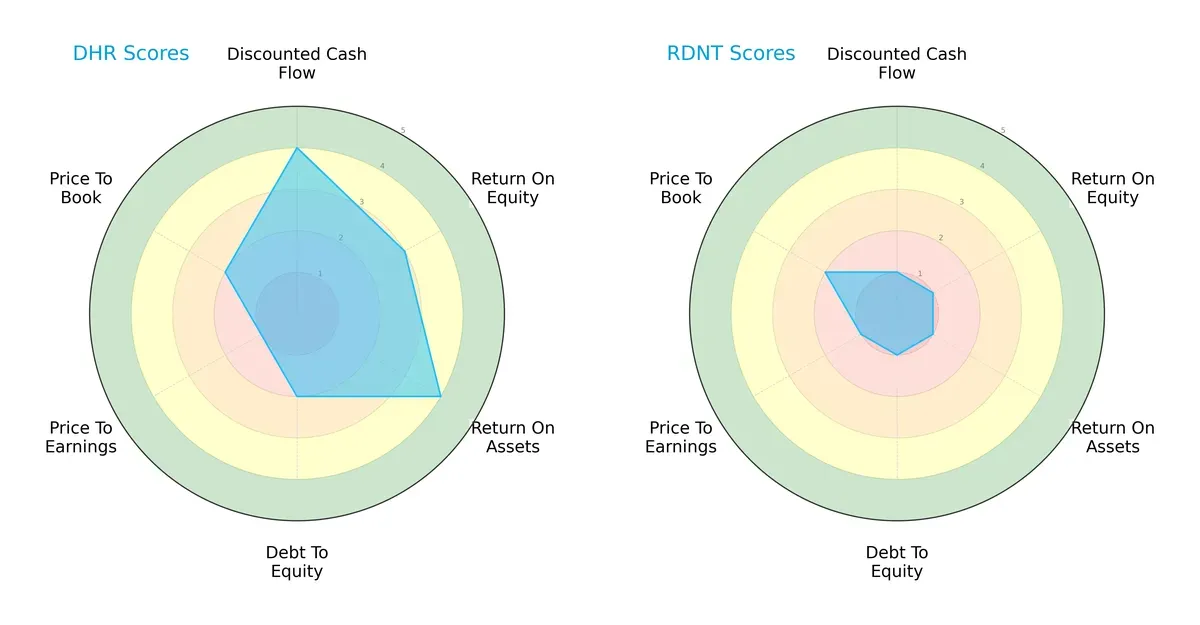
Danaher shows a balanced profile with strong DCF (4) and ROA (4) scores, moderate ROE (3), and some leverage risk (debt-to-equity 2). RadNet scores very low across DCF, ROE, ROA, and debt, indicating poor profitability and financial stability. Danaher relies on operational efficiency and cash flow, while RadNet lacks a clear competitive edge.
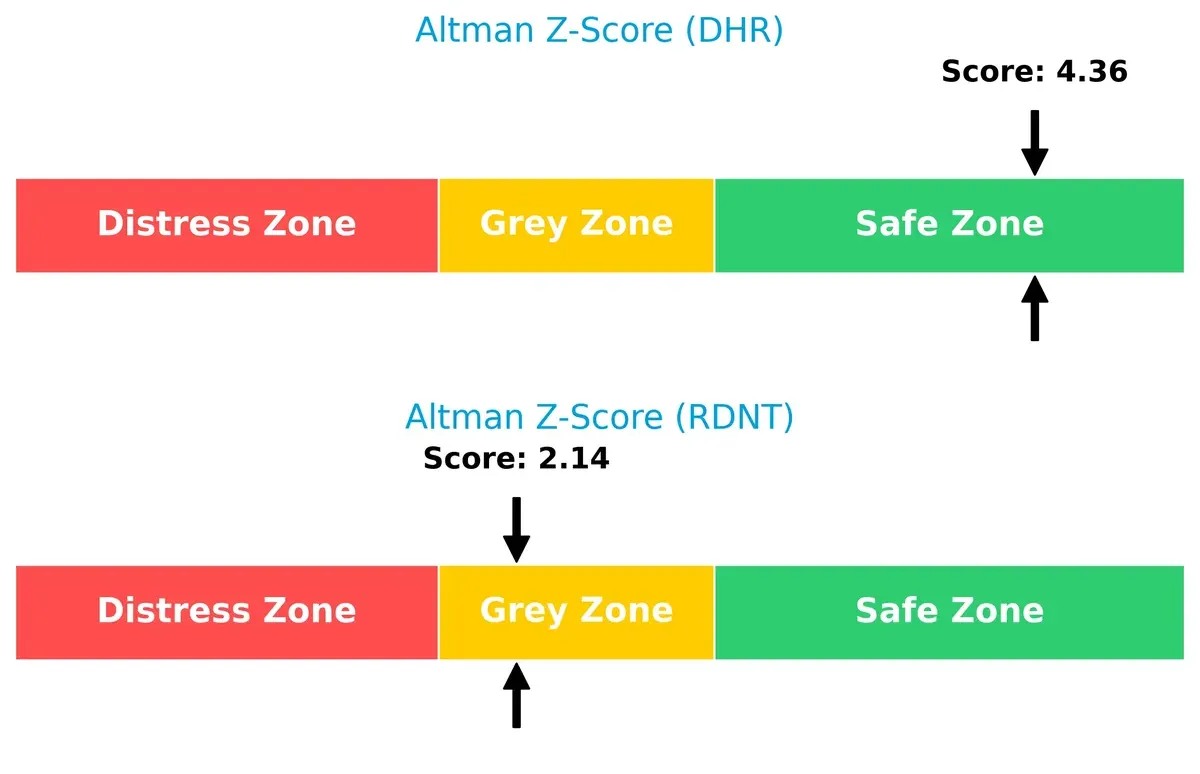
Bankruptcy Risk: Solvency Showdown
Danaher’s Altman Z-Score of 4.36 places it firmly in the safe zone, signaling strong solvency and low bankruptcy risk. RadNet’s 2.14 score falls into the grey zone, implying moderate risk and caution for long-term investors:
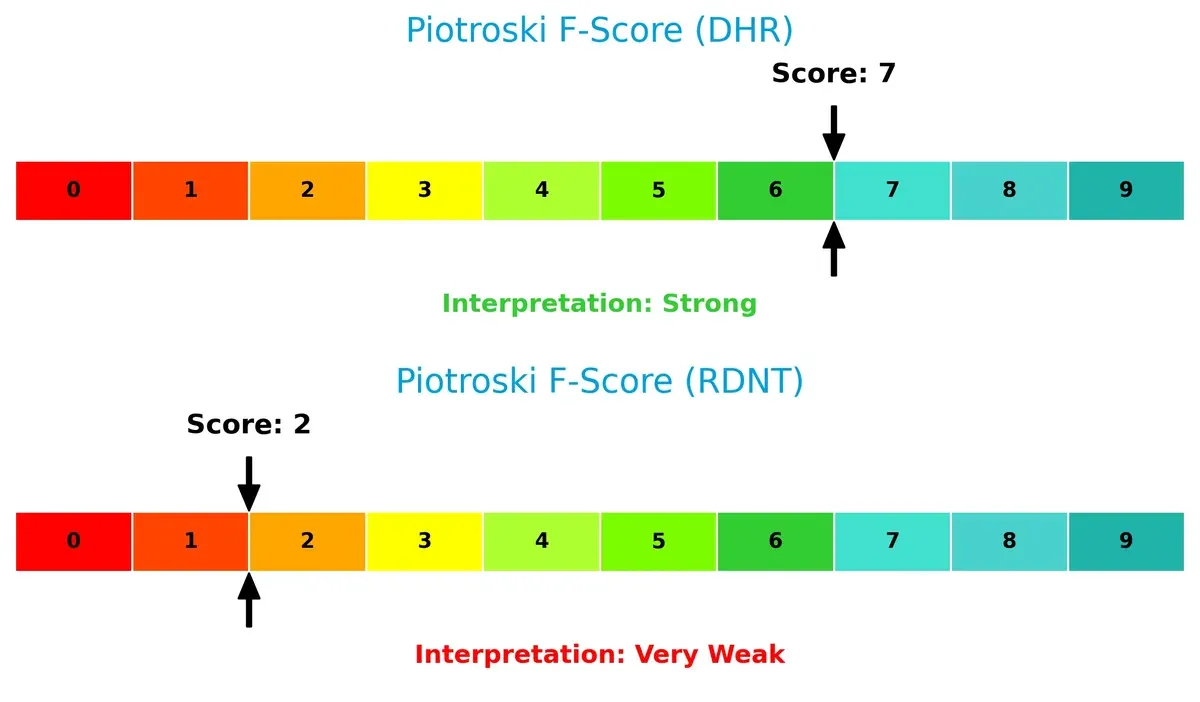
Financial Health: Quality of Operations
Danaher’s Piotroski F-Score of 7 indicates robust financial health and operational quality. RadNet’s score of 2 raises red flags about weak profitability and financial distress:
How are the two companies positioned?
This section dissects Danaher and RadNet’s operational DNA by comparing revenue distribution and internal dynamics. The goal is to confront their economic moats to reveal the more resilient, sustainable competitive advantage today.
Revenue Segmentation: The Strategic Mix
The following visual comparison dissects how both firms diversify their income streams and where their primary sector bets lie:
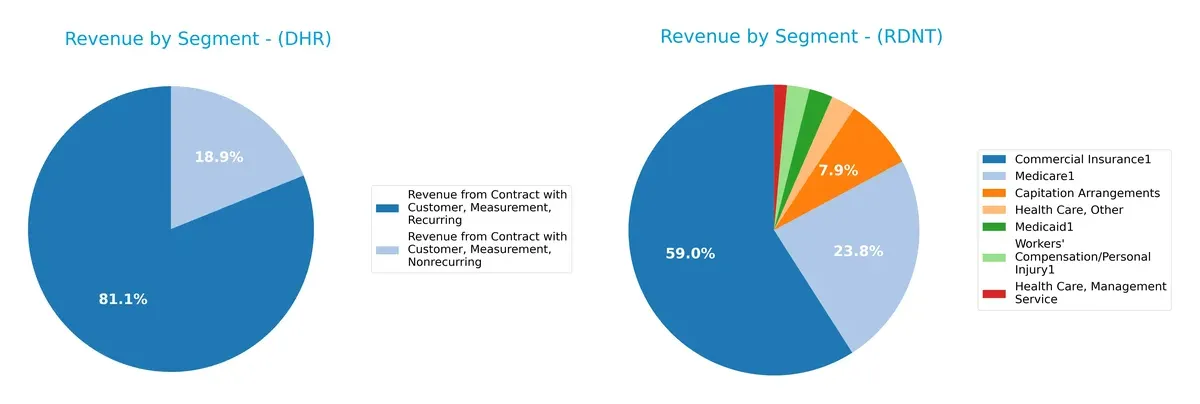
Danaher Corporation anchors its revenue heavily in recurring measurement contracts, generating $19.4B in 2024, dwarfing its $4.5B nonrecurring segment. This reveals a robust, stable ecosystem lock-in. RadNet, Inc. shows a more fragmented mix, with $1.0B from Commercial Insurance and $410M Medicare, among several smaller streams. RadNet’s spread reflects exposure to healthcare reimbursement cycles, raising concentration risk compared to Danaher’s infrastructure dominance.
Strengths and Weaknesses Comparison
This table compares the Strengths and Weaknesses of Danaher Corporation and RadNet, Inc.:
Danaher Corporation Strengths
- Diversified revenue streams across measurement, dental, diagnostics, and life sciences
- Strong global presence in North America, China, and developed markets
- Favorable net margin at 14.71%
- Strong liquidity ratios with current ratio 1.87 and quick ratio 1.51
RadNet, Inc. Strengths
- Favorable liquidity with current and quick ratios at 2.12
- Presence in the U.S. healthcare market with multiple insurance segments
- Neutral asset turnover metrics indicating operational efficiency potential
Danaher Corporation Weaknesses
- Unfavorable ROE at 6.88% below WACC
- High P/E ratio at 44.8 indicating expensive valuation
- Unfavorable price-to-book at 3.08
- Asset turnover low at 0.29 limits capital efficiency
- Low dividend yield at 0.54%
RadNet, Inc. Weaknesses
- Very low profitability with net margin at 0.15% and ROE at 0.31%
- Unfavorable leverage ratios including debt-to-assets at 52.6%
- High P/E of 1826.32 and price-to-book at 5.65 signal overvaluation
- Weak interest coverage at 1.56
- No dividend yield
Danaher demonstrates broad diversification and global scale supporting profitability and liquidity but faces valuation and capital efficiency challenges. RadNet shows strong liquidity but suffers from weak profitability and high leverage, impairing financial stability. These contrasts highlight differing strategic focuses and risk profiles for each company.
The Moat Duel: Analyzing Competitive Defensibility
Structural moats shield long-term profits from relentless competitive erosion. Only durable advantages can sustain market leadership in 2026:
Danaher Corporation: Intangible Asset Powerhouse
Danaher’s moat centers on intangible assets—patented technologies and deep R&D expertise. This drives stable margins near 19% EBIT, but declining ROIC signals looming pressure. Expansion into life sciences could either reinforce or strain this advantage.
RadNet, Inc.: Network Effects and Scale in Imaging
RadNet leverages network effects through extensive outpatient centers and AI diagnostic tools, fueling 13% revenue growth overall. Despite a low net margin, improving ROIC suggests strengthening competitive positioning versus Danaher’s shrinking profitability.
Verdict: Intangible Assets vs. Network Effects in Medical Diagnostics
RadNet’s growing ROIC and scale-driven network effects offer a deeper moat than Danaher’s eroding intangible asset base. RadNet appears better positioned to defend and expand market share amid rising industry competition.
Which stock offers better returns?
The past year reveals contrasting dynamics: Danaher’s shares fell sharply with accelerating losses, while RadNet surged impressively despite recent deceleration and a mild pullback.
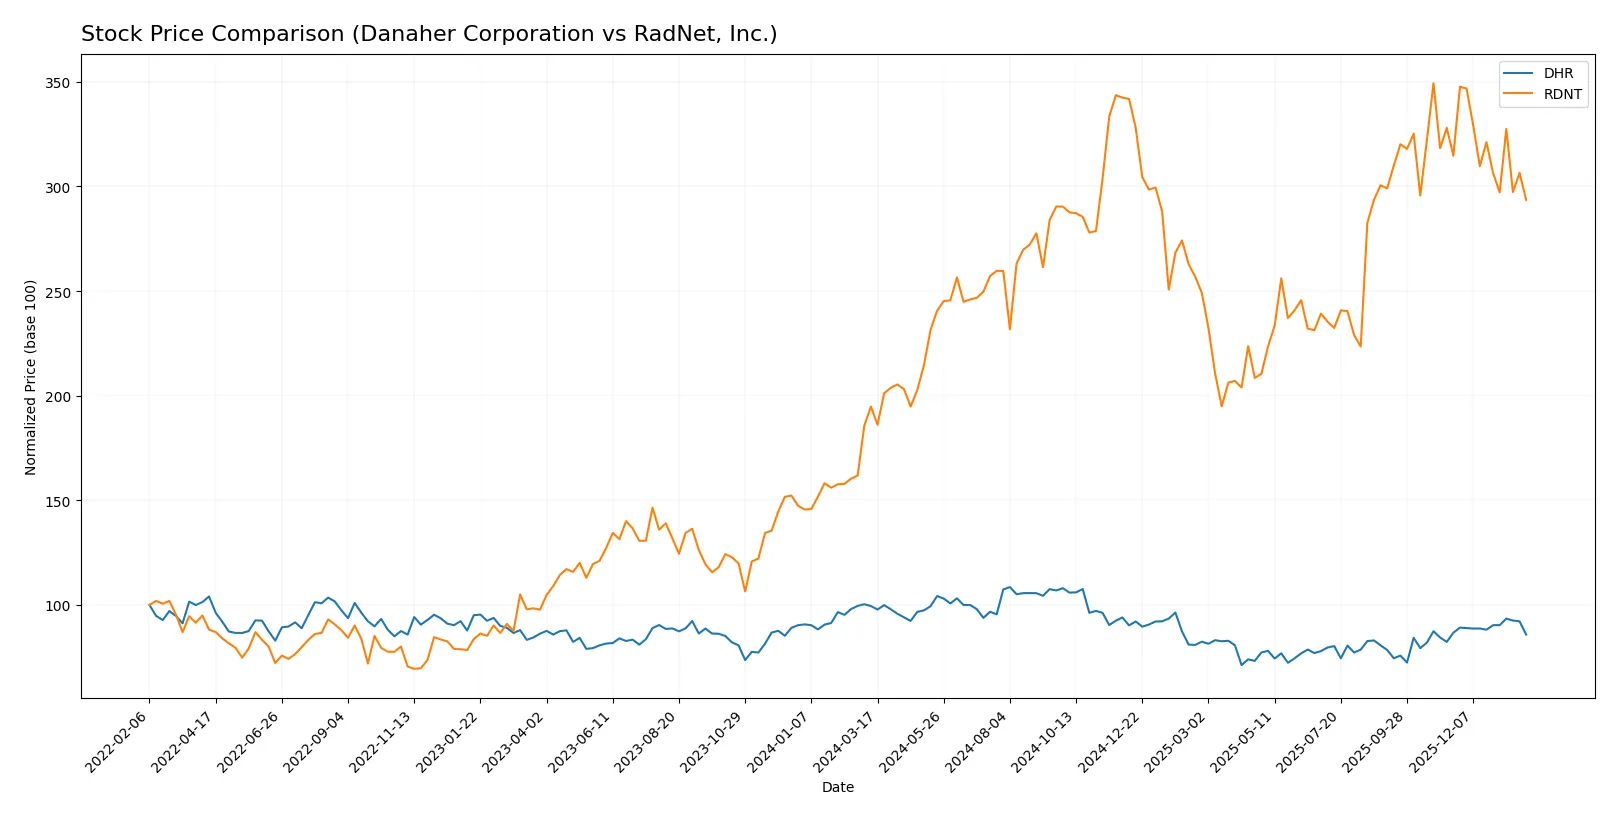
Trend Comparison
Danaher Corporation’s stock declined 13.72% over the last 12 months, marking a bearish trend with accelerating downward momentum. It hit a high of 276.75 and a low of 181.77, showing elevated volatility at 26.61.
RadNet, Inc. recorded a robust 50.72% gain over the same period, reflecting a bullish trend despite decelerating growth. The stock ranged between 44.45 and 83.41, with moderate volatility of 10.38.
RadNet outperformed Danaher significantly, delivering the highest market return despite a recent slight decline. Danaher’s trend remains negative with accelerating losses.
Target Prices
Analysts present a bullish consensus for Danaher Corporation and RadNet, Inc., suggesting upside potential from current prices.
| Company | Target Low | Target High | Consensus |
|---|---|---|---|
| Danaher Corporation | 220 | 270 | 252.33 |
| RadNet, Inc. | 90 | 95 | 92.25 |
Danaher’s target consensus at 252.33 is about 15% above its current price of 218.89, signaling strong growth expectations. RadNet’s consensus target of 92.25 implies a robust 32% premium over its 70.1 market price.

Don’t Let Luck Decide Your Entry Point
Optimize your entry points with our advanced ProRealTime indicators. You’ll get efficient buy signals with precise price targets for maximum performance. Start outperforming now!
How do institutions grade them?
Danaher Corporation Grades
The following table summarizes recent grades from major financial institutions for Danaher Corporation:
| Grading Company | Action | New Grade | Date |
|---|---|---|---|
| JP Morgan | Maintain | Overweight | 2026-01-29 |
| Jefferies | Maintain | Buy | 2026-01-29 |
| TD Cowen | Maintain | Buy | 2026-01-07 |
| Guggenheim | Maintain | Buy | 2026-01-05 |
| Wells Fargo | Maintain | Equal Weight | 2025-12-15 |
| Wells Fargo | Maintain | Equal Weight | 2025-10-23 |
| Barclays | Maintain | Overweight | 2025-10-22 |
| TD Cowen | Maintain | Buy | 2025-10-22 |
| Rothschild & Co | Downgrade | Neutral | 2025-10-08 |
| Evercore ISI Group | Maintain | Outperform | 2025-10-07 |
RadNet, Inc. Grades
Here are the most recent institutional grades for RadNet, Inc.:
| Grading Company | Action | New Grade | Date |
|---|---|---|---|
| B. Riley Securities | Maintain | Buy | 2025-12-01 |
| Barclays | Maintain | Overweight | 2025-11-13 |
| Truist Securities | Maintain | Buy | 2025-11-12 |
| Truist Securities | Maintain | Buy | 2025-09-03 |
| Barclays | Maintain | Overweight | 2025-09-03 |
| Raymond James | Maintain | Strong Buy | 2025-08-13 |
| Truist Securities | Maintain | Buy | 2025-04-11 |
| Barclays | Maintain | Overweight | 2025-03-24 |
| Raymond James | Upgrade | Strong Buy | 2025-03-05 |
| Barclays | Maintain | Overweight | 2025-01-22 |
Which company has the best grades?
RadNet, Inc. generally receives more bullish ratings, including multiple Strong Buy grades and recent upgrades. Danaher’s ratings mostly range from Buy to Overweight, with one Neutral downgrade. Investors might view RadNet’s higher grades as a signal of greater confidence from analysts.
Risks specific to each company
The following categories identify the critical pressure points and systemic threats facing both firms in the 2026 market environment:
1. Market & Competition
Danaher Corporation
- Operates globally with diversified segments, facing intense innovation-driven competition.
RadNet, Inc.
- Focuses on outpatient imaging in the U.S., exposed to regional competition and price sensitivity.
2. Capital Structure & Debt
Danaher Corporation
- Maintains a conservative debt-to-equity ratio (0.35), signaling financial stability.
RadNet, Inc.
- High leverage with debt-to-equity of 1.92, increasing financial risk and interest burden.
3. Stock Volatility
Danaher Corporation
- Beta of 0.93 suggests lower volatility, offering relative price stability.
RadNet, Inc.
- Beta of 1.51 indicates higher volatility, subject to greater market swings.
4. Regulatory & Legal
Danaher Corporation
- Faces broad healthcare compliance risks but benefits from diversified product lines reducing single-point exposure.
RadNet, Inc.
- Heavily regulated diagnostic services with potential reimbursement and compliance risks concentrated in U.S. states.
5. Supply Chain & Operations
Danaher Corporation
- Complex global supply chain; potential disruption risk but mitigated by diversified operations.
RadNet, Inc.
- Supply chain more localized; operational risks tied to center management and regional disruptions.
6. ESG & Climate Transition
Danaher Corporation
- Increasing focus on environmental solutions; ESG initiatives integrated into corporate strategy.
RadNet, Inc.
- ESG risks present but less diversified efforts; climate transition impact less pronounced.
7. Geopolitical Exposure
Danaher Corporation
- Global footprint exposes it to geopolitical tensions but provides risk diversification.
RadNet, Inc.
- Primarily U.S.-based operations limit geopolitical risk but increase domestic regulatory exposure.
Which company shows a better risk-adjusted profile?
Danaher’s most impactful risk is market competition amid rapid innovation but its strong financial stability and diversified model mitigate this well. RadNet’s highest risk is its heavy debt load that pressures cash flow and increases bankruptcy risk, as reflected in its grey zone Altman Z-score. Danaher’s lower leverage, safer Altman Z-score (4.36), and stronger Piotroski score (7) show a clearly better risk-adjusted profile. RadNet’s elevated stock volatility and financial distress indicators confirm my concern about its fragile position.
Final Verdict: Which stock to choose?
Danaher’s superpower lies in its operational resilience and strong balance sheet, delivering consistent cash flow even amid margin pressures. Its declining profitability is a point of vigilance, signaling a need for cautious monitoring. It fits well in portfolios seeking steady industrial exposure with measured risk tolerance.
RadNet commands a strategic moat through its growth trajectory and improving profitability metrics, despite current financial fragility. Its rapid revenue expansion and cash conversion cycle efficiency offer a growth platform. RadNet suits investors with a higher risk appetite focused on turnaround and growth potential.
If you prioritize stability and cash generation, Danaher is the compelling choice due to its robust financial footing and operational efficiency. However, if you seek higher growth and can tolerate volatility, RadNet offers better upside with its expanding market footprint and improving profitability, though it carries elevated balance sheet risks.
Disclaimer: Investment carries a risk of loss of initial capital. The past performance is not a reliable indicator of future results. Be sure to understand risks before making an investment decision.
Go Further
I encourage you to read the complete analyses of Danaher Corporation and RadNet, Inc. to enhance your investment decisions: