Home > Comparison > Technology > MSFT vs CYBR
The strategic rivalry between Microsoft Corporation and CyberArk Software Ltd. shapes the evolution of the software infrastructure sector. Microsoft, a diversified technology titan, integrates cloud, productivity, and personal computing solutions. CyberArk, a focused cybersecurity specialist, targets privileged access management with SaaS-driven innovation. This analysis pits broad scale against niche expertise to identify which trajectory offers superior risk-adjusted returns for a balanced portfolio in today’s dynamic tech landscape.
Table of contents
Companies Overview
Microsoft Corporation and CyberArk Software Ltd. stand as pivotal players in the software infrastructure industry, shaping digital landscapes globally.
Microsoft Corporation: Global Software Giant
Microsoft dominates the software infrastructure sector with a diverse product portfolio. Its core revenue stems from cloud services, productivity solutions, and personal computing devices. In 2026, Microsoft’s strategic focus remains on expanding its Intelligent Cloud segment and integrating AI-driven services to fortify its competitive edge.
CyberArk Software Ltd.: Cybersecurity Specialist
CyberArk specializes in privileged access management and identity security software. Its revenue primarily comes from SaaS solutions that control and secure privileged credentials across cloud and on-premises environments. The company’s 2026 strategy centers on enhancing cloud entitlements and identity access management services, targeting risk reduction in complex IT landscapes.
Strategic Collision: Similarities & Divergences
Both firms prioritize software infrastructure but diverge in scope: Microsoft builds a broad ecosystem, while CyberArk focuses on niche cybersecurity. They compete mainly in cloud security and identity management markets. Microsoft offers scale and integration; CyberArk delivers specialized defense. Their investment profiles contrast between a tech behemoth with diversified revenue and a focused growth player in cybersecurity.
Income Statement Comparison
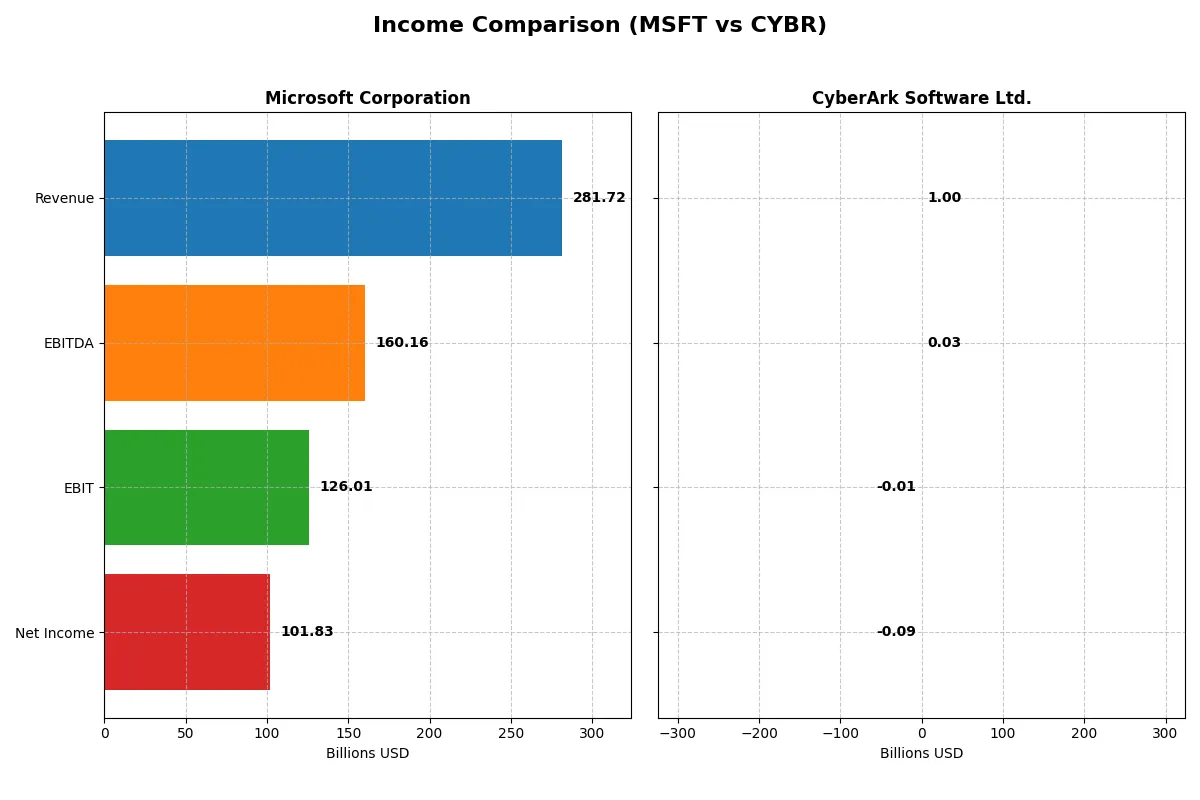
This breakdown dissects the core profitability and scalability of both corporate engines to reveal who dominates the bottom line:
| Metric | Microsoft Corporation (MSFT) | CyberArk Software Ltd. (CYBR) |
|---|---|---|
| Revenue | 282B | 1B |
| Cost of Revenue | 88B | 208M |
| Operating Expenses | 65B | 865M |
| Gross Profit | 194B | 792M |
| EBITDA | 160B | 29M |
| EBIT | 126B | -13M |
| Interest Expense | 2.4B | 4.1M |
| Net Income | 102B | -93M |
| EPS | 13.7 | -2.12 |
| Fiscal Year | 2025 | 2024 |
Income Statement Analysis: The Bottom-Line Duel
This income statement comparison reveals which company converts revenue into profits most efficiently, spotlighting operational strength and financial momentum.
Microsoft Corporation Analysis
Microsoft’s revenue surged from $168B in 2021 to $282B in 2025, reflecting robust growth. Net income climbed steadily, reaching $102B in 2025 with a strong 36% net margin. Its gross margin holds near 69%, demonstrating consistent cost control. The latest fiscal year shows healthy expansion, with EBIT margin at 45%, underscoring impressive operating efficiency.
CyberArk Software Ltd. Analysis
CyberArk’s revenue rose from $464M in 2020 to $1B in 2024, marking aggressive top-line growth of 115%. However, it remains unprofitable, posting a net loss of $93M in 2024 and a negative 9.3% net margin. Despite a favorable gross margin near 79%, operating losses persist with an EBIT margin below zero. The latest year shows improving EBIT but continued net income challenges.
Margin Dominance vs. Growth Struggles
Microsoft demonstrates superior profitability and margin stability, converting scale into sustained earnings growth. CyberArk excels in revenue momentum but struggles to reach profitability. For investors prioritizing fundamental strength and efficiency, Microsoft’s profile offers a clearer path to durable returns in 2026.
Financial Ratios Comparison
These vital ratios act as a diagnostic tool to expose underlying fiscal health, valuation premiums, and capital efficiency for clear investor insight:
| Ratios | Microsoft Corporation (MSFT) | CyberArk Software Ltd. (CYBR) |
|---|---|---|
| ROE | 29.6% | -3.9% |
| ROIC | 22.0% | -2.9% |
| P/E | 36.3 | -157.5 |
| P/B | 10.8 | 6.2 |
| Current Ratio | 1.35 | 1.48 |
| Quick Ratio | 1.35 | 1.48 |
| D/E | 0.18 | 0.01 |
| Debt-to-Assets | 9.8% | 0.9% |
| Interest Coverage | 53.9 | -17.9 |
| Asset Turnover | 0.46 | 0.30 |
| Fixed Asset Turnover | 1.23 | 51.1 |
| Payout ratio | 23.6% | 0% |
| Dividend yield | 0.65% | 0% |
| Fiscal Year | 2025 | 2024 |
Efficiency & Valuation Duel: The Vital Signs
Financial ratios act as a company’s DNA, revealing hidden risks and operational strengths that drive investment decisions.
Microsoft Corporation
Microsoft delivers robust profitability with a 29.65% ROE and a strong 36.15% net margin, signaling operational excellence. Its valuation appears stretched, reflected by a high 36.31 P/E and 10.76 P/B, above sector norms. Shareholders receive modest dividends (0.65% yield), with the firm also reinvesting heavily in R&D to fuel sustainable growth.
CyberArk Software Ltd.
CyberArk struggles with negative profitability metrics, including a -3.94% ROE and -9.34% net margin, indicating ongoing losses. The stock trades at a negative P/E but a moderately high 6.21 P/B, suggesting valuation concerns. The company pays no dividends, channeling resources into aggressive R&D and growth initiatives to improve future returns.
Premium Valuation vs. Operational Safety
Microsoft offers a superior balance of profitability and capital efficiency despite stretched valuation metrics. CyberArk’s negative returns and high risk profile contrast sharply. Investors seeking stable, operationally sound exposure may favor Microsoft, while those tolerant of risk might consider CyberArk’s growth potential.
Which one offers the Superior Shareholder Reward?
Microsoft Corporation (MSFT) pays a modest dividend yield around 0.65% with a sustainable payout ratio near 24%, backed by robust free cash flow coverage above 50%. It pairs dividends with a consistent, large-scale buyback program, strengthening total shareholder return. CyberArk Software Ltd. (CYBR) pays no dividends, reinvesting heavily in growth and R&D, but lacks profitability and shows volatile cash flow. Its buyback activity is minimal or absent. I see Microsoft’s balanced distribution strategy as superior and more sustainable in 2026, offering a more attractive total return profile given its reliable cash generation and shareholder-friendly capital allocation.
Comparative Score Analysis: The Strategic Profile
The radar chart reveals the fundamental DNA and trade-offs of Microsoft Corporation and CyberArk Software Ltd., highlighting their core financial strengths and weaknesses:
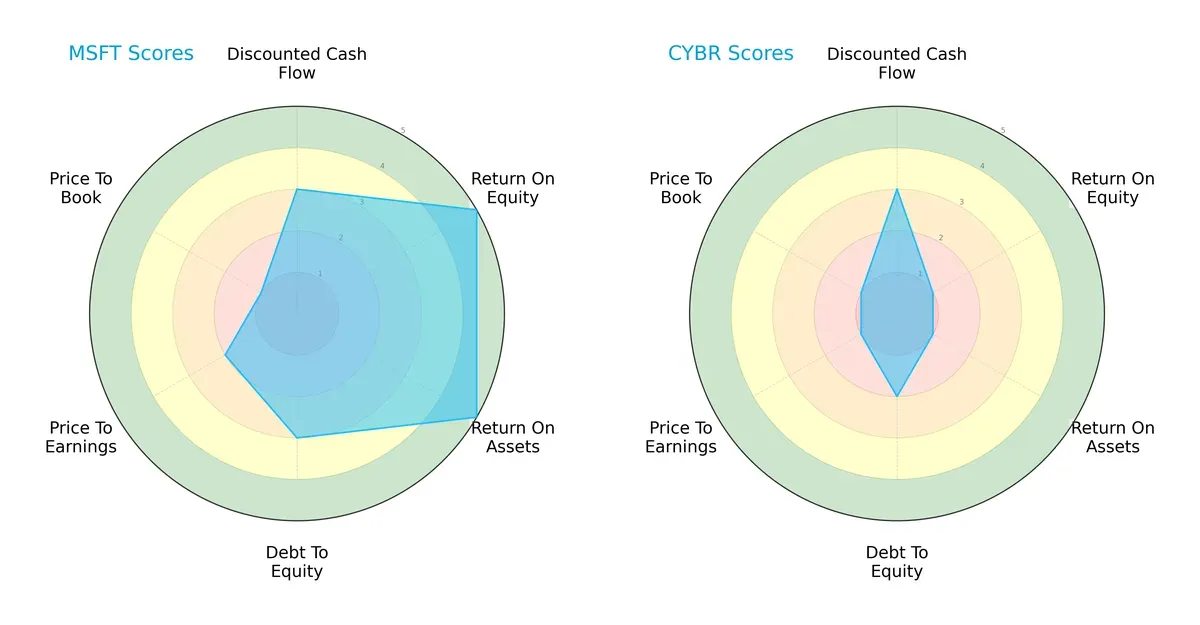
Microsoft shows a balanced profile with strong ROE and ROA scores (both 5), indicating superior profitability and asset efficiency. CyberArk lags significantly with low ROE and ROA (both 1), relying mostly on moderate DCF (3) and slightly better debt management. Microsoft’s moderate valuation scores (P/E 2, P/B 1) reflect some premium pricing, but it maintains financial resilience. CyberArk’s overall weak scores reveal a reliance on niche strengths rather than broad financial health.
—
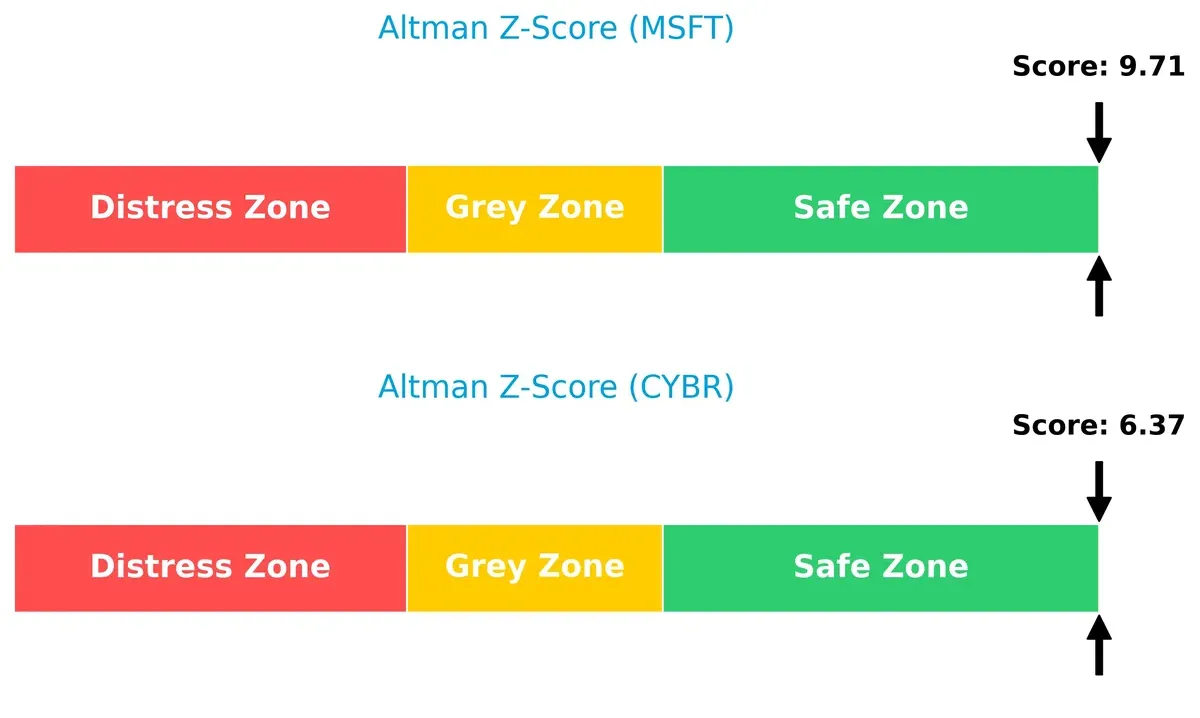
Bankruptcy Risk: Solvency Showdown
Microsoft’s Altman Z-Score (9.7) substantially exceeds CyberArk’s (6.4), both safely above distress thresholds, indicating Microsoft’s superior long-term survival prospects in this economic cycle:
—
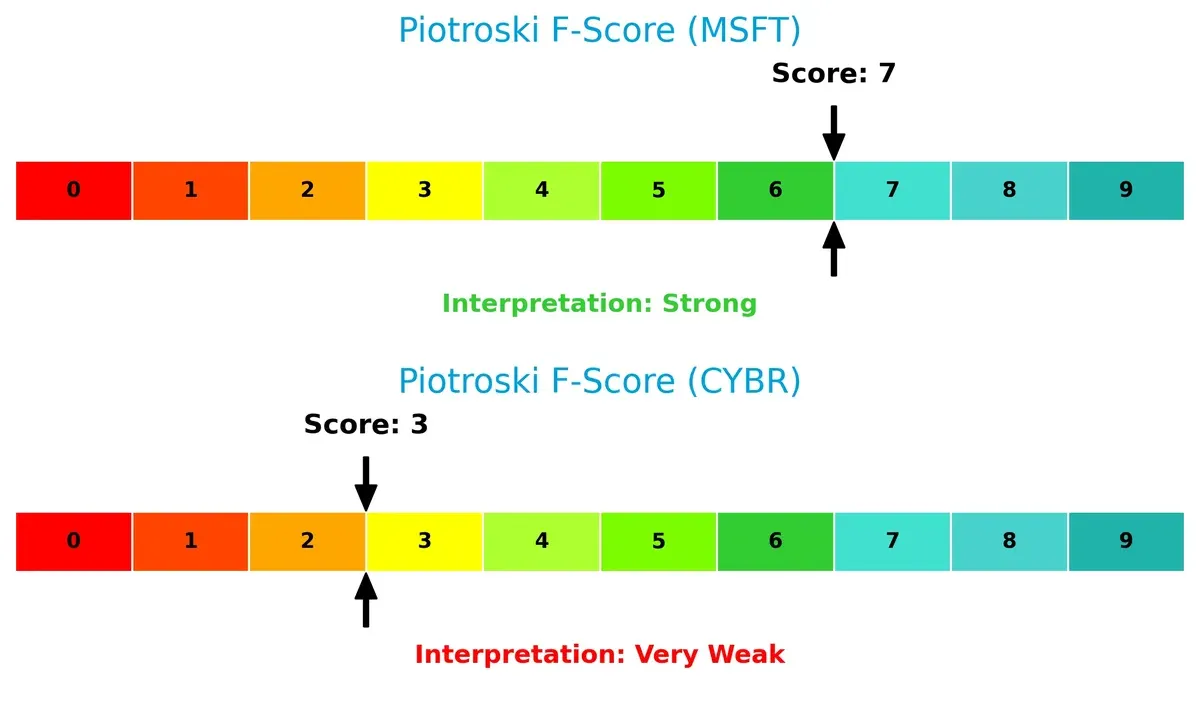
Financial Health: Quality of Operations
Microsoft’s Piotroski F-Score of 7 signals strong operational and financial health. CyberArk’s low score of 3 raises red flags about internal financial weaknesses and operational risks:
How are the two companies positioned?
This section dissects the operational DNA of Microsoft and CyberArk by comparing their revenue distribution and internal dynamics. The goal is to confront their economic moats to reveal which business model offers the most resilient competitive advantage today.
Revenue Segmentation: The Strategic Mix
This comparison dissects how Microsoft Corporation and CyberArk Software Ltd. diversify income streams and reveals their primary sector bets:
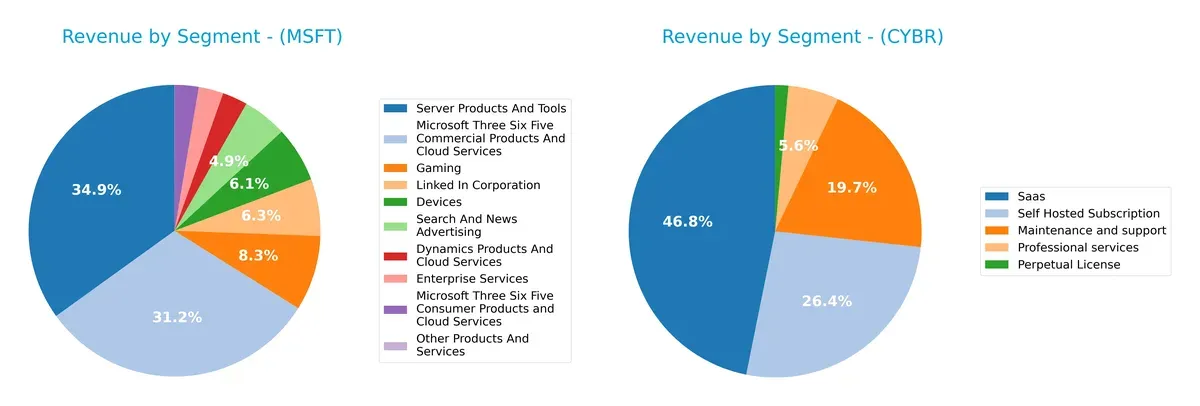
Microsoft’s revenue dwarfs CyberArk’s, anchored heavily in Server Products and Tools ($98.4B) and Microsoft 365 Commercial ($87.8B). Its diverse streams span gaming ($23.5B), LinkedIn ($17.8B), and devices ($17.3B), reducing concentration risk. CyberArk pivots mainly on SaaS ($469M) and Self Hosted Subscriptions ($265M), showing a tighter focus with potential dependency risks. Microsoft’s broad ecosystem lock-in contrasts CyberArk’s niche cybersecurity specialization.
Strengths and Weaknesses Comparison
This table compares the Strengths and Weaknesses of Microsoft and CyberArk based on diversification, profitability, financials, innovation, global presence, and market share:
Microsoft Strengths
- Highly diversified revenue streams across cloud, gaming, devices, and enterprise services
- Strong profitability metrics with net margin 36.15% and ROE 29.65%
- Favorable leverage ratios with low debt-to-assets at 9.79%
- Significant global presence with nearly equal revenue from US and international markets
- Robust innovation shown by diverse product segments and cloud services
CyberArk Strengths
- Favorable capital structure with very low debt-to-assets at 0.88%
- Positive valuation metric in PE despite negative earnings
- Favorable quick ratio of 1.48 indicating liquidity strength
- High fixed asset turnover of 51.11 suggests efficient asset use
- Growing SaaS and subscription revenue indicate innovation focus
Microsoft Weaknesses
- Unfavorable valuation multiples: PE at 36.31 and PB at 10.76 indicating premium pricing
- Asset turnover low at 0.46 signaling less efficient asset use
- Dividend yield low at 0.65% may deter income investors
- Some neutral liquidity ratios suggest caution in current assets management
CyberArk Weaknesses
- Negative profitability with net margin -9.34%, ROE -3.94%, and ROIC -2.85%
- Unfavorable interest coverage at -3.27 risks solvency
- Unfavorable PB at 6.21 and zero dividend yield
- Limited revenue scale and geographic reach compared to larger peers
Microsoft’s scale and diversified business model support strong profitability and global reach. CyberArk’s strengths lie in asset efficiency and liquidity but face profitability and valuation challenges. These factors shape each firm’s strategic priorities in market penetration and capital management.
The Moat Duel: Analyzing Competitive Defensibility
A structural moat is the only thing protecting long-term profits from the erosion of competition. Let’s examine how these two tech firms defend their turf:
Microsoft Corporation: Ecosystem Lock-In and Scale Advantage
Microsoft dominates through a vast ecosystem and switching costs embedded in its cloud and productivity software. Its 44.7% EBIT margin and 13.3% ROIC above WACC confirm strong value creation. Expansion in AI and cloud services could deepen this moat in 2026.
CyberArk Software Ltd.: Specialized Security Expertise
CyberArk relies on specialized intangible assets in cybersecurity, contrasting Microsoft’s broad ecosystem. However, its negative ROIC and shrinking margins signal value destruction. Growth in cloud entitlements management may offer upside but risks remain high given competitive pressures.
Verdict: Ecosystem Lock-In vs. Specialized Expertise
Microsoft’s wider, financially durable moat outmatches CyberArk’s fragile positioning. The tech giant’s scale and integration better defend market share amid intensifying competition. CyberArk faces significant hurdles to convert growth into sustainable profits.
Which stock offers better returns?
The past year revealed contrasting price dynamics: Microsoft showed moderate overall gains with recent weakness, while CyberArk surged strongly but also faced recent declines.
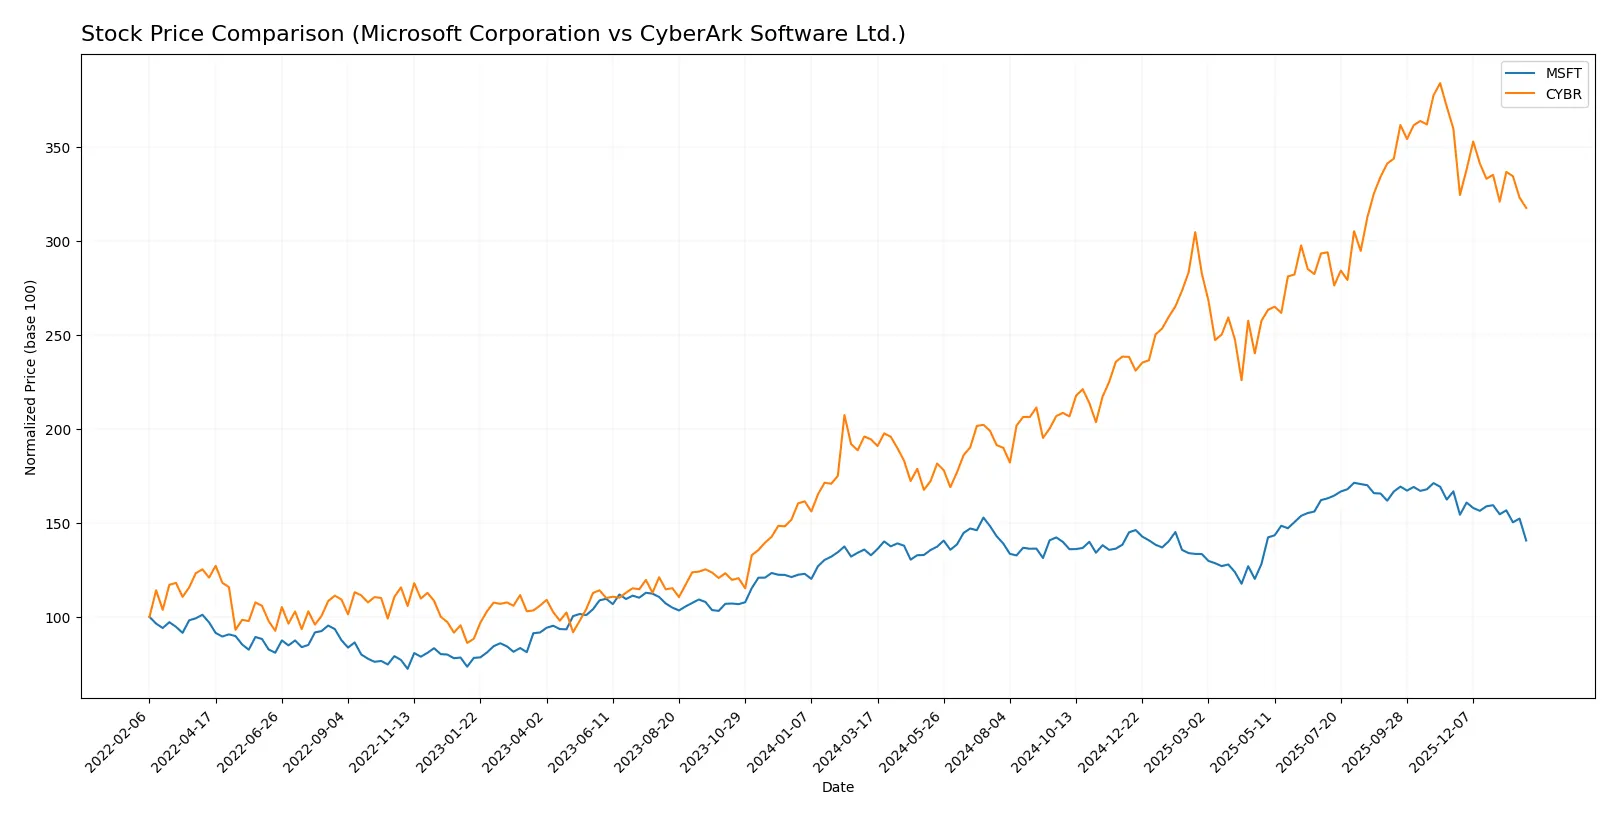
Trend Comparison
Microsoft’s stock rose 5.93% over 12 months, indicating a bullish but decelerating trend with a high of 524.11 and a low of 359.84. Recent months showed a 15.66% drop, signaling short-term pressure.
CyberArk gained 63.33% over the same period, a strong bullish trend despite deceleration and notable volatility. Recent decline of 11.7% reflects some correction after reaching a 520.78 peak.
CyberArk delivered the highest market performance, outperforming Microsoft significantly over the last year despite both stocks facing recent downward pressure.
Target Prices
Analysts set clear upside targets for both Microsoft Corporation and CyberArk Software Ltd.
| Company | Target Low | Target High | Consensus |
|---|---|---|---|
| Microsoft Corporation | 450 | 675 | 600.04 |
| CyberArk Software Ltd. | 455 | 520 | 486.2 |
The consensus target prices for Microsoft and CyberArk exceed their current prices by roughly 40% and 13%, respectively, signaling analysts’ confidence in growth potential despite present valuations.

Don’t Let Luck Decide Your Entry Point
Optimize your entry points with our advanced ProRealTime indicators. You’ll get efficient buy signals with precise price targets for maximum performance. Start outperforming now!
How do institutions grade them?
This section compares the latest institutional grades for Microsoft Corporation and CyberArk Software Ltd.:
Microsoft Corporation Grades
Below is a summary of recent institutional grades for Microsoft Corporation.
| Grading Company | Action | New Grade | Date |
|---|---|---|---|
| Citigroup | Maintain | Buy | 2026-01-30 |
| Wells Fargo | Maintain | Overweight | 2026-01-29 |
| Wedbush | Maintain | Outperform | 2026-01-29 |
| Scotiabank | Maintain | Sector Outperform | 2026-01-29 |
| RBC Capital | Maintain | Outperform | 2026-01-29 |
| Stifel | Maintain | Buy | 2026-01-29 |
| Evercore ISI Group | Maintain | Outperform | 2026-01-29 |
| Keybanc | Maintain | Overweight | 2026-01-29 |
| Piper Sandler | Maintain | Overweight | 2026-01-29 |
| Cantor Fitzgerald | Maintain | Overweight | 2026-01-29 |
CyberArk Software Ltd. Grades
The table below shows recent institutional grades for CyberArk Software Ltd.
| Grading Company | Action | New Grade | Date |
|---|---|---|---|
| Oppenheimer | Maintain | Outperform | 2024-10-22 |
| Keybanc | Maintain | Overweight | 2024-10-18 |
| Mizuho | Maintain | Outperform | 2024-10-17 |
| BTIG | Maintain | Buy | 2024-10-09 |
| Barclays | Maintain | Overweight | 2024-10-07 |
| Wedbush | Maintain | Outperform | 2024-10-01 |
| Jefferies | Maintain | Buy | 2024-09-24 |
| Wedbush | Maintain | Outperform | 2024-08-09 |
| Keybanc | Maintain | Overweight | 2024-08-09 |
| Cantor Fitzgerald | Maintain | Overweight | 2024-08-09 |
Which company has the best grades?
Microsoft consistently receives strong buy and outperform ratings from top-tier firms, reflecting broad institutional confidence. CyberArk also enjoys mostly outperform and buy grades, but its most recent ratings date back to 2024, potentially reducing their immediacy for investors.
Risks specific to each company
The following categories identify the critical pressure points and systemic threats facing both firms in the 2026 market environment:
1. Market & Competition
Microsoft Corporation
- Dominates cloud and productivity software with vast market share and diversified segments.
CyberArk Software Ltd.
- Faces intense competition in cybersecurity with niche focus and smaller scale.
2. Capital Structure & Debt
Microsoft Corporation
- Maintains low debt-to-equity (0.18) and strong interest coverage (52.84), indicating robust financial stability.
CyberArk Software Ltd.
- Very low debt (0.01 D/E) but negative interest coverage (-3.27) signals risk in meeting debt obligations.
3. Stock Volatility
Microsoft Corporation
- Beta near 1.07 suggests market-correlated volatility, stable for a tech giant.
CyberArk Software Ltd.
- Beta of 0.92 indicates slightly lower volatility but higher risk due to size and sector focus.
4. Regulatory & Legal
Microsoft Corporation
- Faces scrutiny on antitrust and privacy globally due to size and influence.
CyberArk Software Ltd.
- Subject to cybersecurity regulations, with risks from evolving compliance demands in multiple jurisdictions.
5. Supply Chain & Operations
Microsoft Corporation
- Complex global supply chain with diversified hardware and software operations, generally resilient.
CyberArk Software Ltd.
- Relies on SaaS delivery and cloud infrastructure; operational risks tied to cloud providers and service uptime.
6. ESG & Climate Transition
Microsoft Corporation
- Aggressive ESG commitments and investments in sustainability improve long-term resilience.
CyberArk Software Ltd.
- Emerging focus on ESG, with room to strengthen climate transition strategies.
7. Geopolitical Exposure
Microsoft Corporation
- Operates globally but exposed to U.S.-China tensions and international regulatory shifts.
CyberArk Software Ltd.
- Based in Israel, faces geopolitical risks in Middle East and international market access challenges.
Which company shows a better risk-adjusted profile?
Microsoft’s dominant market position, strong capital structure, and robust financial health create a superior risk-adjusted profile. CyberArk’s key risk centers on its negative profitability and weaker financial metrics, heightening operational and financial risks. Microsoft’s Altman Z-score of 9.7 versus CyberArk’s 6.4 underscores its safer zone status. CyberArk’s negative net margin (-9.3%) versus Microsoft’s 36.1% is a clear red flag for investors prioritizing stability.
Final Verdict: Which stock to choose?
Microsoft Corporation’s superpower lies in its unmatched ability to generate consistent and robust returns on invested capital, creating long-term value despite a slight decline in profitability. Its moderate liquidity and premium valuation warrant vigilance. It fits best within a portfolio seeking stable, large-cap growth with strong financial discipline.
CyberArk Software’s strategic moat is its niche cybersecurity expertise, supported by strong recurring revenue streams. However, it currently struggles with profitability and value creation, reflecting higher operational risks compared to Microsoft. It suits investors with a higher risk tolerance aiming for aggressive growth in emerging tech sectors.
If you prioritize durable value creation and financial stability, Microsoft outshines CyberArk with its proven capital efficiency and scale. However, if you seek high-growth potential and can tolerate volatility, CyberArk offers a compelling scenario for speculative growth investors willing to accept operational headwinds.
Disclaimer: Investment carries a risk of loss of initial capital. The past performance is not a reliable indicator of future results. Be sure to understand risks before making an investment decision.
Go Further
I encourage you to read the complete analyses of Microsoft Corporation and CyberArk Software Ltd. to enhance your investment decisions: