Home > Comparison > Technology > MSFT vs CPAY
The strategic rivalry between Microsoft Corporation and Corpay, Inc. shapes the evolution of the technology sector. Microsoft, a diversified software infrastructure titan, integrates cloud, productivity, and personal computing solutions. Corpay, a specialized payments software provider, focuses on corporate and vehicle expense management. This analysis pits broad market leadership against niche specialization, seeking which trajectory offers superior risk-adjusted returns for a diversified portfolio.
Table of contents
Companies Overview
Microsoft Corporation and Corpay, Inc. stand as pivotal players in the software infrastructure market with distinct operational scopes.
Microsoft Corporation: Global Software Infrastructure Titan
Microsoft dominates as a technology giant primarily generating revenue through its diversified software and cloud services. Its core engines include Productivity and Business Processes, Intelligent Cloud, and More Personal Computing segments. In 2026, Microsoft’s strategic focus centers on expanding Azure cloud capabilities and integrating AI to enhance enterprise solutions and maintain its vast ecosystem.
Corpay, Inc.: Specialized Payments Innovator
Corpay operates as a payments technology company focused on managing vehicle-related and corporate expenses globally. It earns revenue through vehicle payment solutions and corporate payment automation, emphasizing prepaid cards and lodging payments. In 2026, Corpay’s strategy prioritizes cross-border payment solutions and expanding virtual card offerings for business clients to streamline expense management internationally.
Strategic Collision: Similarities & Divergences
Both firms operate within the software infrastructure industry but diverge sharply in business philosophy. Microsoft pursues a broad, integrated ecosystem spanning cloud, productivity, and personal computing, while Corpay specializes in niche payments infrastructure. Their primary battleground lies in corporate financial technology adoption. Microsoft presents a diversified, scale-driven investment profile; Corpay offers a focused growth story in specialized payment services.
Income Statement Comparison
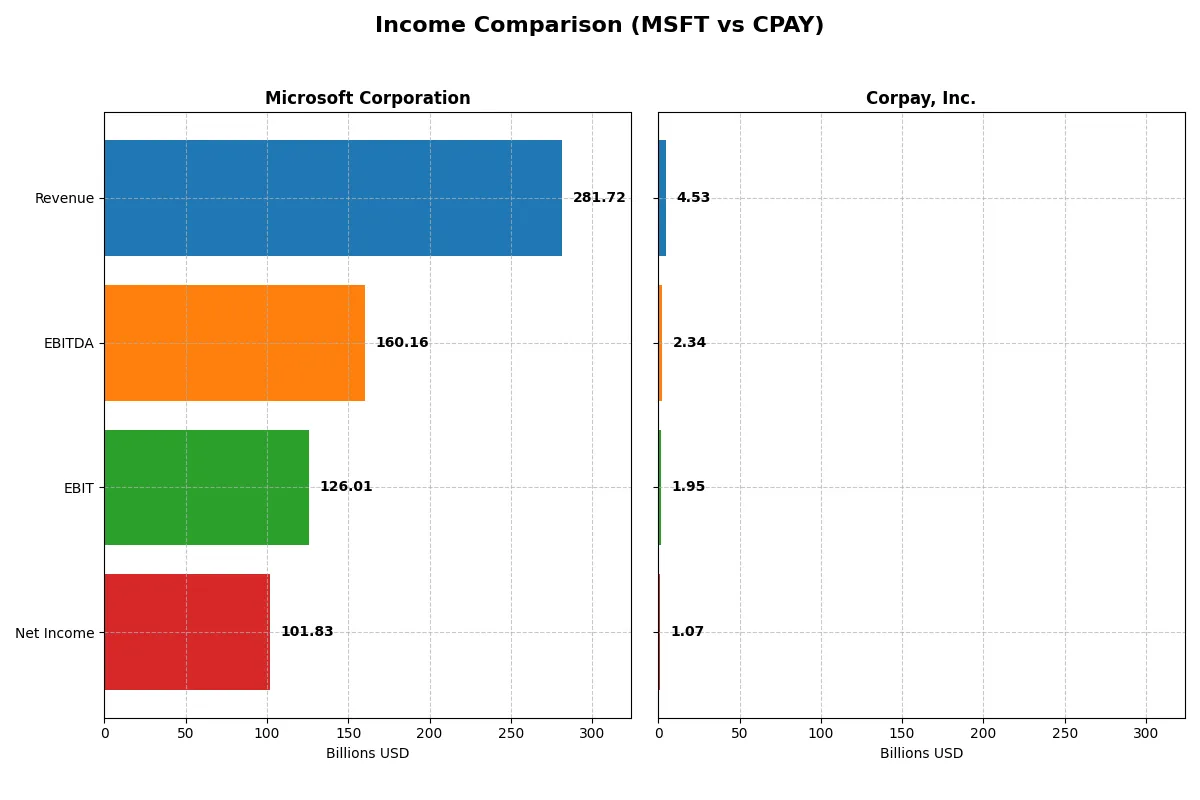
This data dissects the core profitability and scalability of both corporate engines to reveal who dominates the bottom line:
| Metric | Microsoft Corporation (MSFT) | Corpay, Inc. (CPAY) |
|---|---|---|
| Revenue | 282B | 4.53B |
| Cost of Revenue | 87.8B | 1.36B |
| Operating Expenses | 65.4B | 1.21B |
| Gross Profit | 194B | 3.17B |
| EBITDA | 160B | 2.34B |
| EBIT | 126B | 1.95B |
| Interest Expense | 2.39B | 404M |
| Net Income | 102B | 1.07B |
| EPS | 13.7 | 15.25 |
| Fiscal Year | 2025 | 2025 |
Income Statement Analysis: The Bottom-Line Duel
This comparison reveals how Microsoft Corporation and Corpay, Inc. convert revenue into profit, highlighting each firm’s operational strength and margin efficiency.
Microsoft Corporation Analysis
Microsoft’s revenue surged from 168B in 2021 to 282B in 2025, with net income growing from 61B to 102B. Its gross margin remains robust near 69%, and net margin holds a solid 36%, reflecting excellent cost control. In 2025, Microsoft demonstrates strong momentum with a 14.9% revenue increase and a stable net margin, signaling efficient scale expansion.
Corpay, Inc. Analysis
Corpay’s revenue increased steadily from 2.8B in 2021 to 4.5B in 2025, with net income rising from 840M to 1.07B. The company maintains a healthy gross margin around 70%, though its net margin at 24% lags Microsoft. Despite solid revenue growth of 13.9% in the last year, Corpay faces pressure on net margin, down 6.5%, indicating rising expense challenges.
Margin Dominance vs. Growth Resilience
Microsoft clearly leads with superior net margin and profitability growth, delivering a scalable and efficient business model. Corpay shows commendable revenue growth but weaker margin stability. Investors seeking a powerhouse with consistent earnings favor Microsoft; those focused on growth in a smaller niche might watch Corpay’s evolving margin profile.
Financial Ratios Comparison
These vital ratios act as a diagnostic tool to expose the underlying fiscal health, valuation premiums, and capital efficiency of the companies compared below:
| Ratios | Microsoft Corporation (MSFT) | Corpay, Inc. (CPAY) |
|---|---|---|
| ROE | 29.6% | 27.5% |
| ROIC | 22.0% | 8.8% |
| P/E | 36.3 | 19.7 |
| P/B | 10.8 | 5.4 |
| Current Ratio | 1.35 | 0.98 |
| Quick Ratio | 1.35 | 0.98 |
| D/E | 0.18 | 2.58 |
| Debt-to-Assets | 9.8% | 37.9% |
| Interest Coverage | 53.9 | 4.8 |
| Asset Turnover | 0.46 | 0.17 |
| Fixed Asset Turnover | 1.23 | 9.59 |
| Payout Ratio | 23.6% | 0% |
| Dividend Yield | 0.65% | 0% |
| Fiscal Year | 2025 | 2025 |
Efficiency & Valuation Duel: The Vital Signs
Financial ratios act as a company’s DNA, exposing hidden risks and revealing operational excellence critical to investment decisions.
Microsoft Corporation
Microsoft demonstrates strong core profitability with a favorable ROE of 29.65% and a net margin of 36.15%. However, its valuation appears stretched, shown by an elevated P/E of 36.31 and P/B of 10.76. The company maintains shareholder returns via a modest 0.65% dividend yield while reinvesting heavily in R&D, supporting sustained growth.
Corpay, Inc.
Corpay posts a solid ROE of 27.55% and a net margin of 23.62%, reflecting efficient operations. Its P/E of 19.73 is moderate, suggesting a more reasonable valuation relative to Microsoft. Corpay does not pay dividends but focuses on growth reinvestment, although a low current ratio of 0.98 signals liquidity concerns that warrant caution.
Premium Valuation vs. Operational Safety
Microsoft commands a premium valuation backed by superior profitability and robust capital allocation. Corpay offers a more affordable entry but carries higher financial risk due to its leverage and liquidity profile. Investors prioritizing operational safety may prefer Microsoft, while those seeking value with growth potential might explore Corpay cautiously.
Which one offers the Superior Shareholder Reward?
I observe Microsoft delivers consistent dividends with a 0.65% yield and a 24% payout ratio, supported by solid free cash flow coverage above 1.5x. Corpay pays no dividend but reinvests heavily in growth, with a robust buyback program implied by strong free cash flow ratios near 0.9. Microsoft’s balanced dividend and buyback mix offers sustainable shareholder rewards. Corpay’s aggressive reinvestment suits growth investors but carries higher leverage risk. For 2026, I favor Microsoft for superior total return due to its proven distribution discipline and lower financial risk.
Comparative Score Analysis: The Strategic Profile
The radar chart reveals the fundamental DNA and trade-offs of Microsoft Corporation and Corpay, Inc., highlighting their financial strengths and vulnerabilities:
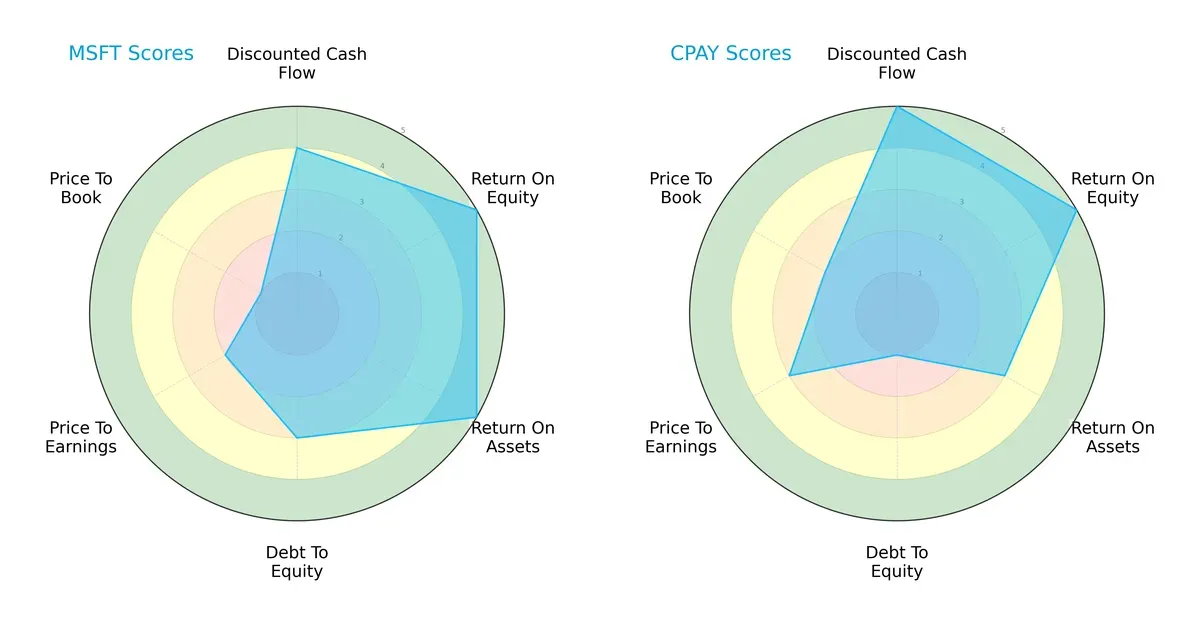
Microsoft shows a balanced profile with strong ROE (5) and ROA (5) scores, but moderate debt management (3) and weak valuation scores (PE 2, PB 1). Corpay excels in discounted cash flow (5) and ROE (5) but suffers from heavy leverage (debt/equity 1) and less efficient asset use (ROA 3). Microsoft leverages operational efficiency, while Corpay relies on cash flow strength but carries significant financial risk.
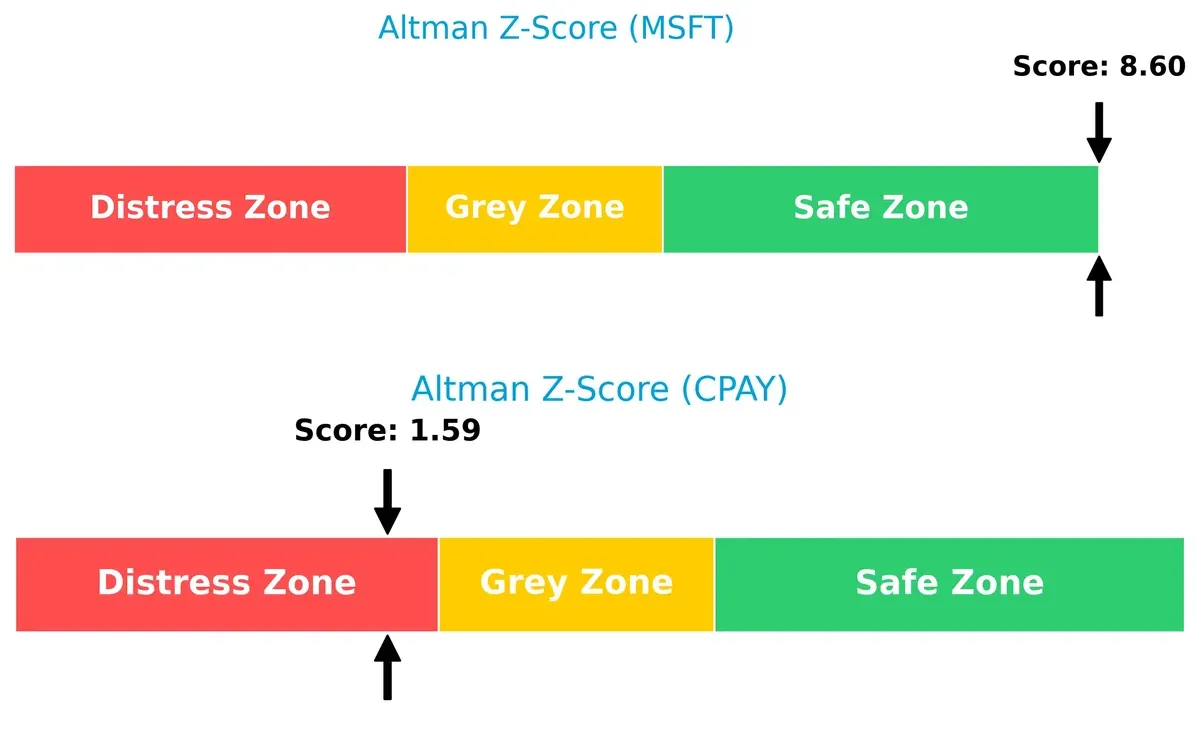
Bankruptcy Risk: Solvency Showdown
Microsoft’s Altman Z-Score of 8.6 places it firmly in the safe zone, signaling robust long-term survival. Corpay’s 1.6 score warns of distress and heightened bankruptcy risk in this cycle:
Financial Health: Quality of Operations
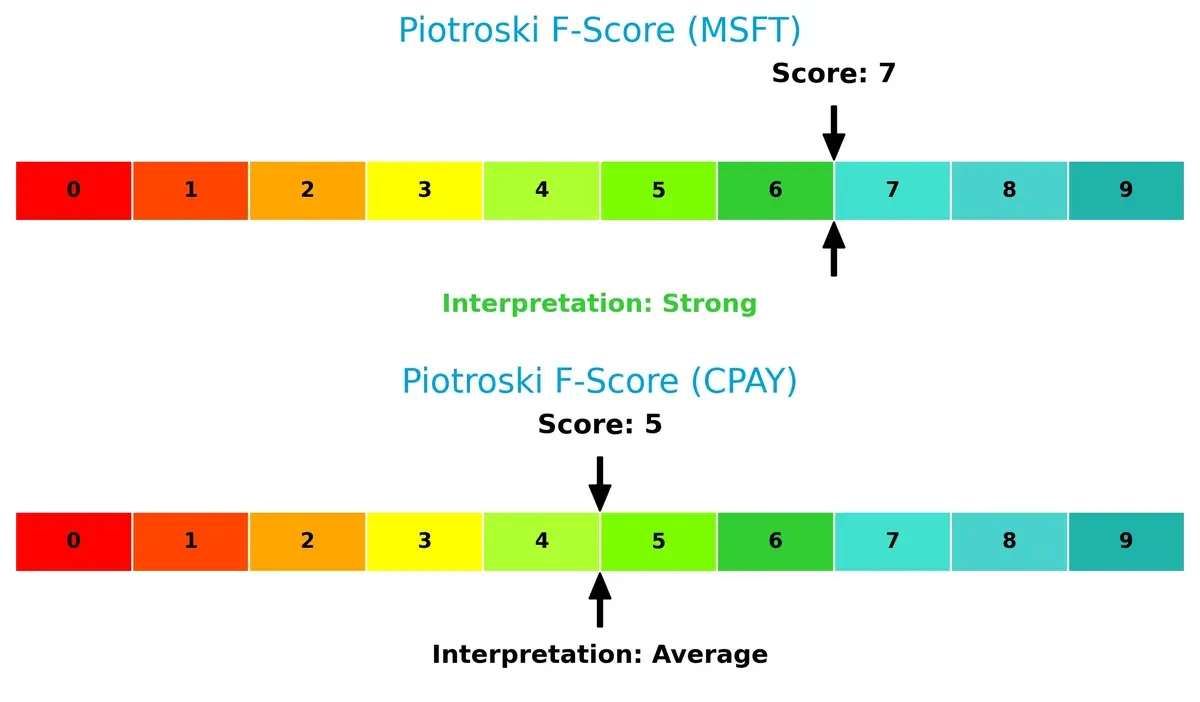
Microsoft’s Piotroski F-Score of 7 indicates strong financial health with few red flags. Corpay’s score of 5 suggests average operational quality and potential internal weaknesses compared to Microsoft:
How are the two companies positioned?
This section dissects Microsoft and Corpay’s operational DNA through their revenue segmentation and internal dynamics. The goal is to confront their economic moats and reveal which model holds a more resilient, sustainable competitive advantage today.
Revenue Segmentation: The Strategic Mix
This visual comparison dissects how Microsoft Corporation and Corpay, Inc. diversify their income streams and where their primary sector bets lie:
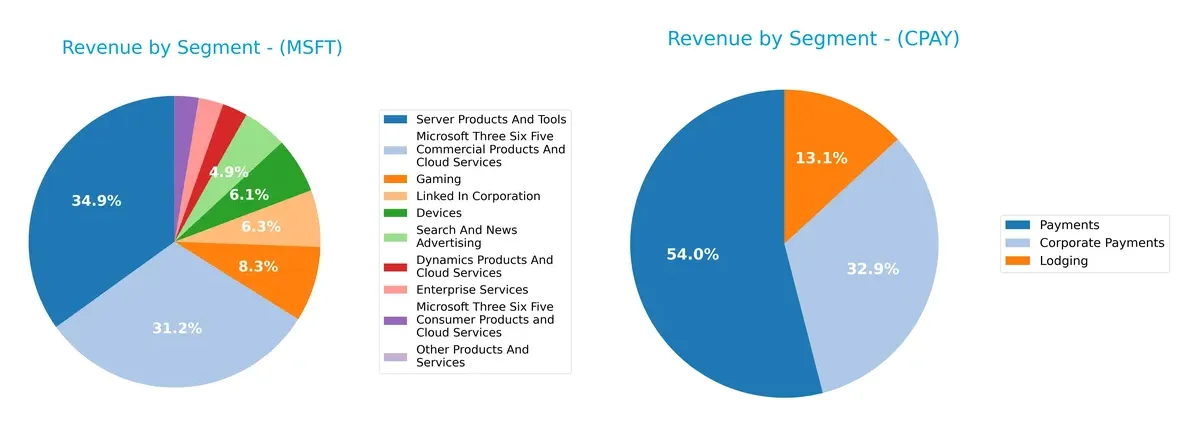
Microsoft dominates with a broad portfolio spanning Server Products & Tools at $98.4B and Microsoft 365 Commercial at $87.8B, showing deep ecosystem lock-in. Corpay, by contrast, anchors 62% of its $3.7B revenue in Payments, reflecting concentration risk but strong niche focus. Microsoft’s diversification mitigates cyclicality, while Corpay’s reliance on few segments demands vigilance on sector shifts.
Strengths and Weaknesses Comparison
This table compares the strengths and weaknesses of Microsoft and Corpay based on diversification, profitability, financials, innovation, global presence, and market share:
Microsoft Strengths
- Highly diversified product lines across cloud, gaming, office, and devices
- Strong global presence with nearly equal US and non-US revenues
- Very favorable profitability ratios (net margin 36%, ROE 30%, ROIC 22%)
- Low debt levels and excellent interest coverage
- Established market share in enterprise services and cloud
- Innovation in cloud services and software platforms
Corpay Strengths
- Focused product segments in corporate payments and lodging
- Favorable net margin (24%) and ROE (28%)
- Low WACC at 6.26% supports capital efficiency
- Strong fixed asset turnover indicating efficient asset use
- Clear geographic revenue exposure including US, UK, Brazil
- Market presence concentrated in payment services
Microsoft Weaknesses
- Elevated valuation multiples (PE 36, PB 11) may pressure returns
- Asset turnover low at 0.46, indicating capital intensity
- Dividend yield low at 0.65%
- Some neutral liquidity ratios (current ratio 1.35)
- Complexity of operations may challenge agility
Corpay Weaknesses
- Current ratio below 1.0 signals potential liquidity risk
- High debt-to-equity ratio (2.58) and moderate interest coverage
- ROIC only neutral at 8.78%, close to WACC
- Asset turnover low at 0.17, despite strong fixed asset turnover
- No dividend yield, limiting income appeal
- Concentrated product and geographic exposure limits diversification
Microsoft demonstrates broad diversification, strong profitability, and global scale, but faces valuation and capital efficiency challenges. Corpay shows focused niche strength with solid profitability and asset efficiency, yet carries liquidity and leverage risks alongside limited diversification. These factors shape each company’s strategic flexibility and risk profile.
The Moat Duel: Analyzing Competitive Defensibility
A structural moat protects long-term profits from relentless competition erosion. Without it, market share and margins inevitably erode:
Microsoft Corporation: Ecosystem Lock-in with Intangible Assets
Microsoft’s moat stems from deep intangible assets and an entrenched ecosystem. Its 44.7% EBIT margin reflects this durable advantage. Expansion in AI cloud services could further widen the moat in 2026.
Corpay, Inc.: Cost Advantage in Niche Payments
Corpay’s cost advantage in vehicle and corporate payments contrasts Microsoft’s broad ecosystem. It delivers solid 43.1% EBIT margins but faces margin pressure. Scaling cross-border solutions may deepen its moat but risks remain.
Moat Strength Showdown: Ecosystem vs. Cost Efficiency
Microsoft’s wider moat benefits from a sprawling ecosystem and high-margin software dominance. Corpay’s moat is narrower, relying on operational cost advantages in specialized markets. Microsoft stands better poised to defend and expand market share.
Which stock offers better returns?
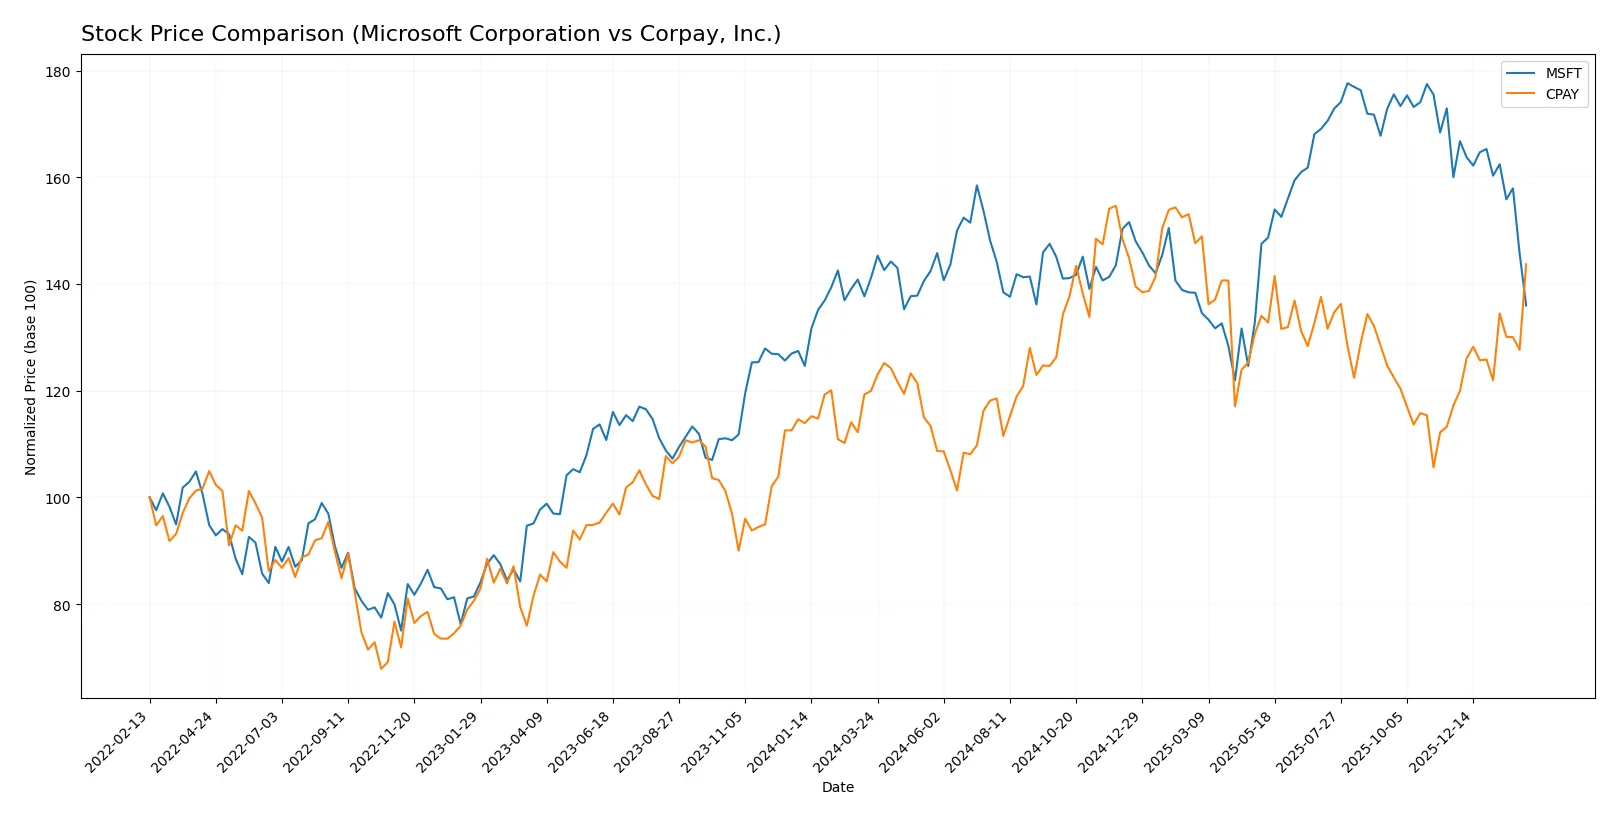
Stock price movements over the past 12 months reveal contrasting trajectories, with one stock showing steady gains and the other experiencing a notable decline and deceleration in momentum.
Trend Comparison
Microsoft’s stock declined 3.67% over the past year, marking a bearish trend with decelerating losses. It hit a high of 524.11 and a low of 359.84, reflecting significant volatility (std dev 41.98).
Corpay’s stock rose 19.8% in the same period, showing a bullish trend with accelerating gains. It recorded a high of 381.18 and a low of 249.66, with moderate volatility (std dev 31.25).
Corpay delivered the highest market performance, outperforming Microsoft’s bearish trend by a wide margin over the last 12 months.
Target Prices
Analysts present a bullish target price consensus for both Microsoft Corporation and Corpay, Inc.
| Company | Target Low | Target High | Consensus |
|---|---|---|---|
| Microsoft Corporation | 392 | 675 | 593.88 |
| Corpay, Inc. | 300 | 390 | 359.33 |
The consensus target for Microsoft is roughly 48% above its current price of 401.14, signaling strong expected upside. Corpay’s consensus target sits just above its current price of 354.19, reflecting moderate growth expectations.

Don’t Let Luck Decide Your Entry Point
Optimize your entry points with our advanced ProRealTime indicators. You’ll get efficient buy signals with precise price targets for maximum performance. Start outperforming now!
How do institutions grade them?
The following tables summarize recent institutional grades for Microsoft Corporation and Corpay, Inc.:
Microsoft Corporation Grades
Below is a summary of recent grades from established financial institutions for Microsoft:
| Grading Company | Action | New Grade | Date |
|---|---|---|---|
| Stifel | Downgrade | Hold | 2026-02-05 |
| Citigroup | Maintain | Buy | 2026-01-30 |
| Stifel | Maintain | Buy | 2026-01-29 |
| Wedbush | Maintain | Outperform | 2026-01-29 |
| Evercore ISI Group | Maintain | Outperform | 2026-01-29 |
| RBC Capital | Maintain | Outperform | 2026-01-29 |
| Piper Sandler | Maintain | Overweight | 2026-01-29 |
| Scotiabank | Maintain | Sector Outperform | 2026-01-29 |
| DA Davidson | Maintain | Buy | 2026-01-29 |
| Keybanc | Maintain | Overweight | 2026-01-29 |
Corpay, Inc. Grades
The following table presents recent grades from recognized grading firms for Corpay, Inc.:
| Grading Company | Action | New Grade | Date |
|---|---|---|---|
| Mizuho | Maintain | Neutral | 2026-02-06 |
| JP Morgan | Maintain | Overweight | 2026-02-05 |
| RBC Capital | Maintain | Sector Perform | 2026-02-05 |
| Morgan Stanley | Maintain | Overweight | 2026-02-05 |
| Morgan Stanley | Upgrade | Overweight | 2026-01-26 |
| Oppenheimer | Maintain | Outperform | 2026-01-12 |
| Oppenheimer | Upgrade | Outperform | 2025-12-05 |
| UBS | Maintain | Neutral | 2025-11-06 |
| RBC Capital | Maintain | Sector Perform | 2025-11-06 |
| JP Morgan | Maintain | Overweight | 2025-11-06 |
Which company has the best grades?
Microsoft holds predominantly “Outperform” and “Buy” ratings, reflecting strong institutional confidence. Corpay shows mainly “Overweight” and “Outperform” grades but also includes several “Neutral” ratings, indicating slightly less consensus. Investors may view Microsoft’s higher grades as a sign of stronger market endorsement.
Risks specific to each company
The following categories identify the critical pressure points and systemic threats facing both firms in the 2026 market environment:
1. Market & Competition
Microsoft Corporation
- Dominates software infrastructure with broad cloud and productivity platforms, facing intense competition but strong moats.
Corpay, Inc.
- Focused on payment solutions with niche markets, but exposed to fintech disruptors and evolving customer needs.
2. Capital Structure & Debt
Microsoft Corporation
- Maintains low debt-to-equity (0.18) and strong interest coverage, indicating financial resilience.
Corpay, Inc.
- High debt-to-equity (2.58) signals leverage risk; interest coverage is moderate, raising refinancing concerns.
3. Stock Volatility
Microsoft Corporation
- Beta at 1.08 suggests market-level volatility; large market cap smooths shocks.
Corpay, Inc.
- Lower beta (0.81) implies less volatility, but smaller market cap can increase price swings.
4. Regulatory & Legal
Microsoft Corporation
- Faces regulatory scrutiny over data privacy and antitrust, heightened by global operations.
Corpay, Inc.
- Subject to financial regulations across multiple jurisdictions, with compliance complexity and legal risks.
5. Supply Chain & Operations
Microsoft Corporation
- Complex hardware and cloud services supply chains vulnerable to chip shortages and geopolitical tensions.
Corpay, Inc.
- Relies on payment networks and service providers; operational risk tied to partner stability and technology upgrades.
6. ESG & Climate Transition
Microsoft Corporation
- Commits to carbon neutrality and sustainable tech; ESG factors enhance brand and investor trust.
Corpay, Inc.
- ESG disclosures less mature; climate transition risks could affect operational costs and client relations.
7. Geopolitical Exposure
Microsoft Corporation
- Global footprint exposes it to US-China tensions, data sovereignty laws, and trade restrictions.
Corpay, Inc.
- Operations in US, Brazil, UK expose it to regional political risks and currency volatility.
Which company shows a better risk-adjusted profile?
Microsoft’s dominant market position, robust capital structure, and superior Altman Z-score (8.6, safe zone) confer a stronger risk-adjusted profile. Corpay’s elevated leverage, weaker liquidity (current ratio 0.98), and distress-zone Altman Z-score (1.59) increase financial vulnerability. The most impactful risk for Microsoft is regulatory pressure amid global expansion. For Corpay, debt burden and liquidity constraints pose critical threats. Microsoft’s scale and financial strength justify greater investor confidence despite sector competition.
Final Verdict: Which stock to choose?
Microsoft Corporation’s superpower lies in its unrivaled ability to generate robust free cash flow and deliver consistent high returns on invested capital. Its point of vigilance is a lofty valuation that may temper near-term upside. It fits well in portfolios seeking steady, long-term growth anchored by a tech giant.
Corpay, Inc. stands out for its strategic moat rooted in accelerating revenue growth and improving free cash flow yield, coupled with a lower valuation multiple. However, its elevated leverage and weaker liquidity call for caution. It suits investors targeting growth at a reasonable price with a tolerance for higher risk.
If you prioritize durable capital efficiency and global scale, Microsoft outshines with its cash-generative model and financial fortress, despite valuation premiums. However, if you seek accelerated growth with a value tilt and can endure balance sheet risk, Corpay offers superior price momentum and upside potential. Each stock aligns with distinct investor profiles and risk appetites.
Disclaimer: Investment carries a risk of loss of initial capital. The past performance is not a reliable indicator of future results. Be sure to understand risks before making an investment decision.
Go Further
I encourage you to read the complete analyses of Microsoft Corporation and Corpay, Inc. to enhance your investment decisions: