Home > Comparison > Technology > MSFT vs CRWV
The strategic rivalry between Microsoft Corporation and CoreWeave, Inc. shapes the evolving landscape of technology infrastructure. Microsoft, a diversified tech giant, combines cloud, software, and personal computing, while CoreWeave focuses narrowly on high-performance cloud solutions for AI workloads. This analysis pits Microsoft’s scale and diversification against CoreWeave’s specialized growth. I will determine which trajectory offers superior risk-adjusted returns for a forward-looking, diversified portfolio in the technology sector.
Table of contents
Companies Overview
Microsoft Corporation and CoreWeave, Inc. both hold significant stakes in the software infrastructure market, shaping cloud computing and AI services.
Microsoft Corporation: Global Software Infrastructure Powerhouse
Microsoft dominates software infrastructure by licensing and supporting a broad portfolio of products. Its core revenue stems from cloud services, productivity software, and operating systems. In 2026, Microsoft’s strategic focus centers on expanding its Intelligent Cloud segment, emphasizing Azure’s growth and AI integration, which sustain its vast ecosystem and robust competitive moat.
CoreWeave, Inc.: Emerging Cloud Infrastructure Specialist
CoreWeave targets cloud infrastructure with a specialized focus on GenAI compute workloads. It generates revenue through GPU and CPU compute, storage, and managed services tailored for AI training and rendering. In 2026, CoreWeave prioritizes scaling its platform capabilities and enhancing AI lifecycle management to capture niche demand in high-performance cloud computing.
Strategic Collision: Similarities & Divergences
Both companies operate in software infrastructure but diverge sharply in scale and scope. Microsoft leverages a vast, diversified ecosystem emphasizing cloud and productivity software, while CoreWeave concentrates on specialized AI infrastructure. Their primary battleground lies in cloud computing, yet they appeal to different enterprise needs. This creates distinct investment profiles: Microsoft offers stability and scale; CoreWeave presents high growth potential with elevated volatility.
Income Statement Comparison
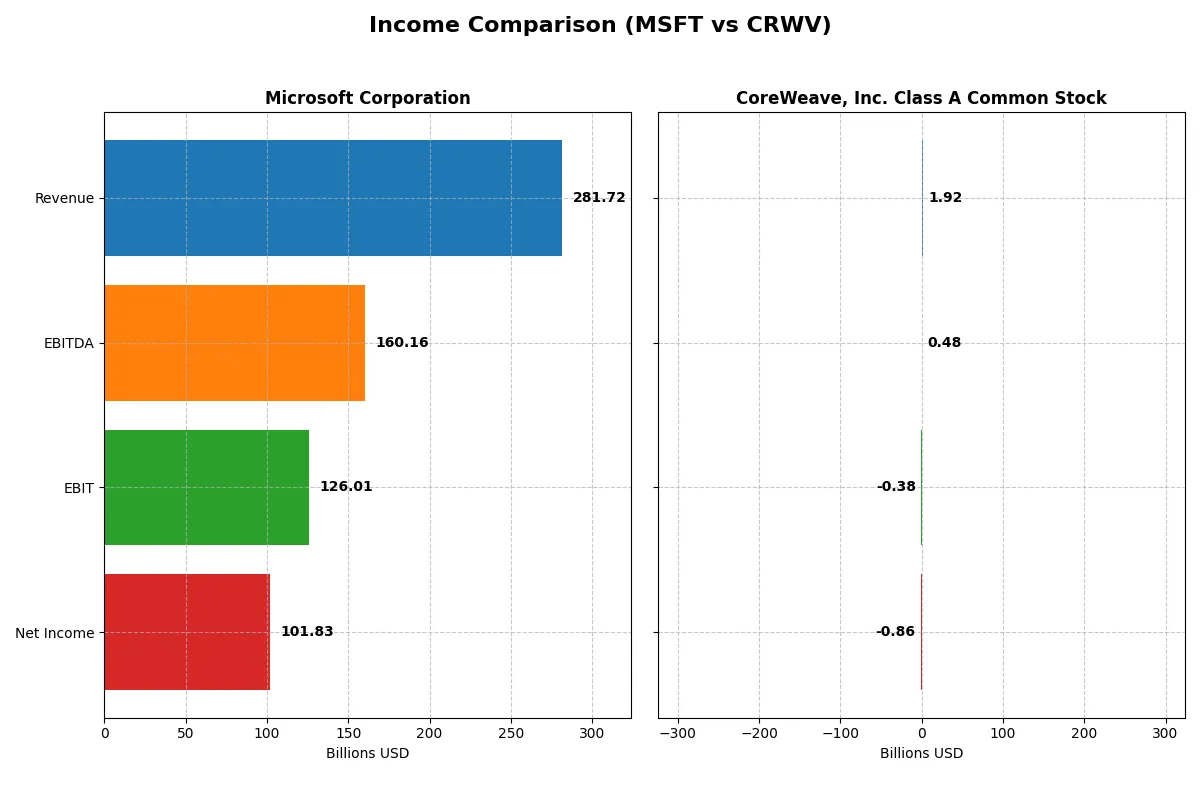
This data dissects the core profitability and scalability of both corporate engines to reveal who dominates the bottom line:
| Metric | Microsoft Corporation (MSFT) | CoreWeave, Inc. Class A Common Stock (CRWV) |
|---|---|---|
| Revenue | 282B | 1.9B |
| Cost of Revenue | 87.8B | 493M |
| Operating Expenses | 65.4B | 1.1B |
| Gross Profit | 194B | 1.4B |
| EBITDA | 160B | 480M |
| EBIT | 126B | -383M |
| Interest Expense | 2.39B | 361M |
| Net Income | 101.8B | -937.8M |
| EPS | 13.7 | -2.33 |
| Fiscal Year | 2025 | 2024 |
Income Statement Analysis: The Bottom-Line Duel
This income statement comparison reveals how efficiently each company converts revenue into profit, exposing the true strength of their corporate engines.
Microsoft Corporation Analysis
Microsoft’s revenue surged from 168B in 2021 to 282B in 2025, showing robust growth momentum. Net income climbed steadily to 102B in 2025, reflecting strong profitability. Gross margin remains healthy near 69%, while net margin exceeds 36%, signaling disciplined cost control and operational efficiency. The 2025 fiscal year highlights a powerful scale and consistent margin expansion.
CoreWeave, Inc. Class A Common Stock Analysis
CoreWeave exhibits explosive revenue growth, jumping from 16M in 2022 to nearly 1.9B in 2024. Despite this, the company posted net losses exceeding 860M in 2024, with a negative net margin of -45%. Gross margin is strong at 74%, but high interest expenses and operating losses erode profitability. The latest year shows operational challenges amid rapid expansion, pressuring bottom-line results.
Margin Stability vs. Growth Volatility
Microsoft clearly leads with sustainable profitability, combining impressive revenue gains with stable, high margins. CoreWeave’s extraordinary revenue growth comes at a steep cost, reflected in persistent net losses and poor margin metrics. For investors prioritizing reliability and efficiency, Microsoft’s profile offers a proven, disciplined earnings engine over CoreWeave’s high-risk growth trajectory.
Financial Ratios Comparison
These vital ratios act as a diagnostic tool to expose the underlying fiscal health, valuation premiums, and capital efficiency of the companies compared below:
| Ratios | Microsoft Corporation (MSFT) | CoreWeave, Inc. Class A Common Stock (CRWV) |
|---|---|---|
| ROE | 29.6% | 208.8% |
| ROIC | 22.0% | 2.1% |
| P/E | 36.3 | -18.7 |
| P/B | 10.8 | -39.1 |
| Current Ratio | 1.35 | 0.39 |
| Quick Ratio | 1.35 | 0.39 |
| D/E | 0.18 | -25.7 |
| Debt-to-Assets | 9.8% | 59.6% |
| Interest Coverage | 53.9 | 0.9 |
| Asset Turnover | 0.46 | 0.11 |
| Fixed Asset Turnover | 1.23 | 0.13 |
| Payout ratio | 23.6% | -6.7% |
| Dividend yield | 0.65% | 0.36% |
| Fiscal Year | 2025 | 2024 |
Efficiency & Valuation Duel: The Vital Signs
Financial ratios act as the DNA of a company, unveiling hidden risks and operational strengths that shape its market performance.
Microsoft Corporation
Microsoft displays robust profitability with a 29.65% ROE and a strong 36.15% net margin, reflecting operational efficiency. However, its valuation appears stretched, with a P/E of 36.31 and a high P/B of 10.76. The company returns value through modest dividends (0.65% yield) while heavily investing in R&D (11.5% of revenue) to sustain growth.
CoreWeave, Inc. Class A Common Stock
CoreWeave’s profitability metrics tell a mixed story: a high ROE of 208.77% contrasts with a deeply negative net margin (-45.08%), suggesting volatile earnings quality. Valuation ratios like P/E and P/B are negative but marked favorable due to losses, while liquidity challenges are evident from a low current ratio of 0.39. The company does not pay dividends, likely prioritizing reinvestment amid weak free cash flow.
Premium Valuation vs. Operational Struggles
Microsoft balances strong profitability against a premium valuation, reflecting market confidence but limited margin for error. CoreWeave faces significant operational and liquidity risks despite eye-catching ROE, signaling a speculative profile. Investors seeking steady returns may favor Microsoft’s stability, while risk-tolerant profiles might consider CoreWeave’s growth potential.
Which one offers the Superior Shareholder Reward?
I see Microsoft delivers a classic shareholder reward model with a 0.65% dividend yield and a conservative 24% payout ratio, well covered by robust free cash flow of 9.6B. Its buybacks are substantial, enhancing total return sustainably. CoreWeave pays a minimal 0.36% dividend but suffers negative free cash flow (-14.7B) and heavy debt (60% assets), indicating unsustainable payouts. CoreWeave’s reinvestment focus on growth is clear but risky given its operating losses and weak coverage ratios. Historically, Microsoft’s balanced capital allocation between dividends and buybacks offers superior, reliable shareholder returns in 2026.
Comparative Score Analysis: The Strategic Profile
The radar chart reveals the fundamental DNA and trade-offs of Microsoft Corporation and CoreWeave, Inc. Class A Common Stock, highlighting their distinct financial strengths and weaknesses:
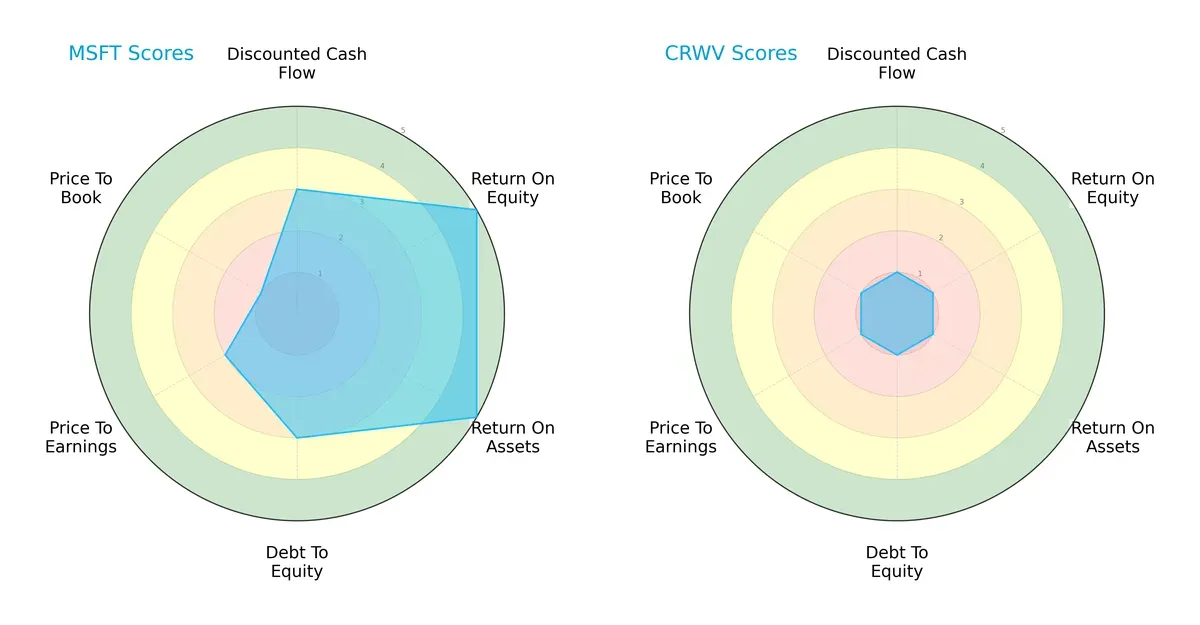
Microsoft shows a balanced profile with very favorable returns on equity (5) and assets (5), and moderate debt management (3). However, it carries valuation risks with low price-to-book scores (1). CoreWeave struggles across all metrics, scoring very unfavorable on DCF, profitability, leverage, and valuation, reflecting a heavy reliance on a weak financial footing rather than a competitive edge.
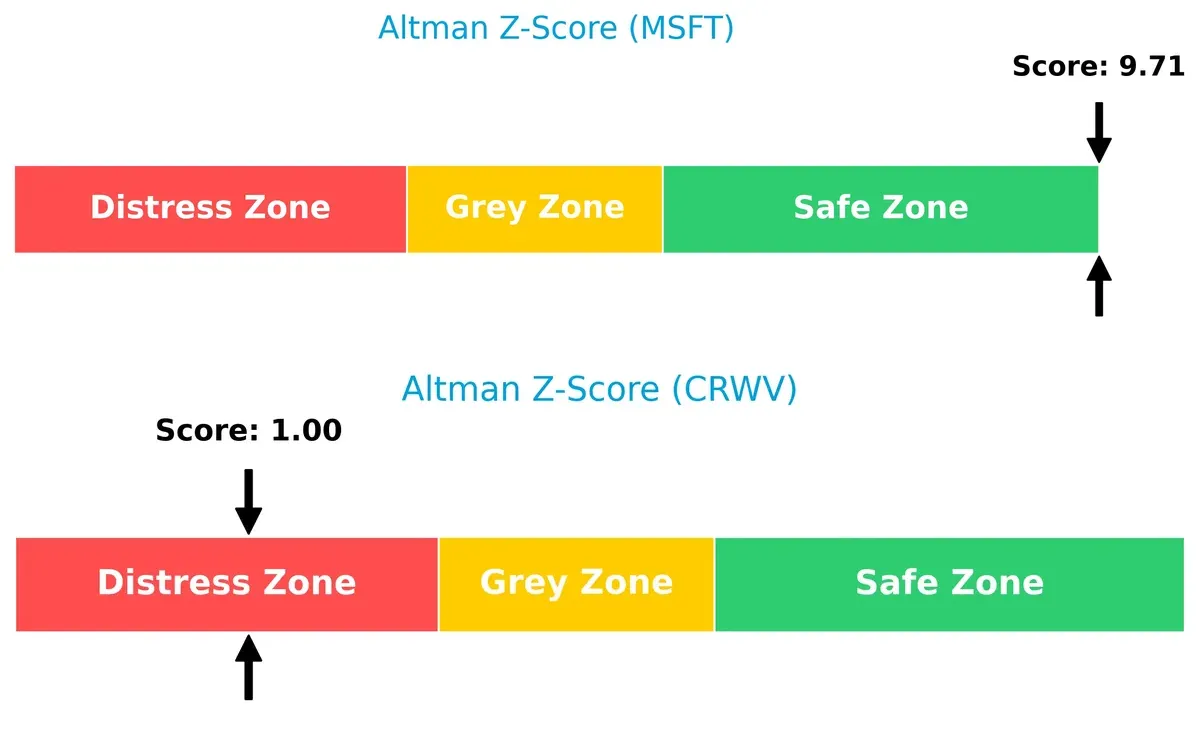
Bankruptcy Risk: Solvency Showdown
Microsoft’s Altman Z-Score of 9.7 places it firmly in the safe zone, signaling strong solvency and low bankruptcy risk. CoreWeave’s score of 1.0 flags it in the distress zone, indicating a high probability of financial distress in this cycle:
Financial Health: Quality of Operations
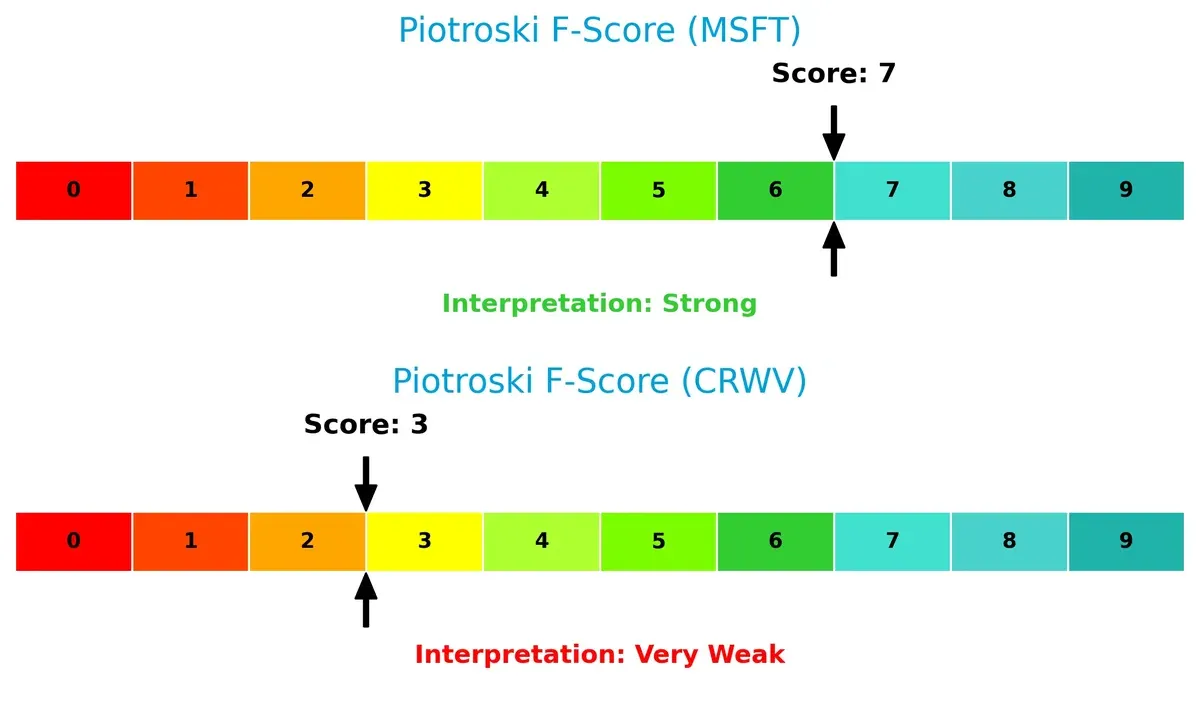
Microsoft’s Piotroski F-Score of 7 signals robust financial health with strong operational quality. CoreWeave’s score of 3 suggests internal weaknesses and red flags in profitability and leverage metrics:
How are the two companies positioned?
This section dissects the operational DNA of Microsoft and CoreWeave by comparing their revenue distribution by segment alongside their internal strengths and weaknesses. The goal is to confront their economic moats and identify which business model offers the most resilient, sustainable competitive advantage in today’s market.
Revenue Segmentation: The Strategic Mix
The following visual comparison dissects how Microsoft Corporation and CoreWeave, Inc. diversify their income streams and where their primary sector bets lie:
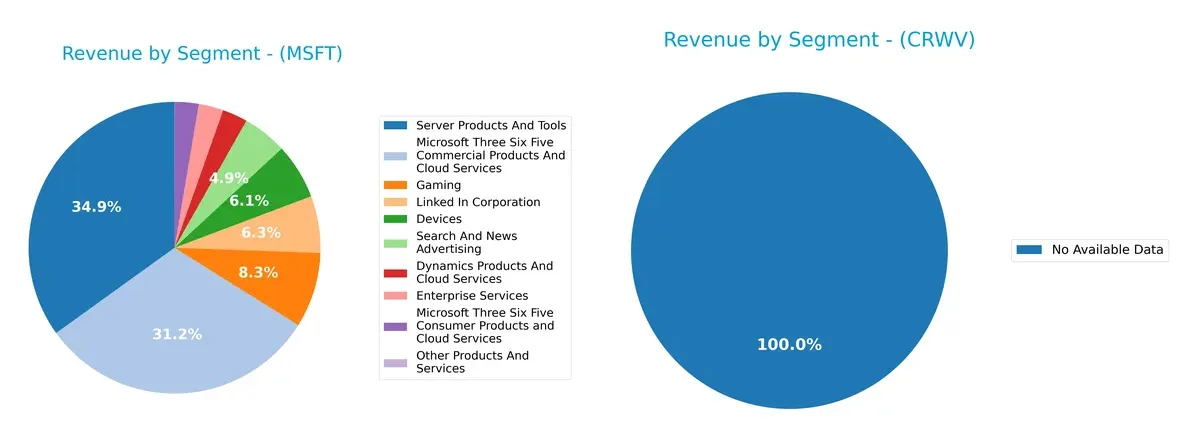
Microsoft Corporation displays a highly diversified revenue mix with significant contributions from Server Products and Tools ($98.4B), Microsoft 365 Commercial ($87.8B), and Gaming ($23.5B). This broad base anchors its ecosystem lock-in and infrastructure dominance. CoreWeave, Inc. lacks available segment data, preventing a meaningful comparison and highlighting transparency risk for investors seeking diversification insights. Microsoft’s multi-pronged approach reduces concentration risk effectively.
Strengths and Weaknesses Comparison
This table compares the Strengths and Weaknesses of Microsoft Corporation and CoreWeave, Inc. Class A Common Stock:
Microsoft Strengths
- Diverse product segments including cloud, gaming, and enterprise services
- Strong global presence with $137B non-US and $145B US revenue
- High profitability with 36.15% net margin and 29.65% ROE
- Favorable debt and liquidity ratios support solid financial health
CoreWeave Strengths
- Exceptionally high ROE at 208.77% indicates strong equity returns
- Favorable P/E and P/B ratios suggest market values growth potential
- Positive debt-to-equity ratio reflects unconventional capital structure
Microsoft Weaknesses
- Unfavorable valuation metrics with high P/E (36.31) and P/B (10.76)
- Below-average asset turnover (0.46) limits capital efficiency
- Dividend yield is low at 0.65%, reducing income appeal
- Moderate current ratio (1.35) signals neutral short-term liquidity
CoreWeave Weaknesses
- Negative net margin (-45.08%) reflects ongoing losses
- Extremely high WACC (83.48%) increases cost of capital
- Weak liquidity with current and quick ratios at 0.39
- High debt-to-assets ratio (59.56%) raises solvency concerns
- Negative interest coverage indicates financial stress
- Very low asset turnover (0.11) signals inefficient use of assets
Microsoft’s diversified revenue streams and global scale underpin its profitability and financial stability. CoreWeave shows impressive equity returns but faces significant profitability and liquidity challenges, impacting its risk profile and capital efficiency.
The Moat Duel: Analyzing Competitive Defensibility
A structural moat is the only reliable shield protecting long-term profits from relentless competitive erosion. Let’s examine the core moats at play:
Microsoft Corporation: Ecosystem Lock-In Through Intangible Assets
Microsoft’s moat centers on its vast ecosystem of software, cloud, and productivity tools. This manifests as high ROIC above WACC and stable 44.7% EBIT margins. In 2026, Azure growth and AI integration promise to deepen this intangible asset moat.
CoreWeave, Inc.: Emerging Cost Advantage in Cloud Infrastructure
CoreWeave competes on specialized GPU compute infrastructure, a narrower moat than Microsoft’s broad ecosystem. Despite rapid revenue growth, negative EBIT and ROIC well below WACC reveal ongoing value destruction. Its 2026 outlook hinges on scaling efficiencies and AI market disruption.
Ecosystem Depth vs. Cost Focus: The Moat Verdict
Microsoft’s wide moat from entrenched ecosystem assets outmatches CoreWeave’s nascent cost advantage. I see Microsoft better equipped to defend market share amid tech competition and economic cycles. CoreWeave must prove sustainable profitability to solidify its moat.
Which stock offers better returns?
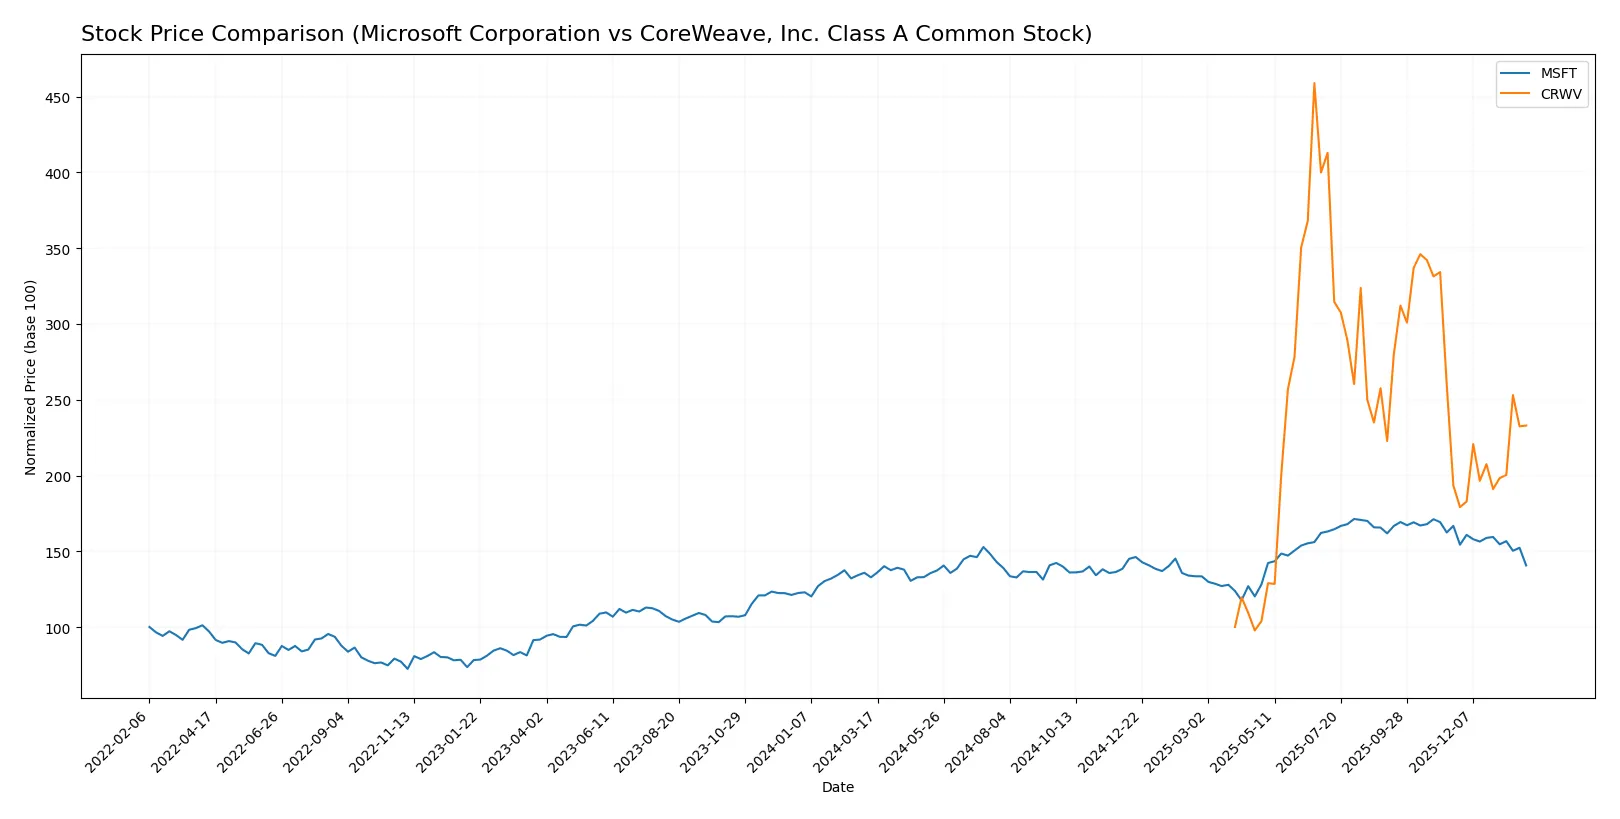
The past year shows divergent price dynamics: Microsoft’s stock gained moderately but slowed recently, while CoreWeave surged with accelerating momentum and stronger buyer interest.
Trend Comparison
Microsoft’s stock rose 5.93% over 12 months, indicating a bullish trend with deceleration. It hit a high of 524.11 and a low of 359.84, showing significant volatility (std. dev. 41.93).
CoreWeave’s stock soared 132.97% over the same period, demonstrating a bullish trend with acceleration. The stock ranged from 39.09 to 183.58, with volatility (std. dev. 34.91) slightly lower than Microsoft’s.
CoreWeave outperformed Microsoft markedly in market returns and trend acceleration, delivering the highest performance among the two stocks.
Target Prices
Analysts show a bullish consensus for both Microsoft Corporation and CoreWeave, Inc., reflecting strong growth expectations.
| Company | Target Low | Target High | Consensus |
|---|---|---|---|
| Microsoft Corporation | 450 | 675 | 600.04 |
| CoreWeave, Inc. Class A Common Stock | 84 | 175 | 120.73 |
Microsoft’s consensus target price of 600.04 stands about 40% above its current 430 price, signaling robust confidence. CoreWeave’s consensus at 120.73 also suggests significant upside from its 93 price, but with higher volatility risk.

Don’t Let Luck Decide Your Entry Point
Optimize your entry points with our advanced ProRealTime indicators. You’ll get efficient buy signals with precise price targets for maximum performance. Start outperforming now!
How do institutions grade them?
The following tables summarize the latest institutional grades for Microsoft Corporation and CoreWeave, Inc. Class A Common Stock:
Microsoft Corporation Grades
Here are the recent grades from major financial institutions for Microsoft Corporation.
| Grading Company | Action | New Grade | Date |
|---|---|---|---|
| Citigroup | Maintain | Buy | 2026-01-30 |
| Wells Fargo | Maintain | Overweight | 2026-01-29 |
| Wedbush | Maintain | Outperform | 2026-01-29 |
| Scotiabank | Maintain | Sector Outperform | 2026-01-29 |
| RBC Capital | Maintain | Outperform | 2026-01-29 |
| Stifel | Maintain | Buy | 2026-01-29 |
| Evercore ISI Group | Maintain | Outperform | 2026-01-29 |
| Keybanc | Maintain | Overweight | 2026-01-29 |
| Piper Sandler | Maintain | Overweight | 2026-01-29 |
| Cantor Fitzgerald | Maintain | Overweight | 2026-01-29 |
CoreWeave, Inc. Class A Common Stock Grades
The table below lists the latest grades assigned to CoreWeave, Inc. Class A Common Stock by recognized institutions.
| Grading Company | Action | New Grade | Date |
|---|---|---|---|
| Mizuho | Maintain | Neutral | 2026-01-27 |
| Deutsche Bank | Upgrade | Buy | 2026-01-27 |
| Macquarie | Maintain | Neutral | 2026-01-27 |
| Needham | Maintain | Hold | 2026-01-26 |
| DA Davidson | Upgrade | Buy | 2026-01-26 |
| Barclays | Maintain | Equal Weight | 2026-01-12 |
| Wells Fargo | Maintain | Overweight | 2026-01-08 |
| DA Davidson | Upgrade | Neutral | 2026-01-05 |
| Jefferies | Maintain | Buy | 2026-01-05 |
| Goldman Sachs | Maintain | Neutral | 2025-11-17 |
Which company has the best grades?
Microsoft consistently receives strong buy, outperform, and overweight ratings from multiple reputable firms. CoreWeave shows mixed ratings with several neutral and hold grades, though some upgrades to buy appear. This disparity suggests Microsoft holds a more favorable institutional sentiment, potentially reflecting greater investor confidence and stability.
Risks specific to each company
The following categories identify the critical pressure points and systemic threats facing both firms in the 2026 market environment:
1. Market & Competition
Microsoft Corporation
- Dominates established cloud and software markets with diversified segments.
CoreWeave, Inc. Class A Common Stock
- Faces intense competition in emerging GPU cloud infrastructure with smaller scale.
2. Capital Structure & Debt
Microsoft Corporation
- Strong balance sheet with low debt-to-assets (9.79%) and high interest coverage (52.84).
CoreWeave, Inc. Class A Common Stock
- High debt-to-assets ratio (59.56%) and negative interest coverage indicate financial strain.
3. Stock Volatility
Microsoft Corporation
- Moderate beta at 1.07 suggests typical market sensitivity for tech giant.
CoreWeave, Inc. Class A Common Stock
- Extremely high beta of 21.65 signals extreme stock volatility and investor risk.
4. Regulatory & Legal
Microsoft Corporation
- Faces ongoing scrutiny due to market dominance but has vast compliance resources.
CoreWeave, Inc. Class A Common Stock
- Regulatory risks less documented but startup status may expose it to evolving tech rules.
5. Supply Chain & Operations
Microsoft Corporation
- Robust global supply chain supporting hardware and software products.
CoreWeave, Inc. Class A Common Stock
- More vulnerable to supply chain disruptions due to smaller scale and emerging tech focus.
6. ESG & Climate Transition
Microsoft Corporation
- Actively investing in sustainability initiatives aligned with industry leaders.
CoreWeave, Inc. Class A Common Stock
- ESG initiatives less mature, increasing risk amid growing investor climate expectations.
7. Geopolitical Exposure
Microsoft Corporation
- Global footprint exposes it to geopolitical tensions but diversified revenue buffers impact.
CoreWeave, Inc. Class A Common Stock
- Primarily US-based but potential vulnerability to international trade policies as it expands.
Which company shows a better risk-adjusted profile?
Microsoft’s strongest risk lies in regulatory scrutiny due to its market dominance. CoreWeave’s biggest threat is its precarious capital structure and extreme stock volatility. Microsoft’s financial stability and moderate volatility grant it a clearly superior risk-adjusted profile, supported by a 9.7 Altman Z-score versus CoreWeave’s distress-zone 1.0. CoreWeave’s rapid growth is overshadowed by elevated leverage and market sensitivity.
Final Verdict: Which stock to choose?
Microsoft’s superpower lies in its unmatched operational efficiency and robust capital allocation, consistently creating value above its cost of capital. Its main point of vigilance is the slightly declining ROIC trend, which suggests profitability pressures ahead. This stock fits well in portfolios seeking steady, large-cap technology growth with moderate risk tolerance.
CoreWeave’s strategic moat hinges on its rapid revenue growth and potential in niche cloud infrastructure, offering a high-reward proposition. However, its financial instability and value destruction signal elevated risk. It suits aggressive, speculative portfolios willing to endure volatility in pursuit of outsized gains.
If you prioritize reliable value creation and proven profitability, Microsoft is the compelling choice due to its durable moat and strong financial footing. However, if you seek explosive growth potential and can tolerate substantial risk, CoreWeave offers superior upside despite its shaky fundamentals and high leverage.
Disclaimer: Investment carries a risk of loss of initial capital. The past performance is not a reliable indicator of future results. Be sure to understand risks before making an investment decision.
Go Further
I encourage you to read the complete analyses of Microsoft Corporation and CoreWeave, Inc. Class A Common Stock to enhance your investment decisions: