Home > Comparison > Technology > MSFT vs NET
The strategic rivalry between Microsoft Corporation and Cloudflare, Inc. shapes the future of the software infrastructure sector. Microsoft, a capital-intensive technology behemoth, contrasts sharply with Cloudflare’s agile, cloud-native security and performance platform. This head-to-head pits legacy scale against innovative disruption, reflecting a broader battle between established dominance and rapid growth. This analysis will determine which trajectory offers superior risk-adjusted returns for a diversified portfolio in 2026.

Table of contents
Companies Overview
Microsoft Corporation and Cloudflare, Inc. stand as pivotal players in the software infrastructure space, each shaping cloud technologies with distinct scale and scope.
Microsoft Corporation: Global Software Infrastructure Titan
Microsoft dominates as a technology giant delivering software, services, and devices worldwide. Its revenue stems from three segments: Productivity and Business Processes, Intelligent Cloud, and More Personal Computing. In 2026, Microsoft sharpens its strategic focus on cloud platform Azure and AI integration, reinforcing its competitive advantage through enterprise solutions and developer tools.
Cloudflare, Inc.: Agile Cloud Security and Performance Provider
Cloudflare operates as a nimble cloud services provider specializing in integrated security and performance solutions. Its core revenue derives from cloud firewall, DDoS protection, and content delivery services. In 2026, Cloudflare intensifies its focus on expanding secure access solutions and developer-based programmable networks, targeting multi-cloud environments to capture growing demand for reliable, scalable cloud infrastructure.
Strategic Collision: Similarities & Divergences
Both companies compete in software infrastructure but diverge sharply in business philosophy. Microsoft favors a broad ecosystem with integrated enterprise software, while Cloudflare pursues an open, network-centric model focused on security and cloud performance. Their primary battleground lies in cloud infrastructure services. Microsoft offers scale and diversified enterprise solutions; Cloudflare targets agility and specialized security. These differences shape distinct investment profiles—one anchored in legacy dominance, the other in innovative cloud agility.
Income Statement Comparison
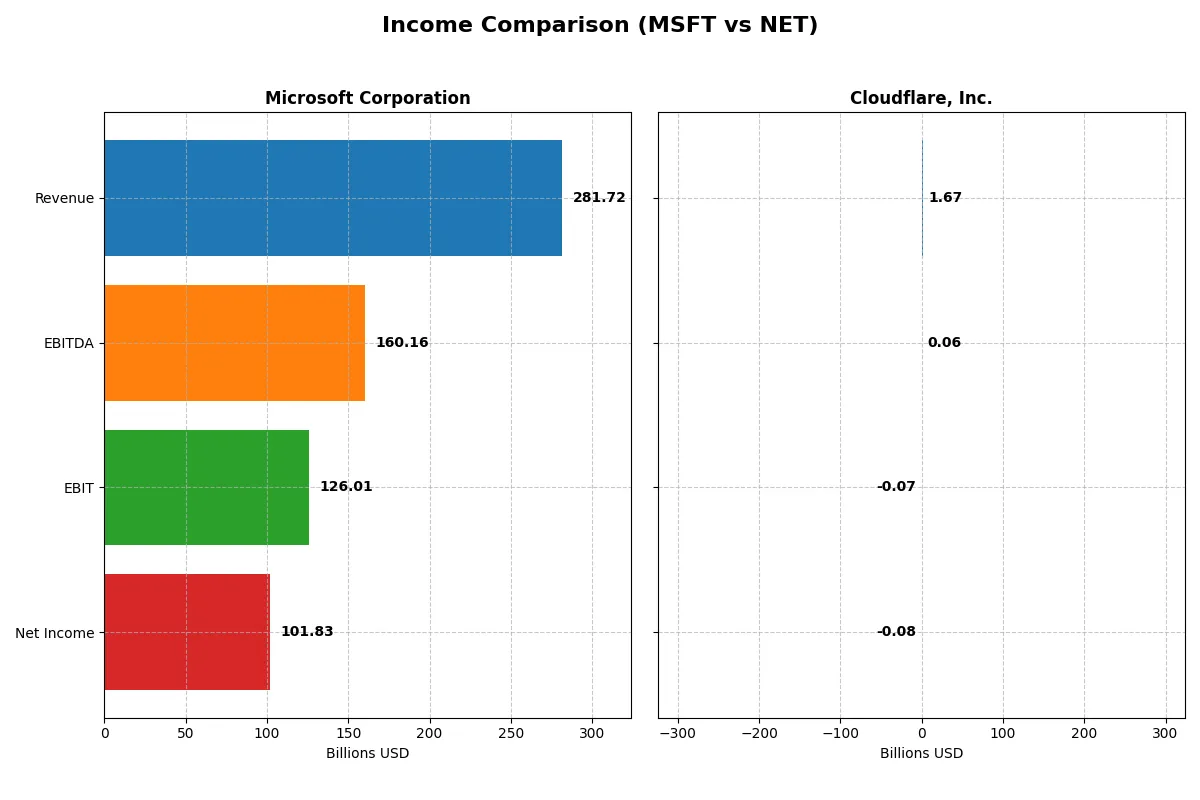
This data dissects the core profitability and scalability of both corporate engines to reveal who dominates the bottom line:
| Metric | Microsoft Corporation (MSFT) | Cloudflare, Inc. (NET) |
|---|---|---|
| Revenue | 282B | 1.67B |
| Cost of Revenue | 87.8B | 379M |
| Operating Expenses | 65.4B | 1.45B |
| Gross Profit | 194B | 1.29B |
| EBITDA | 160B | 62M |
| EBIT | 126B | -66M |
| Interest Expense | 2.39B | 5.2M |
| Net Income | 102B | -79M |
| EPS | 13.7 | -0.23 |
| Fiscal Year | 2025 | 2024 |
Income Statement Analysis: The Bottom-Line Duel
This income statement comparison exposes which company drives profitability and growth with superior operational efficiency and margin control.
Microsoft Corporation Analysis
Microsoft’s revenue surged from 168B in 2021 to 282B in 2025, with net income rising 66% to 102B. Its gross margin holds strong near 69%, and net margin at 36%, reflecting exceptional cost management. In 2025, Microsoft accelerated revenue growth by nearly 15%, while maintaining stable net margin and delivering EPS growth of 16%, signaling robust momentum.
Cloudflare, Inc. Analysis
Cloudflare’s revenue jumped from 431M in 2020 to 1.67B in 2024, a 288% increase. However, it remains unprofitable with a negative net margin near -5%. The company improved its EBIT by 72% year-over-year and cut losses substantially in 2024, showing rapid scaling but still struggling to convert growth into positive net income or sustainable profits.
Growth Scale vs. Profitability Strength
Microsoft clearly dominates in profitability and margin control, delivering steady net income growth and high returns on revenue. Cloudflare excels in revenue expansion but faces ongoing profitability challenges. For investors, Microsoft’s mature income profile offers reliable earnings power, while Cloudflare’s high-growth but loss-making status suits those seeking aggressive top-line expansion with higher risk.
Financial Ratios Comparison
These vital ratios act as a diagnostic tool to expose the underlying fiscal health, valuation premiums, and capital efficiency of the companies compared:
| Ratios | Microsoft Corporation (MSFT) | Cloudflare, Inc. (NET) |
|---|---|---|
| ROE | 29.6% | -7.5% |
| ROIC | 22.0% | -6.1% |
| P/E | 36.3 | -466.5 |
| P/B | 10.8 | 35.1 |
| Current Ratio | 1.35 | 2.86 |
| Quick Ratio | 1.35 | 2.86 |
| D/E (Debt/Equity) | 0.18 | 1.40 |
| Debt-to-Assets | 9.8% | 44.3% |
| Interest Coverage | 53.9 | -29.8 |
| Asset Turnover | 0.46 | 0.51 |
| Fixed Asset Turnover | 1.23 | 2.63 |
| Payout ratio | 23.6% | 0% |
| Dividend yield | 0.65% | 0% |
| Fiscal Year | 2025 | 2024 |
Efficiency & Valuation Duel: The Vital Signs
Financial ratios act as the company’s DNA, uncovering hidden risks and operational strengths crucial for investment evaluation.
Microsoft Corporation
Microsoft showcases robust profitability with a 29.65% ROE and a strong 36.15% net margin, reflecting operational excellence. The stock appears stretched with a high P/E of 36.31 and P/B of 10.76, indicating premium valuation. Shareholders receive modest dividends at 0.65%, while reinvestment in R&D fuels sustained growth and innovation.
Cloudflare, Inc.
Cloudflare exhibits weak profitability, marked by a negative 7.53% ROE and a -4.72% net margin, signaling operational challenges. The P/E ratio is negative but flagged favorable due to losses, while a steep P/B of 35.14 and high debt-to-equity of 1.4 highlight valuation and leverage risks. The company retains zero dividends, heavily investing in R&D to pursue growth.
Premium Valuation vs. Operational Safety
Microsoft balances strong returns with high valuation, reflecting market confidence in its operational moat. Cloudflare’s unfavorable profitability and leverage pose significant risks despite growth investments. Investors seeking operational safety may favor Microsoft, while those pursuing aggressive growth at higher risk might consider Cloudflare’s profile.
Which one offers the Superior Shareholder Reward?
I compare Microsoft Corporation (MSFT) and Cloudflare, Inc. (NET) on shareholder distributions. MSFT pays a consistent dividend with a 0.65% yield and a sustainable 24% payout ratio, backed by strong free cash flow of 9.6B. Its buyback program further enhances returns, reflecting prudent capital allocation. NET pays no dividend, focusing on reinvestment into growth and R&D, yet suffers negative net margins and weaker free cash flow at 0.57B. NET’s buybacks are negligible, limiting direct shareholder rewards. I see MSFT’s balanced distribution through dividends and buybacks as more sustainable and attractive for total return in 2026.
Comparative Score Analysis: The Strategic Profile
The radar chart reveals the fundamental DNA and trade-offs of Microsoft Corporation and Cloudflare, Inc., highlighting their financial strengths and vulnerabilities:
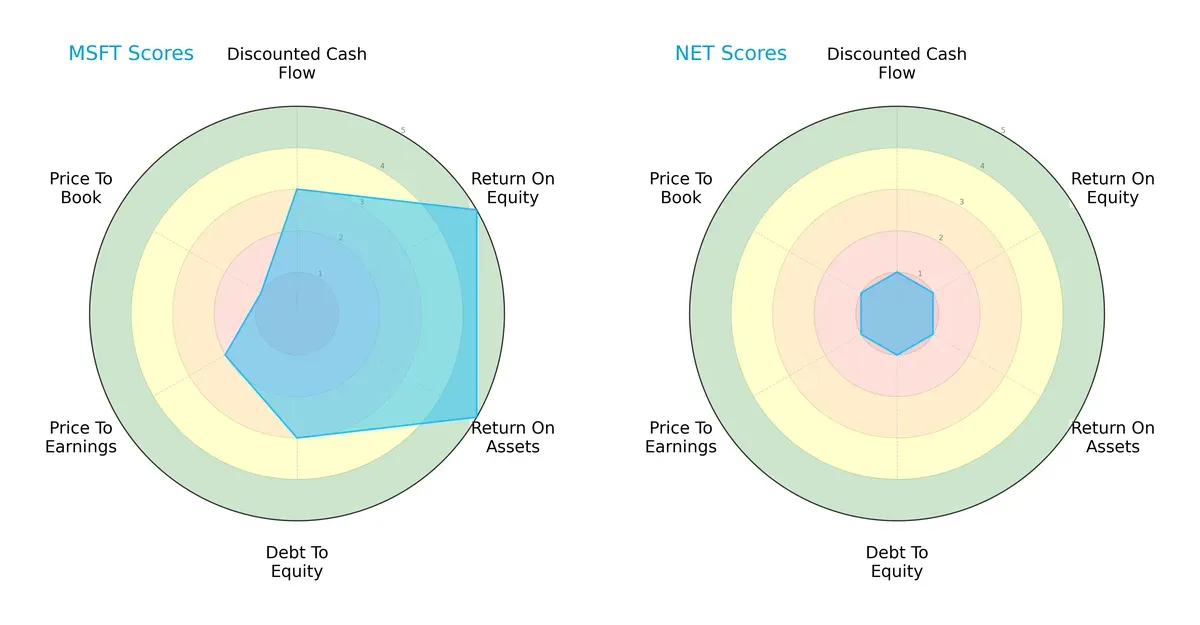
Microsoft dominates with very favorable returns on equity and assets, signaling operational efficiency. It balances moderate debt and cash flow scores, yet suffers from valuation pressure, especially on price-to-book. Cloudflare, however, scores uniformly low across all metrics, indicating an unbalanced profile relying on no clear financial edge. Microsoft clearly offers a more consistent, balanced strategic position.
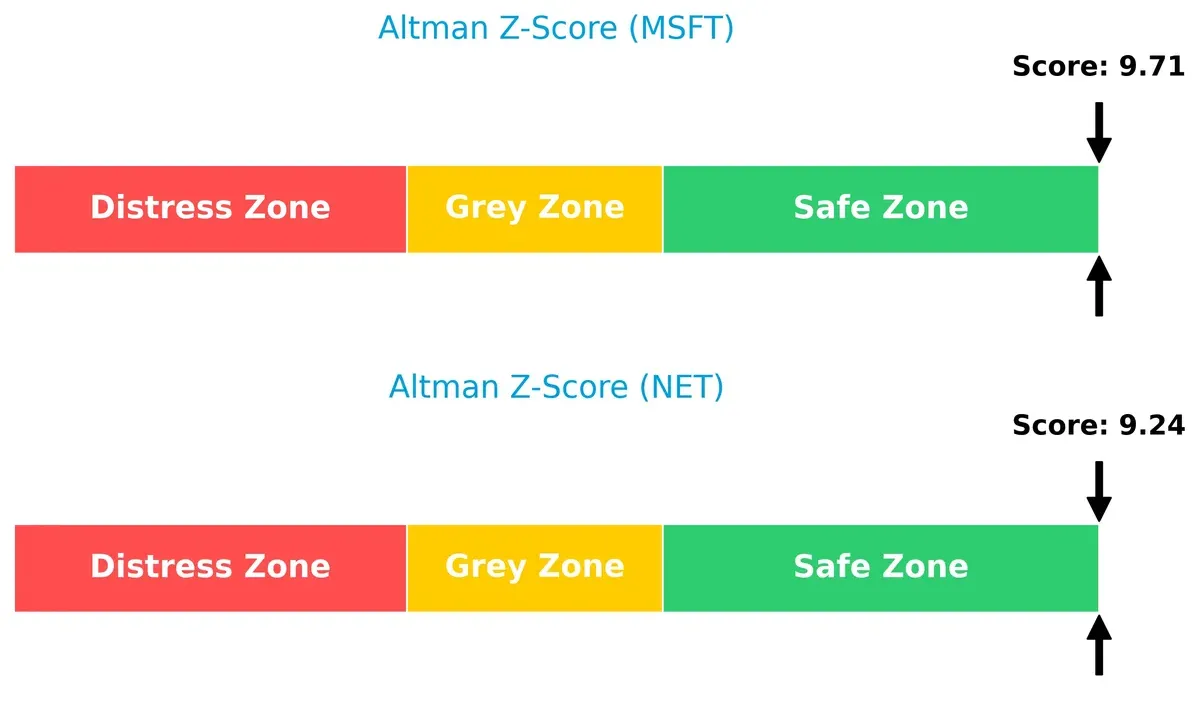
Bankruptcy Risk: Solvency Showdown
Microsoft’s Altman Z-Score of 9.7 versus Cloudflare’s 9.2 places both well in the safe zone, suggesting strong long-term survival prospects amid current market cycles:
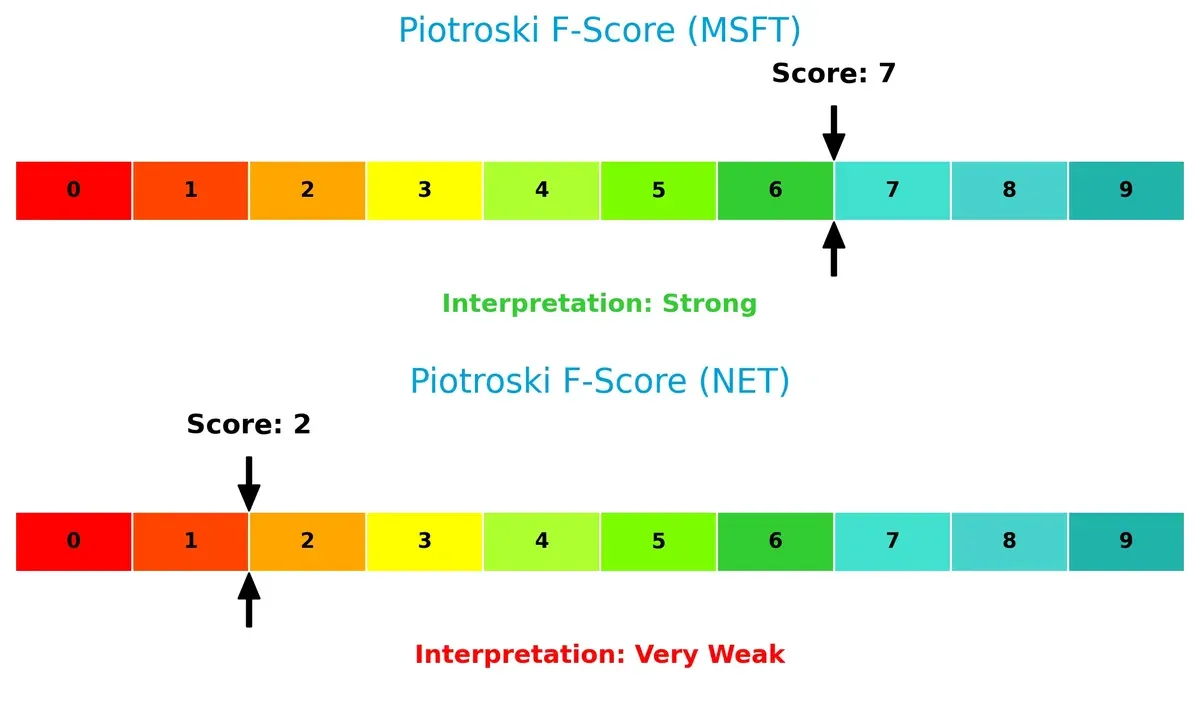
Financial Health: Quality of Operations
Microsoft’s Piotroski F-Score of 7 signals strong financial health and operational quality. Cloudflare’s 2 is a red flag, highlighting weak internal metrics and potential financial distress risks:
How are the two companies positioned?
This section dissects Microsoft and Cloudflare’s operational DNA by comparing their revenue distribution and internal strengths and weaknesses. We will confront their economic moats to identify which offers the most resilient, sustainable competitive advantage today.
Revenue Segmentation: The Strategic Mix
This comparison dissects how Microsoft Corporation and Cloudflare, Inc. diversify income streams and reveals their primary sector bets:
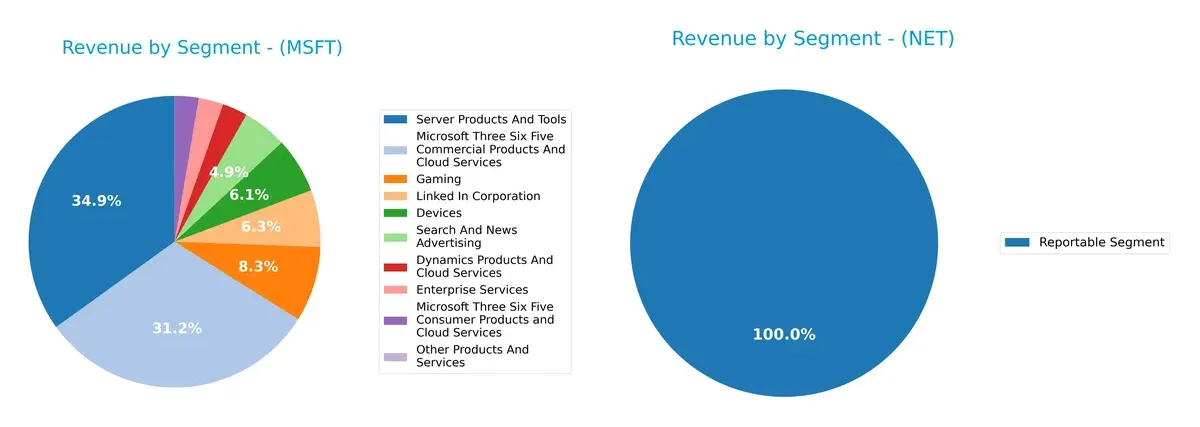
Microsoft shows a richly diversified revenue mix, spanning cloud services ($87.8B), server tools ($98.4B), gaming ($23.5B), and professional networks ($17.8B). This breadth anchors its ecosystem lock-in and reduces concentration risk. Cloudflare, by contrast, reports a single segment at $1.67B, indicating heavy reliance on one core business line. Microsoft’s scale and multi-segment dominance dwarf Cloudflare’s narrower focus, reflecting vastly different strategic profiles and risk exposures.
Strengths and Weaknesses Comparison
This table compares the strengths and weaknesses of Microsoft Corporation and Cloudflare, Inc.:
Microsoft Corporation Strengths
- Diversified revenue streams spanning cloud, gaming, enterprise services, and devices
- Strong profitability with 36.15% net margin and 29.65% ROE
- Favorable leverage ratios with low debt-to-assets (9.79%)
- Significant global presence with over $137B non-US revenue
- Leading market share in server products and cloud services
Cloudflare, Inc. Strengths
- Strong liquidity position with current and quick ratios at 2.86
- Expanding geographic diversification across US, EMEA, Asia Pacific
- Neutral asset turnover indicates operational efficiency
- Favorable P/E ratio reflecting investor growth expectations
- Focused product segment with $1.67B revenue potentially driving innovation
Microsoft Corporation Weaknesses
- High valuation multiples with P/E of 36.31 and P/B of 10.76
- Unfavorable asset turnover at 0.46 limits capital efficiency
- Dividend yield low at 0.65%, less attractive for income investors
- Neutral current ratio at 1.35 suggests moderate short-term liquidity
Cloudflare, Inc. Weaknesses
- Negative profitability with net margin of -4.72% and ROE of -7.53%
- High debt-to-equity at 1.4 increases financial risk
- Unfavorable interest coverage ratio at -12.64 signals earnings stress
- Unfavorable WACC at 12.9% raises capital cost concerns
- No dividend yield limits income appeal
Microsoft’s strengths lie in diversified revenue and strong profitability, supporting its global leadership. Cloudflare shows robust liquidity and geographic expansion but struggles with profitability and leverage. These contrasts highlight differing strategic focuses and capital structures.
The Moat Duel: Analyzing Competitive Defensibility
A structural moat alone protects long-term profits from relentless competition and market erosion. Let’s dissect the core moats of two software infrastructure giants:
Microsoft Corporation: Ecosystem Lock-In with Intangible Assets
Microsoft’s primary moat is its ecosystem lock-in, built on entrenched software platforms and cloud services. This translates into robust 44.7% EBIT margins and a 13% ROIC surplus over WACC, signaling efficient capital use. In 2026, Azure’s expansion and AI integrations deepen this moat but face pressure from emerging cloud disruptors.
Cloudflare, Inc.: Rapid Growth with Network Effects
Cloudflare relies heavily on network effects from its global content delivery and security platform. Unlike Microsoft, it operates with negative net margins but shows accelerating ROIC and a 22% ROIC growth trend. Its expanding customer base and edge computing innovations offer a promising, yet still unproven, moat in 2026.
Moat Strength: Ecosystem Lock-In vs. Network Effects
Microsoft’s ecosystem lock-in creates a wider, more durable moat, reflected in stable high margins and value creation. Cloudflare’s moat is narrower and less proven, though improving profitability indicates a developing competitive edge. Microsoft is better positioned to defend its market share against competition.
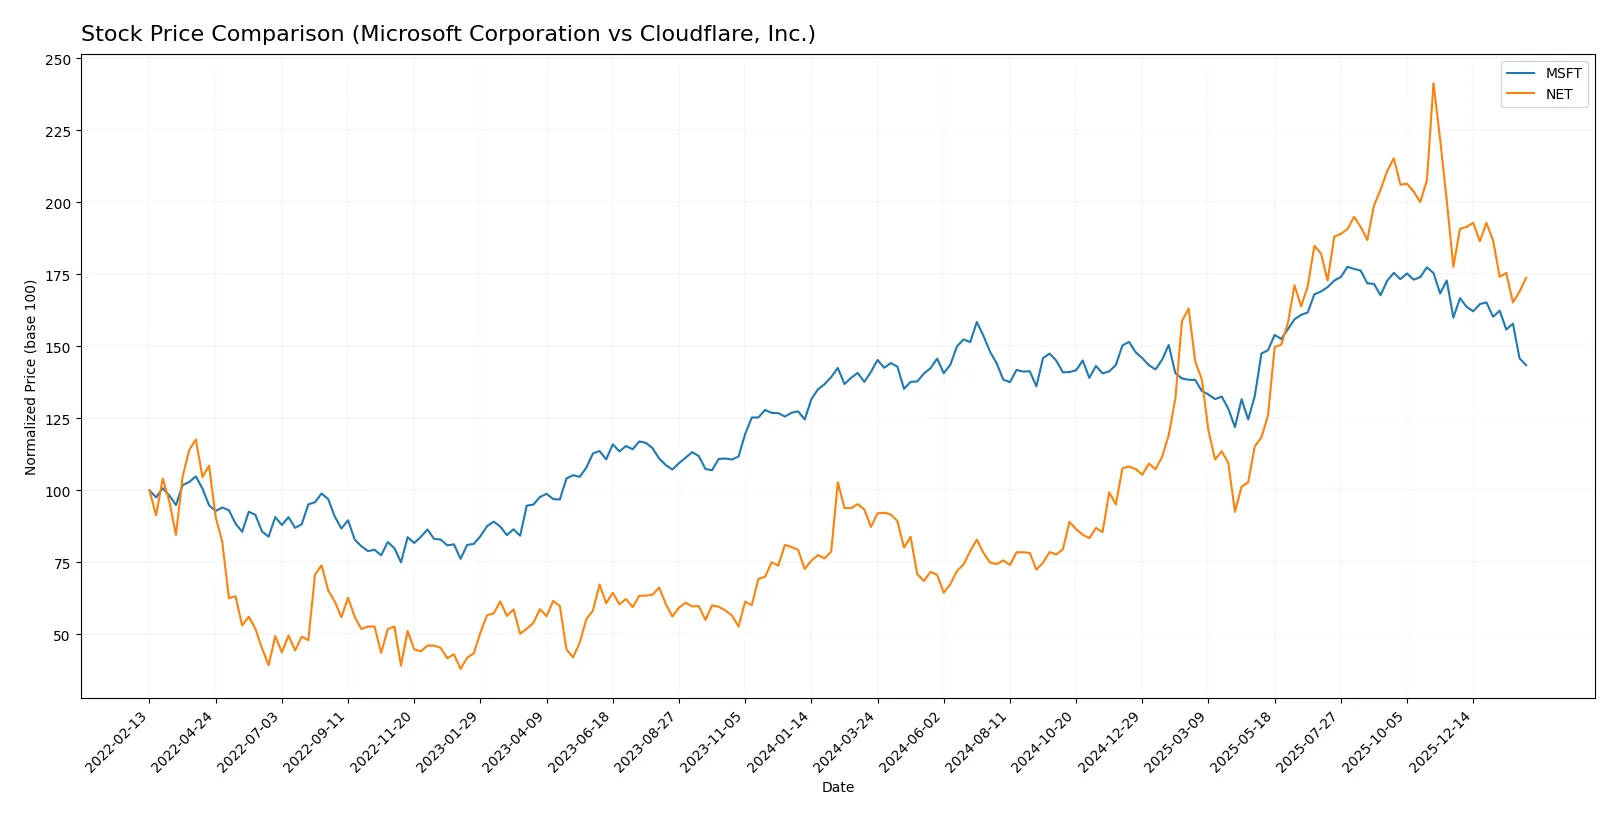
Which stock offers better returns?
Over the past year, Microsoft and Cloudflare stocks showed contrasting price movements, with Microsoft’s growth slowing and Cloudflare’s surge moderating amid shifting trading volumes.
Trend Comparison
Microsoft’s stock rose 1.67% over the past year, indicating a neutral trend with decelerating momentum. It hit a high of 524.11 and a low of 359.84, showing moderate volatility.
Cloudflare’s stock gained 99.15% over the same period, confirming a strong bullish trend despite deceleration. It ranged between 67.69 and 253.3, reflecting higher price volatility than Microsoft.
Cloudflare outperformed Microsoft substantially in market returns over the last year, delivering nearly 100% gains compared to Microsoft’s below 2% increase.
Target Prices
Analysts show a bullish consensus on both Microsoft Corporation and Cloudflare, Inc., with significant upside potential.
| Company | Target Low | Target High | Consensus |
|---|---|---|---|
| Microsoft Corporation | 450 | 675 | 600.04 |
| Cloudflare, Inc. | 210 | 300 | 247.75 |
Microsoft’s consensus target of 600 suggests a 42% upside versus its current 423 price. Cloudflare’s target at 247.75 implies a 36% gain from today’s 182.52 price, signaling strong growth expectations.

Don’t Let Luck Decide Your Entry Point
Optimize your entry points with our advanced ProRealTime indicators. You’ll get efficient buy signals with precise price targets for maximum performance. Start outperforming now!
How do institutions grade them?
This section compares the latest institutional grades for Microsoft Corporation and Cloudflare, Inc.:
Microsoft Corporation Grades
The following table shows recent institutional grades for Microsoft Corporation as of early 2026:
| Grading Company | Action | New Grade | Date |
|---|---|---|---|
| Citigroup | Maintain | Buy | 2026-01-30 |
| Wedbush | Maintain | Outperform | 2026-01-29 |
| Cantor Fitzgerald | Maintain | Overweight | 2026-01-29 |
| RBC Capital | Maintain | Outperform | 2026-01-29 |
| Stifel | Maintain | Buy | 2026-01-29 |
| DA Davidson | Maintain | Buy | 2026-01-29 |
| Keybanc | Maintain | Overweight | 2026-01-29 |
| Piper Sandler | Maintain | Overweight | 2026-01-29 |
| Evercore ISI Group | Maintain | Outperform | 2026-01-29 |
| Wells Fargo | Maintain | Overweight | 2026-01-29 |
Cloudflare, Inc. Grades
Below are the recent institutional grades for Cloudflare, Inc. through early 2026:
| Grading Company | Action | New Grade | Date |
|---|---|---|---|
| Mizuho | Maintain | Outperform | 2026-01-21 |
| Citigroup | Maintain | Buy | 2026-01-16 |
| UBS | Maintain | Neutral | 2026-01-13 |
| Piper Sandler | Maintain | Neutral | 2026-01-05 |
| Argus Research | Maintain | Buy | 2025-11-10 |
| Citigroup | Maintain | Buy | 2025-11-03 |
| Susquehanna | Maintain | Neutral | 2025-11-03 |
| Needham | Maintain | Buy | 2025-10-31 |
| UBS | Maintain | Neutral | 2025-10-31 |
| Piper Sandler | Maintain | Neutral | 2025-10-31 |
Which company has the best grades?
Microsoft consistently receives strong positive ratings, mostly “Buy,” “Outperform,” and “Overweight.” Cloudflare’s grades are more mixed, including several “Neutral” ratings. This difference suggests Microsoft commands broader institutional confidence, potentially affecting investor sentiment and valuation stability.
Risks specific to each company
The following categories identify the critical pressure points and systemic threats facing both firms in the 2026 market environment:
1. Market & Competition
Microsoft Corporation
- Dominates with a diverse product portfolio and strong cloud presence.
Cloudflare, Inc.
- Faces fierce competition from larger cloud providers and must scale rapidly.
2. Capital Structure & Debt
Microsoft Corporation
- Maintains low debt-to-equity at 0.18, strong interest coverage of 52.8x.
Cloudflare, Inc.
- High leverage with debt-to-equity at 1.4 and negative interest coverage signals risk.
3. Stock Volatility
Microsoft Corporation
- Moderate beta of 1.08 implies relative stability versus market swings.
Cloudflare, Inc.
- High beta of 1.97 indicates elevated stock price volatility.
4. Regulatory & Legal
Microsoft Corporation
- Large scale invites regulatory scrutiny, especially in antitrust and privacy.
Cloudflare, Inc.
- Emerging regulatory risks in cybersecurity and data privacy remain significant.
5. Supply Chain & Operations
Microsoft Corporation
- Robust global supply chain supports hardware and software delivery.
Cloudflare, Inc.
- Smaller scale and cloud infrastructure reliance may cause operational bottlenecks.
6. ESG & Climate Transition
Microsoft Corporation
- Advanced ESG initiatives with strong commitments to carbon neutrality.
Cloudflare, Inc.
- Developing ESG policies but lags behind peers in climate risk management.
7. Geopolitical Exposure
Microsoft Corporation
- Global footprint exposes it to US-China tensions and data sovereignty issues.
Cloudflare, Inc.
- Concentrated US focus but growing international presence increases geopolitical risks.
Which company shows a better risk-adjusted profile?
Microsoft’s strongest risk lies in regulatory scrutiny due to its scale and market dominance. Cloudflare’s most impactful risk is its fragile capital structure combined with high stock volatility. Microsoft exhibits a superior risk-adjusted profile supported by its robust balance sheet, stable cash flows, and safer Altman Z-score of 9.7 compared to Cloudflare’s 9.2 but much weaker Piotroski score. Cloudflare’s negative profitability metrics and high leverage signal caution despite growth prospects. Recent financial data confirm Microsoft’s resilience amid market turbulence, while Cloudflare grapples with operational scaling and financial stability challenges.
Final Verdict: Which stock to choose?
Microsoft’s superpower lies in its unmatched capital efficiency and robust cash generation. It consistently creates value above its cost of capital, signaling a durable competitive advantage. A point of vigilance is its premium valuation, which could pressure returns. It suits portfolios aiming for steady, long-term growth with moderate risk tolerance.
Cloudflare’s strategic moat is its accelerating revenue growth and strengthening profitability, driven by its cloud infrastructure niche. While this presents high growth potential, the company currently destroys value and carries elevated financial risk. It fits investors seeking aggressive growth and willing to accept volatility for disruptive upside.
If you prioritize consistent value creation and financial stability, Microsoft outshines with its proven track record and strong moat. However, if you seek high-reward exposure to cloud innovation and can tolerate risk, Cloudflare offers better growth momentum despite its current challenges. Both present distinct analytical scenarios for different investor profiles.
Disclaimer: Investment carries a risk of loss of initial capital. The past performance is not a reliable indicator of future results. Be sure to understand risks before making an investment decision.
Go Further
I encourage you to read the complete analyses of Microsoft Corporation and Cloudflare, Inc. to enhance your investment decisions: