In today’s fast-evolving semiconductor industry, QUALCOMM Incorporated and Cirrus Logic, Inc. stand out as key players driving innovation in wireless and audio technologies. Both companies operate in overlapping markets but differ in scale and product focus, with QUALCOMM leading in wireless communication chips and Cirrus specializing in high-precision audio ICs. This comparison will help investors identify which firm offers the most compelling growth and stability prospects in 2026. Let’s explore which stock deserves a place in your portfolio.
Table of contents
Companies Overview
I will begin the comparison between QUALCOMM and Cirrus Logic by providing an overview of these two companies and their main differences.
QUALCOMM Overview
QUALCOMM Incorporated focuses on developing and commercializing foundational wireless technologies globally. It operates through three segments: Qualcomm CDMA Technologies, Qualcomm Technology Licensing, and Qualcomm Strategic Initiatives. The company supplies integrated circuits and system software for wireless communications and licenses its extensive patent portfolio. Headquartered in San Diego, CA, QUALCOMM holds a significant position in the semiconductor industry with a market cap of 175.6B USD.
Cirrus Logic Overview
Cirrus Logic, Inc. is a fabless semiconductor company specializing in low-power, high-precision mixed-signal processing solutions. Its products include codecs, amplifiers, digital signal processors, and SoundClear audio technologies used in consumer devices and industrial applications. Based in Austin, TX, Cirrus Logic operates with a market cap of approximately 6.3B USD. It markets its products through direct sales and distributors, focusing on audio and mixed-signal ICs.
Key similarities and differences
Both QUALCOMM and Cirrus Logic operate in the semiconductor sector, supplying integrated circuits and technology solutions. QUALCOMM’s business model emphasizes wireless communication technologies and intellectual property licensing, whereas Cirrus Logic concentrates on mixed-signal audio and industrial applications. QUALCOMM is substantially larger, with a more diversified segment structure and global wireless technology leadership, while Cirrus Logic maintains a niche focus on audio and precision analog solutions.
Income Statement Comparison
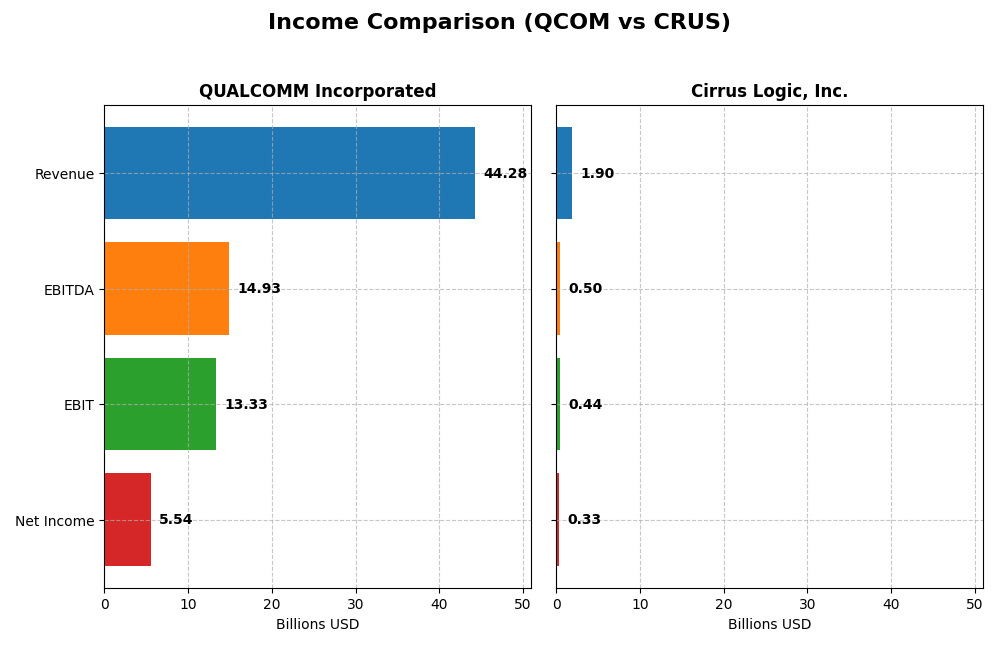
This table compares the key income statement metrics for QUALCOMM Incorporated and Cirrus Logic, Inc. based on their most recent fiscal year data.
| Metric | QUALCOMM Incorporated | Cirrus Logic, Inc. |
|---|---|---|
| Market Cap | 176B | 6.3B |
| Revenue | 44.3B | 1.9B |
| EBITDA | 14.9B | 497M |
| EBIT | 13.3B | 445M |
| Net Income | 5.54B | 332M |
| EPS | 5.06 | 6.24 |
| Fiscal Year | 2025 | 2025 |
Income Statement Interpretations
QUALCOMM Incorporated
QUALCOMM’s revenue grew steadily from $33.6B in 2021 to $44.3B in 2025, a 31.93% increase over five years. However, net income declined by 38.73% in the same period, reaching $5.54B in 2025, reflecting a significant contraction in net margin to 12.51%. Despite this, gross and EBIT margins remain strong and stable, with recent operating income growing by 20.79%, signaling improved operational efficiency despite bottom-line pressures.
Cirrus Logic, Inc.
Cirrus Logic showed a consistent revenue increase from $1.37B in 2021 to $1.90B in 2025, representing 38.48% growth. Net income more than doubled over the period, hitting $331.5M in 2025, with net margin improving to 17.48%. Margins are favorable, and the company experienced solid EBIT growth of 21.94% and an EPS increase of 22.45% in the last year, indicating strong profitability and efficient expense management.
Which one has the stronger fundamentals?
Both companies show favorable income statement fundamentals, but Cirrus Logic exhibits stronger net income growth and margin expansion, with 92.86% favorable income statement indicators and no unfavorable metrics. QUALCOMM has higher absolute revenue and EBIT margins but faces declining net income and EPS, with 35.71% unfavorable metrics. Cirrus Logic’s consistent margin improvements and robust profitability growth suggest comparatively stronger fundamentals.
Financial Ratios Comparison
Below is a comparison of key financial ratios for QUALCOMM Incorporated (QCOM) and Cirrus Logic, Inc. (CRUS) based on their most recent fiscal year data.
| Ratios | QUALCOMM Incorporated (2025) | Cirrus Logic, Inc. (2025) |
|---|---|---|
| ROE | 26.1% | 17.0% |
| ROIC | 13.2% | 14.2% |
| P/E | 32.7 | 15.9 |
| P/B | 8.54 | 2.71 |
| Current Ratio | 2.82 | 6.35 |
| Quick Ratio | 2.10 | 4.82 |
| D/E | 0.70 | 0.07 |
| Debt-to-Assets | 29.5% | 6.2% |
| Interest Coverage | 18.6 | 457.0 |
| Asset Turnover | 0.88 | 0.81 |
| Fixed Asset Turnover | 9.44 | 6.62 |
| Payout ratio | 68.7% | 0% |
| Dividend yield | 2.10% | 0% |
Interpretation of the Ratios
QUALCOMM Incorporated
QUALCOMM shows a strong financial profile with favorable net margin (12.51%), ROE (26.13%), and ROIC (13.19%). Its liquidity ratios are solid, with a current ratio of 2.82 and an interest coverage ratio of 20.07, indicating good debt servicing capacity. Dividend yield stands at 2.1%, supported by sustainable payout and share buybacks, though elevated P/E (32.7) and P/B (8.54) ratios warrant caution.
Cirrus Logic, Inc.
Cirrus Logic presents a generally favorable ratio mix, including a healthy net margin of 17.48% and ROIC at 14.2%. The company’s quick ratio (4.82) and low debt-to-equity (0.07) suggest strong liquidity and low leverage. However, a very high current ratio (6.35) may indicate inefficient asset usage. Cirrus Logic does not pay dividends, likely prioritizing reinvestment and R&D for growth.
Which one has the best ratios?
Both companies exhibit favorable overall ratios, yet QUALCOMM’s higher profitability and dividend yield contrast with Cirrus Logic’s stronger liquidity and lower leverage. QUALCOMM’s elevated valuation multiples may imply market expectations of growth, while Cirrus Logic’s lack of dividends reflects a reinvestment strategy. The choice depends on investor preference for income versus growth and risk tolerance.
Strategic Positioning
This section compares the strategic positioning of QUALCOMM and Cirrus Logic, including market position, key segments, and exposure to technological disruption:
QUALCOMM Incorporated
- Leading semiconductor company with significant market cap and notable competitive pressure.
- Diverse segments: QCT for integrated circuits, QTL for technology licensing, QSI for strategic investments.
- Invests in early-stage tech including 5G, AI, automotive, and IoT, indicating exposure to evolving technologies.
Cirrus Logic, Inc.
- Smaller semiconductor firm focused on niche mixed-signal processing markets.
- Concentrated on portable audio products and high-performance mixed-signal products.
- Primarily focused on audio and mixed-signal innovations with less broad tech diversification.
QUALCOMM Incorporated vs Cirrus Logic, Inc. Positioning
QUALCOMM operates a diversified business model with multiple revenue streams across licensing and chip development, offering broad exposure but facing intense competition. Cirrus Logic’s focus on portable audio and mixed-signal products provides specialization advantages but limits market scope and diversification.
Which has the best competitive advantage?
Cirrus Logic shows a very favorable moat with growing ROIC, indicating durable competitive advantage. QUALCOMM creates value but with declining profitability, reflecting a slightly favorable moat and less durable competitive positioning.
Stock Comparison
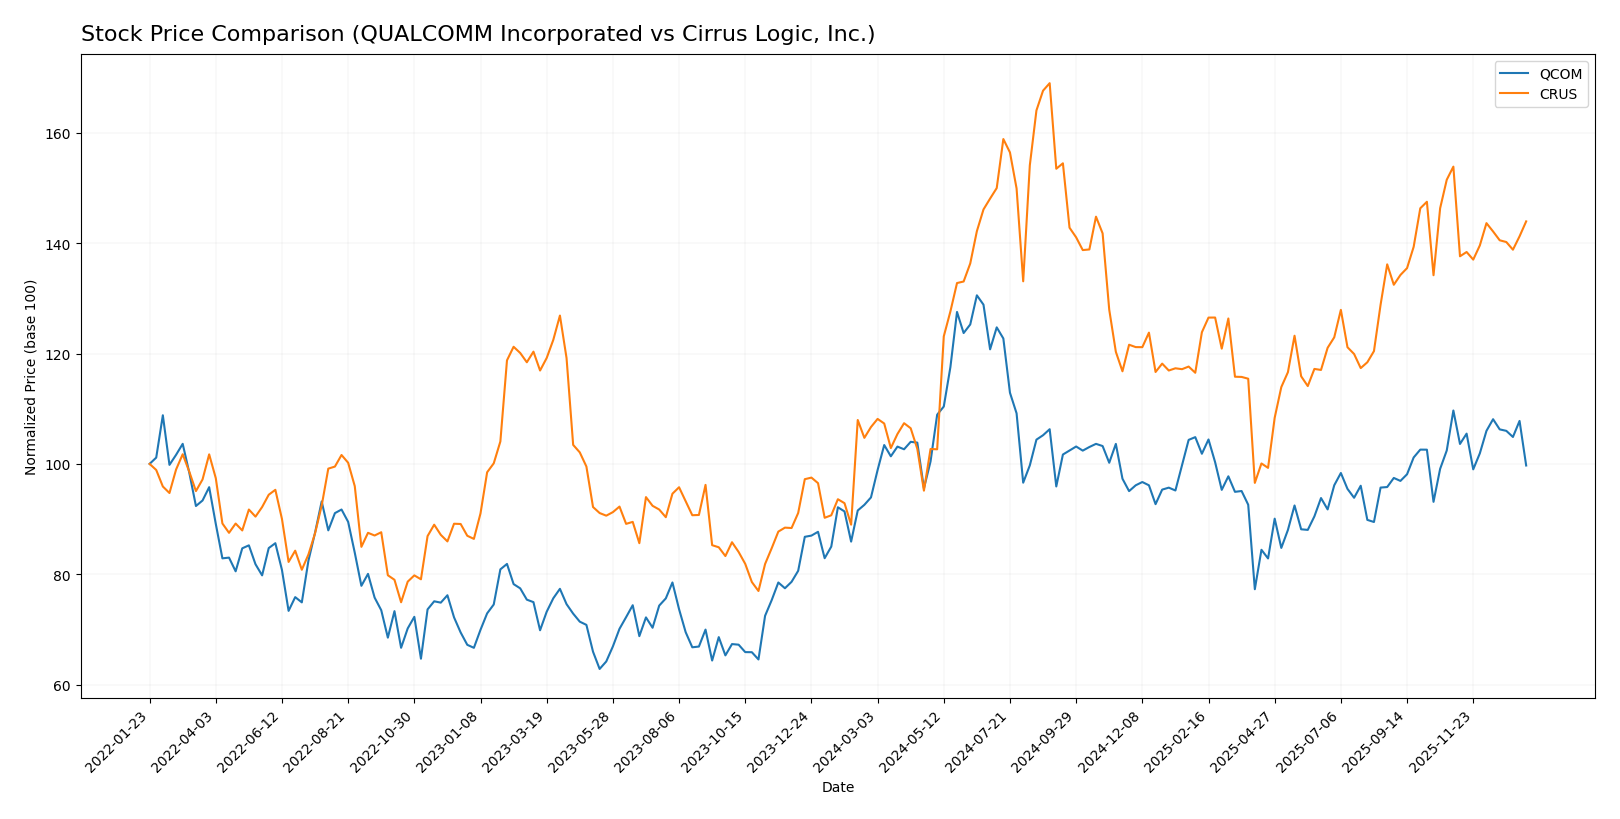
The past 12 months reveal notable bullish trends for both QUALCOMM Incorporated (QCOM) and Cirrus Logic, Inc. (CRUS), with QCOM showing accelerating gains and CRUS experiencing a deceleration despite a higher overall price increase.
Trend Analysis
QUALCOMM’s stock price rose by 6.16% over the past year, indicating a bullish trend with acceleration. The price fluctuated between 127.46 and 215.33, with a high volatility level (std deviation 16.08). However, recent months show a bearish correction (-9.09%) with decreased volatility.
Cirrus Logic’s stock increased by 34.94% over the same period, marking a bullish trend but with deceleration. It traded between 82.02 and 145.69, displaying slightly lower volatility (std deviation 14.47). The recent trend also turned bearish (-6.45%) with modest volatility decline.
Comparing the two, Cirrus Logic delivered the highest market performance with a 34.94% gain versus QUALCOMM’s 6.16%, despite both facing recent downward corrections.
Target Prices
Analysts provide clear target price ranges and consensus estimates for both QUALCOMM Incorporated and Cirrus Logic, Inc.
| Company | Target High | Target Low | Consensus |
|---|---|---|---|
| QUALCOMM Incorporated | 210 | 165 | 185.71 |
| Cirrus Logic, Inc. | 155 | 100 | 138.75 |
The target consensus for QUALCOMM suggests upside potential from the current price of $163.92, indicating moderate optimism. Cirrus Logic’s consensus target also exceeds its current price of $123.89, reflecting positive analyst expectations but with a wider valuation range.
Analyst Opinions Comparison
This section compares analysts’ ratings and grades for QUALCOMM Incorporated and Cirrus Logic, Inc.:
Rating Comparison
QUALCOMM Rating
- Rating: B+, considered Very Favorable
- Discounted Cash Flow Score: 4, Favorable
- ROE Score: 5, Very Favorable
- ROA Score: 5, Very Favorable
- Debt To Equity Score: 1, Very Unfavorable
- Overall Score: 3, Moderate
Cirrus Logic Rating
- Rating: A-, considered Very Favorable
- Discounted Cash Flow Score: 4, Favorable
- ROE Score: 4, Favorable
- ROA Score: 5, Very Favorable
- Debt To Equity Score: 3, Moderate
- Overall Score: 4, Favorable
Which one is the best rated?
Based strictly on the provided data, Cirrus Logic holds a higher overall score (4 vs. 3) and a better rating (A- vs. B+). QUALCOMM scores higher on ROE but has a weaker debt-to-equity score, indicating more financial risk.
Scores Comparison
Here is a comparison of the Altman Z-Score and Piotroski Score for QUALCOMM and Cirrus Logic:
QUALCOMM Scores
- Altman Z-Score: 6.37, indicating a safe zone with low bankruptcy risk.
- Piotroski Score: 7, classified as strong financial health.
Cirrus Logic Scores
- Altman Z-Score: 11.94, also in the safe zone, showing very low bankruptcy risk.
- Piotroski Score: 7, also classified as strong financial health.
Which company has the best scores?
Both QUALCOMM and Cirrus Logic have Altman Z-Scores in the safe zone and identical Piotroski Scores of 7, reflecting comparable financial health and low bankruptcy risk based on these measures.
Grades Comparison
Here is a detailed comparison of the latest reliable grades for QUALCOMM Incorporated and Cirrus Logic, Inc.:
QUALCOMM Incorporated Grades
The following table shows recent grades assigned by reputable grading companies for QUALCOMM:
| Grading Company | Action | New Grade | Date |
|---|---|---|---|
| Mizuho | Downgrade | Neutral | 2026-01-09 |
| Rosenblatt | Maintain | Buy | 2025-11-06 |
| B of A Securities | Maintain | Buy | 2025-11-06 |
| Mizuho | Maintain | Outperform | 2025-11-06 |
| Wells Fargo | Maintain | Underweight | 2025-11-06 |
| Piper Sandler | Maintain | Overweight | 2025-11-06 |
| UBS | Maintain | Neutral | 2025-11-06 |
| JP Morgan | Maintain | Overweight | 2025-11-04 |
| Citigroup | Maintain | Neutral | 2025-10-28 |
| Rosenblatt | Maintain | Buy | 2025-10-28 |
QUALCOMM’s grades show a mixed but generally positive trend with many “Buy” and “Overweight” ratings, though a recent downgrade from Mizuho to “Neutral” signals caution.
Cirrus Logic, Inc. Grades
The following table presents recent grades assigned by recognized grading companies for Cirrus Logic:
| Grading Company | Action | New Grade | Date |
|---|---|---|---|
| Keybanc | Maintain | Overweight | 2025-11-05 |
| Barclays | Maintain | Equal Weight | 2025-11-05 |
| Stifel | Maintain | Buy | 2025-11-05 |
| Benchmark | Maintain | Buy | 2025-11-05 |
| Susquehanna | Maintain | Positive | 2025-10-22 |
| Stifel | Maintain | Buy | 2025-10-17 |
| Stifel | Maintain | Buy | 2025-09-12 |
| Barclays | Maintain | Equal Weight | 2025-05-07 |
| Barclays | Maintain | Equal Weight | 2025-04-22 |
| Stifel | Maintain | Buy | 2025-04-17 |
Cirrus Logic’s grades consistently show “Buy” and “Overweight” ratings, with several “Equal Weight” assessments, indicating steady positive sentiment.
Which company has the best grades?
Both QUALCOMM and Cirrus Logic carry a consensus “Buy” rating, but QUALCOMM has a broader range of opinions including some neutral and underweight ratings, while Cirrus Logic’s grades show more consistency with frequent “Buy” and “Overweight” ratings. This consistency in grades for Cirrus Logic may indicate relatively steadier analyst confidence, which could affect investor perceptions regarding risk and potential return.
Strengths and Weaknesses
Below is a comparative overview of key strengths and weaknesses for QUALCOMM Incorporated (QCOM) and Cirrus Logic, Inc. (CRUS) based on recent financial and operational data.
| Criterion | QUALCOMM Incorporated (QCOM) | Cirrus Logic, Inc. (CRUS) |
|---|---|---|
| Diversification | Moderate: Primarily driven by QCT segment (~$38.4B in 2025), less diversified product lines | Moderate: Focused on audio and mixed signal products with portable audio as a major revenue driver (~$1.14B in 2025) |
| Profitability | Favorable: Net margin 12.5%, ROIC 13.2%, ROE 26.1%, but declining ROIC trend | Favorable: Higher net margin 17.5%, ROIC 14.2%, stable and growing ROIC trend |
| Innovation | Strong: Leading in semiconductor tech, but ROIC decline may indicate challenges in innovation pace | Strong: Demonstrates durable competitive advantage with increasing profitability |
| Global presence | Extensive: Large global footprint with diversified customer base | Moderate: More niche market focus but expanding in portable audio devices |
| Market Share | Large: Significant share in mobile chipset market and licensing | Smaller niche player in audio semiconductors but growing market presence |
Key takeaways: QUALCOMM maintains strong profitability and a broad global presence but faces a declining ROIC trend that warrants cautious monitoring. Cirrus Logic shows robust profitability and a growing competitive advantage, marking it as a durable value creator in its niche. Investors should balance QUALCOMM’s scale with Cirrus Logic’s growth potential and innovation stability.
Risk Analysis
Below is a comparative table highlighting key risks for QUALCOMM Incorporated (QCOM) and Cirrus Logic, Inc. (CRUS) based on their latest financial and operational data for 2025.
| Metric | QUALCOMM Incorporated (QCOM) | Cirrus Logic, Inc. (CRUS) |
|---|---|---|
| Market Risk | Moderate (Beta 1.21) | Moderate (Beta 1.08) |
| Debt Level | Moderate (Debt/Equity 0.7, Debt/Assets 29.5%) | Low (Debt/Equity 0.07, Debt/Assets 6.2%) |
| Regulatory Risk | Elevated (Licensing and patents in wireless tech require compliance) | Moderate (Less exposure to complex licensing) |
| Operational Risk | Moderate (Large, diversified segments; supply chain sensitivity) | Moderate (Fabless model; relies on key customers) |
| Environmental Risk | Low to Moderate (Tech industry with growing ESG scrutiny) | Low (Smaller scale, less resource intensive) |
| Geopolitical Risk | Moderate to High (Global supply chains and US government contracts) | Moderate (Primarily US-based but global sales) |
QUALCOMM faces the most impactful risks in regulatory and geopolitical areas given its extensive patent licensing and government ties. Cirrus Logic’s main vulnerabilities are operational and market risks but benefits from a stronger balance sheet with low debt exposure. Both companies are financially stable, yet QUALCOMM’s higher debt and geopolitical exposure warrant caution.
Which Stock to Choose?
QUALCOMM Incorporated (QCOM) shows a generally favorable income evolution with strong revenue growth and profitability ratios, despite some net margin and EPS declines over the period. Its debt levels remain moderate, supported by a solid current ratio and a very favorable rating of B+.
Cirrus Logic, Inc. (CRUS) presents stable income growth with favorable net margin improvements and consistent profitability. The company maintains very low debt, an excellent current ratio, and a very favorable rating of A-, reflecting sound financial health and value creation.
For investors prioritizing durable competitive advantage and growing profitability, CRUS might appear to offer a more favorable profile with its very favorable moat status and improving income metrics. Conversely, QCOM could be more aligned with those valuing large-scale operations and strong cash flow generation, despite some declining profitability trends.
Disclaimer: Investment carries a risk of loss of initial capital. The past performance is not a reliable indicator of future results. Be sure to understand risks before making an investment decision.
Go Further
I encourage you to read the complete analyses of QUALCOMM Incorporated and Cirrus Logic, Inc. to enhance your investment decisions: