Charles River Laboratories International, Inc. (CRL) and RadNet, Inc. (RDNT) both operate within the medical diagnostics and research sector but focus on distinct niches—CRL on contract research and drug development services, and RadNet on outpatient diagnostic imaging. Their innovative approaches and overlapping healthcare markets make them compelling options for investors seeking exposure to medical technology and research. In this article, I will analyze both companies to determine which offers the most promising investment opportunity.

Table of contents
Companies Overview
I will begin the comparison between Charles River Laboratories and RadNet by providing an overview of these two companies and their main differences.
Charles River Laboratories Overview
Charles River Laboratories International, Inc. is a non-clinical contract research organization focused on drug discovery, non-clinical development, and safety testing services. Operating globally, it serves pharmaceutical and biotechnology clients through segments including research models, discovery and safety assessment, and manufacturing solutions. Founded in 1947, the company is headquartered in Wilmington, Massachusetts, and employs approximately 18,700 people.
RadNet Overview
RadNet, Inc. provides outpatient diagnostic imaging services across the United States, including MRI, CT, PET, and mammography, among others. The company also develops diagnostic imaging systems and AI-powered solutions to aid radiologists in cancer detection. Founded in 1981 and based in Los Angeles, California, RadNet manages 347 centers and employs around 11,000 people focused on medical diagnostics and imaging services.
Key similarities and differences
Both Charles River Laboratories and RadNet operate within the healthcare sector, specializing in diagnostics and research services. Charles River focuses on preclinical testing and drug development support globally, whereas RadNet concentrates on outpatient diagnostic imaging and AI technology primarily within the U.S. Their business models differ in scope: Charles River provides contract research and manufacturing services, while RadNet delivers imaging diagnostics and related technology solutions.
Income Statement Comparison
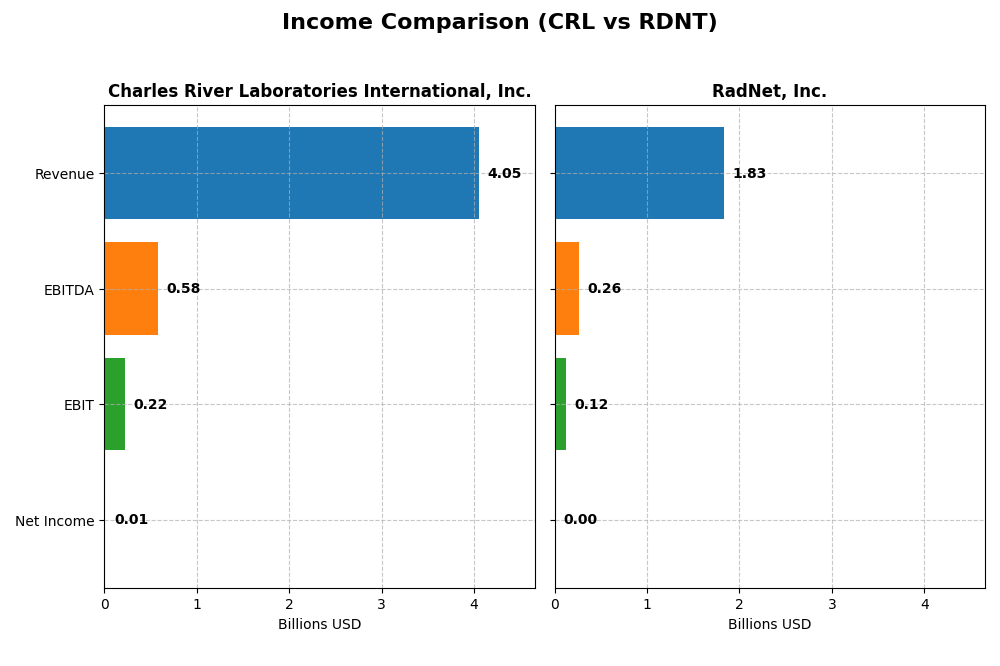
The table below presents a side-by-side comparison of key income statement metrics for Charles River Laboratories International, Inc. and RadNet, Inc. for the fiscal year 2024.
| Metric | Charles River Laboratories International, Inc. (CRL) | RadNet, Inc. (RDNT) |
|---|---|---|
| Market Cap | 10.9B | 6.0B |
| Revenue | 4.05B | 1.83B |
| EBITDA | 581M | 263M |
| EBIT | 219M | 125M |
| Net Income | 10.3M | 2.8M |
| EPS | 0.20 | 0.038 |
| Fiscal Year | 2024 | 2024 |
Income Statement Interpretations
Charles River Laboratories International, Inc.
Charles River Laboratories showed overall revenue growth of 38.5% from 2020 to 2024, but net income declined sharply by 97.2% in the same period. Gross margin remained favorable at 32.9%, while EBIT and net margins were neutral to weak. The most recent year, 2024, saw a 1.9% revenue decline and significant contraction across profitability metrics, indicating challenges in maintaining earnings despite stable top-line levels.
RadNet, Inc.
RadNet exhibited strong revenue growth of 70.7% over the 2020-2024 period and net income more than doubled, increasing by 118.8%. Its gross margin held steady at a neutral 13.6%, with EBIT margin neutral and interest expense favorable. In 2024, revenue advanced 13.2% and EBIT rose by 20.7%, although net margin and EPS decreased slightly, reflecting some margin pressures despite robust top-line expansion.
Which one has the stronger fundamentals?
RadNet’s income statement fundamentals appear stronger due to consistent revenue and net income growth, supported by favorable margin trends overall. Charles River Laboratories, despite solid revenue growth historically, experienced a drastic decline in net income and deteriorating margins recently. RadNet’s positive growth and margin stability contrast with Charles River’s recent earnings weakness, suggesting stronger underlying income statement performance for RadNet.
Financial Ratios Comparison
Below is a comparison of key financial ratios for Charles River Laboratories International, Inc. (CRL) and RadNet, Inc. (RDNT) based on their most recent fiscal year data ending 2024.
| Ratios | Charles River Laboratories (CRL) | RadNet (RDNT) |
|---|---|---|
| ROE | 0.30% | 0.31% |
| ROIC | 0.95% | 3.14% |
| P/E | 921.1 | 1826.3 |
| P/B | 2.74 | 5.65 |
| Current Ratio | 1.41 | 2.12 |
| Quick Ratio | 1.13 | 2.12 |
| D/E (Debt-to-Equity) | 0.79 | 1.92 |
| Debt-to-Assets | 36.2% | 52.6% |
| Interest Coverage | 1.80 | 1.31 |
| Asset Turnover | 0.54 | 0.56 |
| Fixed Asset Turnover | 2.01 | 1.37 |
| Payout Ratio | 0% | 0% |
| Dividend Yield | 0% | 0% |
Interpretation of the Ratios
Charles River Laboratories International, Inc.
Charles River Laboratories shows a mixed ratio profile with a slight tilt towards unfavorable. Key profitability metrics such as net margin (0.25%) and return on equity (0.3%) are weak, alongside a very high P/E ratio of 921.12, indicating potential overvaluation. The company does not pay dividends, likely reflecting a reinvestment strategy or growth focus, with no recent dividend yield or payout ratio data available.
RadNet, Inc.
RadNet exhibits predominantly unfavorable ratios, including a low net margin of 0.15% and very high P/E of 1826.32, suggesting valuation concerns. Its debt levels are elevated, with a debt-to-equity ratio of 1.92 and debt-to-assets at 52.6%, both unfavorable. Like Charles River, RadNet does not distribute dividends, which may be due to reinvestment priorities or ongoing financial challenges.
Which one has the best ratios?
Comparing both, Charles River Laboratories holds a slightly less unfavorable overall ratio profile than RadNet. While both companies face profitability and valuation challenges, Charles River’s balance sheet and liquidity ratios are more stable, with fewer unfavorable debt metrics. RadNet’s higher leverage and weaker returns contribute to a more unfavorable evaluation in the current fiscal year.
Strategic Positioning
This section compares the strategic positioning of Charles River Laboratories (CRL) and RadNet (RDNT), focusing on market position, key segments, and exposure to technological disruption:
Charles River Laboratories (CRL)
- Leading global contract research organization facing healthcare industry competition.
- Key segments: Discovery and Safety Assessment, Manufacturing, and Research Models generating diversified revenues.
- Limited explicit exposure to technological disruption in testing and safety assessment services.
RadNet (RDNT)
- Operates outpatient diagnostic imaging centers under competitive pressure in the US market.
- Key segments: Diagnostic imaging services, commercial insurance payments, and AI-based imaging software.
- Actively develops AI suites to enhance radiologist image interpretation, indicating technological integration.
Charles River Laboratories vs RadNet Positioning
CRL adopts a diversified approach with multiple business lines in drug discovery and safety testing, while RDNT focuses on outpatient diagnostic imaging and technological innovation in AI. CRL’s broad service portfolio contrasts with RDNT’s concentrated imaging services and AI development.
Which has the best competitive advantage?
Both companies are currently shedding value, but RDNT shows a slightly improving profitability trend, whereas CRL’s profitability is declining more sharply. RDNT’s integration of AI may offer a modest advantage despite an overall slightly unfavorable moat status.
Stock Comparison
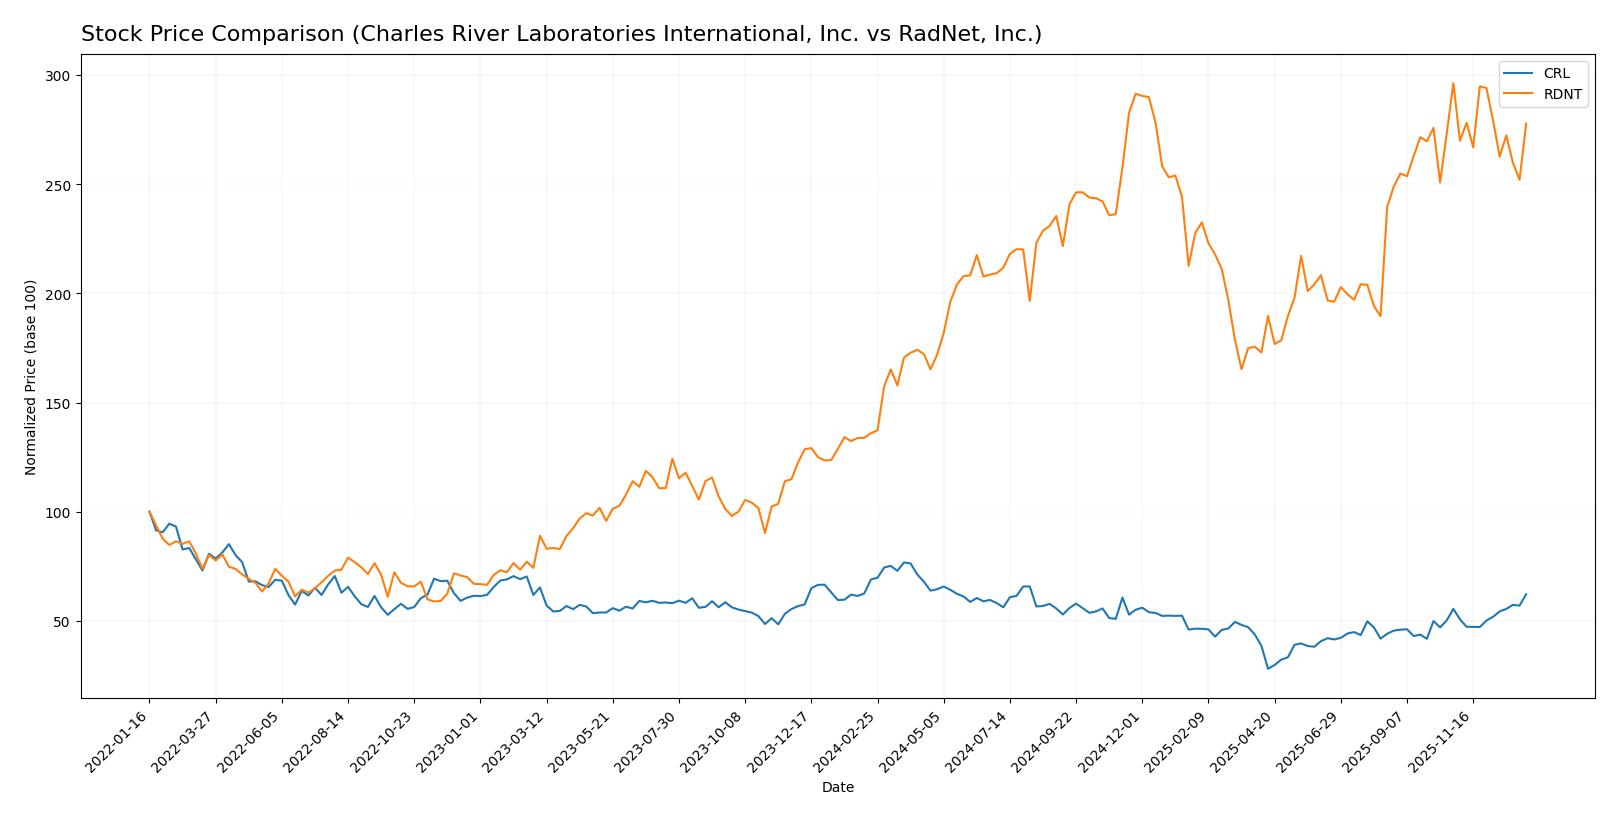
The stock price movements of Charles River Laboratories International, Inc. (CRL) and RadNet, Inc. (RDNT) over the past 12 months reveal contrasting trends, with CRL experiencing a significant overall decline and RDNT showing strong gains, albeit with recent short-term reversals.
Trend Analysis
Charles River Laboratories International, Inc. (CRL) recorded a bearish trend over the past year with a -9.82% price change, marked by accelerating decline and high volatility. Recent months show a short-term bullish rebound of +12.11%.
RadNet, Inc. (RDNT) demonstrated a bullish trend with a 104.23% price increase over 12 months, though with deceleration and a recent slight bearish correction of -6.25%. Volatility remains moderate.
Comparing both, RDNT delivered the highest market performance with a strong overall gain, while CRL experienced a notable decline despite recent recovery signs.
Target Prices
The current analyst consensus presents clear target price ranges for both Charles River Laboratories International, Inc. and RadNet, Inc.
| Company | Target High | Target Low | Consensus |
|---|---|---|---|
| Charles River Laboratories International, Inc. | 224 | 185 | 204.86 |
| RadNet, Inc. | 95 | 90 | 92.25 |
Analysts expect Charles River Laboratories’ price to be slightly above its current 220.91 USD, indicating moderate upside potential. RadNet’s consensus target price of 92.25 USD suggests notable growth from the current 78.2 USD share price.
Analyst Opinions Comparison
This section compares analysts’ ratings and grades for Charles River Laboratories International, Inc. (CRL) and RadNet, Inc. (RDNT):
Rating Comparison
CRL Rating
- Rating: C, considered Very Favorable overall
- Discounted Cash Flow Score: 4, Favorable
- Return on Equity Score: 1, Very Unfavorable
- Return on Assets Score: 1, Very Unfavorable
- Debt To Equity Score: 1, Very Unfavorable
- Overall Score: 2, Moderate
RDNT Rating
- Rating: D+, considered Very Favorable overall
- Discounted Cash Flow Score: 1, Very Unfavorable
- Return on Equity Score: 1, Very Unfavorable
- Return on Assets Score: 1, Very Unfavorable
- Debt To Equity Score: 1, Very Unfavorable
- Overall Score: 1, Very Unfavorable
Which one is the best rated?
Based strictly on the provided data, CRL holds a higher rating (C versus D+), a more favorable discounted cash flow score, and a better overall score than RDNT. Both companies share similarly low scores on return on equity, return on assets, and debt to equity.
Scores Comparison
The following table compares the Altman Z-Score and Piotroski Score of Charles River Laboratories and RadNet, indicating their financial health:
CRL Scores
- Altman Z-Score: 2.27, in the grey zone, moderate risk
- Piotroski Score: 6, average financial strength
RDNT Scores
- Altman Z-Score: 2.16, in the grey zone, moderate risk
- Piotroski Score: 2, very weak financial strength
Which company has the best scores?
Based on the provided data, CRL shows a slightly higher Altman Z-Score and a significantly stronger Piotroski Score than RDNT. CRL’s scores suggest better overall financial health compared to RDNT’s weaker Piotroski rating.
Grades Comparison
Here is a detailed comparison of the recent grades assigned to Charles River Laboratories International, Inc. and RadNet, Inc.:
Charles River Laboratories International, Inc. Grades
The table below summarizes recent analyst grades and actions for Charles River Laboratories International, Inc.
| Grading Company | Action | New Grade | Date |
|---|---|---|---|
| Mizuho | Maintain | Neutral | 2025-12-18 |
| JP Morgan | Maintain | Neutral | 2025-12-15 |
| Barclays | Maintain | Overweight | 2025-12-15 |
| Morgan Stanley | Maintain | Equal Weight | 2025-11-11 |
| TD Cowen | Maintain | Buy | 2025-11-10 |
| Baird | Upgrade | Outperform | 2025-11-06 |
| Barclays | Maintain | Overweight | 2025-11-06 |
| JP Morgan | Maintain | Neutral | 2025-11-06 |
| Mizuho | Maintain | Neutral | 2025-10-17 |
| William Blair | Upgrade | Outperform | 2025-10-06 |
Charles River Laboratories shows a stable to improving trend, with multiple maintain actions and two recent upgrades to Outperform from Market Perform and Neutral.
RadNet, Inc. Grades
The table below summarizes recent analyst grades and actions for RadNet, Inc.
| Grading Company | Action | New Grade | Date |
|---|---|---|---|
| B. Riley Securities | Maintain | Buy | 2025-12-01 |
| Barclays | Maintain | Overweight | 2025-11-13 |
| Truist Securities | Maintain | Buy | 2025-11-12 |
| Truist Securities | Maintain | Buy | 2025-09-03 |
| Barclays | Maintain | Overweight | 2025-09-03 |
| Raymond James | Maintain | Strong Buy | 2025-08-13 |
| Truist Securities | Maintain | Buy | 2025-04-11 |
| Barclays | Maintain | Overweight | 2025-03-24 |
| Raymond James | Upgrade | Strong Buy | 2025-03-05 |
| Barclays | Maintain | Overweight | 2025-01-22 |
RadNet’s grades reflect consistent buy and overweight ratings, with multiple maintain actions and an upgrade to Strong Buy earlier in the year, showing strong analyst confidence.
Which company has the best grades?
RadNet, Inc. has received consistently stronger grades, including several Strong Buy and Buy ratings, compared to Charles River Laboratories’ mix of Neutral and Overweight with fewer upgrades. This suggests RadNet may have a more favorable analyst outlook, potentially impacting investor sentiment and portfolio positioning.
Strengths and Weaknesses
Below is a comparative overview of Charles River Laboratories International, Inc. (CRL) and RadNet, Inc. (RDNT) highlighting key strengths and weaknesses based on recent financial and operational data.
| Criterion | Charles River Laboratories (CRL) | RadNet, Inc. (RDNT) |
|---|---|---|
| Diversification | Moderate; revenue spread across Discovery, Manufacturing Support, and Research Models segments | Moderate; revenues from multiple healthcare services including Commercial Insurance and Medicare |
| Profitability | Unfavorable; low net margin (0.25%), ROIC (0.95%), and declining profitability trend | Unfavorable; net margin 0.15%, ROIC 3.14%, but showing improving profitability trend |
| Innovation | Moderate; steady growth in Discovery and Safety Assessment segment | Limited insight; some growth in software and teleradiology, but overall less innovative diversification |
| Global presence | Strong; global operations in drug discovery and safety assessment | Primarily US-based healthcare services, limited global footprint |
| Market Share | Established in contract research services with consistent revenue growth | Regional player in imaging services with diversified payer mix |
Key takeaways: CRL operates with a more global and diversified revenue base but faces declining profitability and value destruction. RDNT, while less diversified globally, shows improving profitability despite current unfavorable metrics. Both require cautious evaluation for investment considering their financial challenges.
Risk Analysis
The following table summarizes key risk factors for Charles River Laboratories International, Inc. (CRL) and RadNet, Inc. (RDNT) in 2024, highlighting financial and operational vulnerabilities.
| Metric | Charles River Laboratories (CRL) | RadNet, Inc. (RDNT) |
|---|---|---|
| Market Risk | Beta 1.62, high volatility | Beta 1.51, high volatility |
| Debt level | Debt/Equity 0.79 (neutral) | Debt/Equity 1.92 (high) |
| Regulatory Risk | Moderate in healthcare sector | Moderate, imaging regulations |
| Operational Risk | Complexity in global operations | Dependence on outpatient centers |
| Environmental Risk | Moderate, lab compliance needed | Low to moderate |
| Geopolitical Risk | Low, diversified global presence | Low, US-focused |
The most impactful and likely risks are financial leverage and operational complexity. RadNet’s high debt ratio and weaker interest coverage pose greater financial risk, while Charles River faces challenges in managing international operations amid regulatory demands. Both companies operate in highly regulated healthcare sectors, requiring vigilance on compliance and market shifts.
Which Stock to Choose?
Charles River Laboratories International, Inc. (CRL) shows declining income with a 1-year revenue decrease of -1.92% and net margin near 0.25%. Its financial ratios are slightly unfavorable, with a low ROE of 0.3% and high net debt to EBITDA. The company carries moderate debt levels and a favorable quick ratio but has a very unfavorable global moat status indicating value destruction. Its rating is very favorable with a moderate overall score.
RadNet, Inc. (RDNT) exhibits favorable income growth, with a 1-year revenue increase of 13.18% and net margin around 0.15%. Financial ratios are mostly unfavorable, notably with a high debt-to-equity ratio of 1.92 and poor profitability metrics. The company’s current and quick ratios are favorable, and despite shedding value overall, its ROIC trend is growing. RDNT holds a very favorable rating but with a very unfavorable overall score.
Investors focused on growth might find RDNT’s favorable income growth and improving profitability trend appealing, while those prioritizing stronger financial stability and moderate rating might lean toward CRL, despite its unfavorable moat and income trends. The choice could depend on an investor’s tolerance for risk and preference for growth versus stability.
Disclaimer: Investment carries a risk of loss of initial capital. The past performance is not a reliable indicator of future results. Be sure to understand risks before making an investment decision.
Go Further
I encourage you to read the complete analyses of Charles River Laboratories International, Inc. and RadNet, Inc. to enhance your investment decisions: