QUALCOMM Incorporated and CEVA, Inc. are two prominent players in the semiconductor industry, each specializing in wireless connectivity and innovative technology licensing. QUALCOMM’s broad portfolio spans foundational wireless technologies and strategic investments, while CEVA focuses on digital signal processors and AI-driven smart sensing solutions. This article will analyze their market positions and innovation strategies to help you decide which company presents the most compelling investment opportunity in 2026.

Table of contents
Companies Overview
I will begin the comparison between QUALCOMM and CEVA by providing an overview of these two companies and their main differences.
QUALCOMM Overview
QUALCOMM Incorporated develops and commercializes foundational wireless technologies globally. It operates through three segments: Qualcomm CDMA Technologies, Qualcomm Technology Licensing, and Qualcomm Strategic Initiatives. The company focuses on integrated circuits, system software for wireless communications, and licensing its extensive patent portfolio. Headquartered in San Diego, California, QUALCOMM is a major player in semiconductors with a market cap of $175B and 49,000 employees.
CEVA Overview
CEVA, Inc. licenses wireless connectivity and smart sensing technologies to semiconductor and OEM companies worldwide. Its offerings include digital signal processors, AI processors, and platforms for 5G, IoT, imaging, and voice applications. With about 406 employees, CEVA is headquartered in Rockville, Maryland, and serves diverse markets including mobile, automotive, and industrial. The company has a market cap of $551M and emphasizes IP licensing and development tools.
Key similarities and differences
Both QUALCOMM and CEVA operate in the semiconductor industry, focusing on licensing and technology development related to wireless communication and smart sensing. QUALCOMM is significantly larger, with a broad product and patent licensing portfolio and investments in emerging industries, while CEVA concentrates on DSP cores, AI processors, and software platforms for specialized applications. Their business models share licensing as a core revenue source but differ in scale and market reach.
Income Statement Comparison
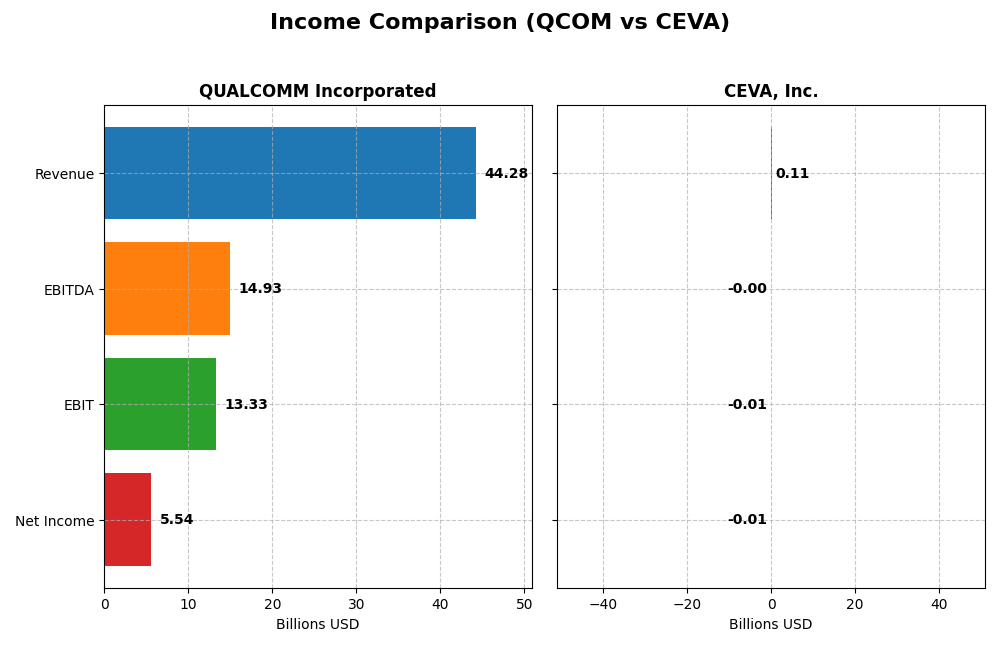
The table below compares key income statement metrics for QUALCOMM Incorporated and CEVA, Inc. for their most recent fiscal years, providing a snapshot of their financial performance.
| Metric | QUALCOMM Incorporated | CEVA, Inc. |
|---|---|---|
| Market Cap | 175.3B | 551M |
| Revenue | 44.3B | 107M |
| EBITDA | 14.9B | -3.4M |
| EBIT | 13.3B | -7.5M |
| Net Income | 5.54B | -8.79M |
| EPS | 5.06 | -0.37 |
| Fiscal Year | 2025 | 2024 |
Income Statement Interpretations
QUALCOMM Incorporated
QUALCOMM’s revenue increased steadily from $33.6B in 2021 to $44.3B in 2025, reflecting a 31.9% growth over five years. Net income, however, declined by 38.7% overall, with a sharp drop in 2025 to $5.54B from $10.1B in 2024. Margins remain strong, with a 55.4% gross margin and 30.1% EBIT margin, although net margin fell significantly in the latest year, indicating pressure on profitability despite revenue growth.
CEVA, Inc.
CEVA’s revenue showed moderate growth, rising from $100M in 2020 to $107M in 2024. The company’s net income remained negative overall, with a loss of $8.8M in 2024, though improving from a larger loss of $11.9M in 2023. CEVA maintains a very high gross margin of 88.1%, but operating and net margins remain negative. Recent improvements in EBIT and net margin growth suggest some operational progress despite ongoing losses.
Which one has the stronger fundamentals?
QUALCOMM demonstrates stronger fundamentals with significantly higher revenue scale, positive operating margins, and favorable trends in gross and EBIT margins. CEVA shows a high gross margin but continues to struggle with negative net and operating margins, although it is improving. QUALCOMM’s larger market cap and profitability contrast with CEVA’s smaller scale and ongoing net losses.
Financial Ratios Comparison
The table below presents a comparison of key financial ratios for QUALCOMM Incorporated and CEVA, Inc. based on their most recent fiscal year data.
| Ratios | QUALCOMM Incorporated (2025) | CEVA, Inc. (2024) |
|---|---|---|
| ROE | 26.13% | -3.30% |
| ROIC | 13.19% | -2.68% |
| P/E | 32.70 | -84.79 |
| P/B | 8.54 | 2.79 |
| Current Ratio | 2.82 | 7.09 |
| Quick Ratio | 2.10 | 7.09 |
| D/E (Debt-to-Equity) | 0.70 | 0.02 |
| Debt-to-Assets | 29.54% | 1.80% |
| Interest Coverage | 18.61 | 0 |
| Asset Turnover | 0.88 | 0.35 |
| Fixed Asset Turnover | 9.44 | 8.43 |
| Payout Ratio | 68.67% | 0% |
| Dividend Yield | 2.10% | 0% |
Interpretation of the Ratios
QUALCOMM Incorporated
QUALCOMM shows strong financial health with favorable net margin (12.51%), ROE (26.13%), and ROIC (13.19%), indicating efficient profitability and capital use. Liquidity ratios like current ratio (2.82) and quick ratio (2.1) are solid, though valuation metrics such as PE (32.7) and PB (8.54) are high, posing valuation concerns. The company pays dividends with a 2.1% yield, supported by a balanced payout ratio and share buybacks, maintaining coverage by free cash flow and mitigating risk of unsustainable distributions.
CEVA, Inc.
CEVA’s ratios reflect challenges, with negative net margin (-8.22%), ROE (-3.3%), and ROIC (-2.68%), signaling operational and profitability struggles. Liquidity is mixed; current ratio is very high at 7.09 but flagged unfavorable, while quick ratio is favorable at the same level. The firm holds low debt relative to assets and debt-to-equity, but interest coverage is zero, indicating financial strain. CEVA does not pay dividends, likely due to negative income and a focus on reinvestment and R&D to support growth.
Which one has the best ratios?
Based on the ratio evaluations, QUALCOMM demonstrates a more favorable financial profile with a majority of ratios indicating strength and stability, especially in profitability and liquidity. CEVA’s ratios are predominantly unfavorable, reflecting operational difficulties and lack of profitability. Thus, QUALCOMM has the better set of financial ratios when comparing these two semiconductor companies.
Strategic Positioning
This section compares the strategic positioning of QUALCOMM and CEVA, including Market position, Key segments, and disruption:
QUALCOMM
- Leading semiconductor company with significant market cap and notable competitive pressure.
- Diverse segments: QCT integrated circuits, QTL licensing, and QSI investments across industries.
- Exposure through advanced wireless tech including 3G/4G/5G, AI, and IoT in multiple sectors.
CEVA
- Smaller semiconductor licensor with lower market cap and higher beta, facing competitive pressure.
- Focused on licensing wireless connectivity and smart sensing DSP/IP technologies for IoT and mobile.
- Licensing platform technologies in AI, connectivity, and sensing for various consumer and industrial applications.
QUALCOMM vs CEVA Positioning
QUALCOMM operates diversified segments spanning chipsets, licensing, and strategic investments, offering broad industry exposure. CEVA concentrates on licensing DSP-based wireless and sensing technologies, providing niche specialization but narrower market reach.
Which has the best competitive advantage?
QUALCOMM holds a slightly favorable moat with consistent value creation despite declining ROIC, indicating sustainable competitive advantage. CEVA shows a very unfavorable moat with value destruction and steeply declining profitability, reflecting weaker competitive positioning.
Stock Comparison
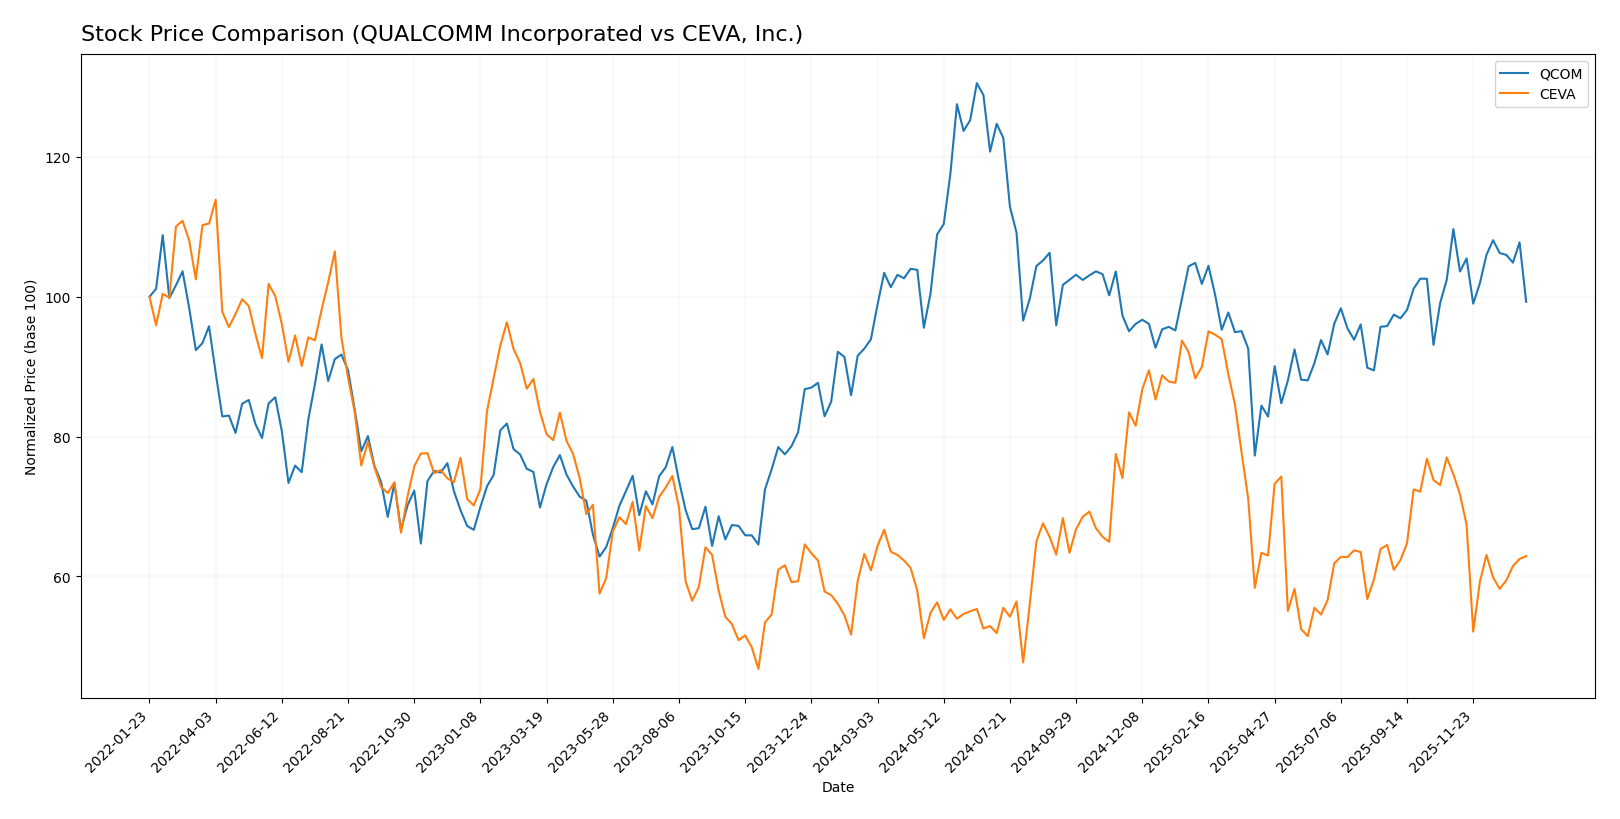
The stock price movements of QUALCOMM Incorporated and CEVA, Inc. over the past 12 months reveal distinct dynamics, with QUALCOMM showing a stronger bullish trend and higher volatility compared to CEVA’s more moderate gains and slower momentum.
Trend Analysis
QUALCOMM Incorporated’s stock experienced a 5.7% price increase over the past year, indicating a bullish trend with acceleration. The stock reached a high of 215.33 and a low of 127.46, accompanied by a high volatility level of 16.08 standard deviation.
CEVA, Inc.’s stock price rose by 3.33% in the same period, also bullish but with deceleration. Its price ranged between 17.39 and 34.67, showing lower volatility at 4.39 standard deviation.
Comparing both, QUALCOMM delivered a higher market performance with a stronger positive trend and greater price acceleration than CEVA over the past 12 months.
Target Prices
The current analyst consensus presents a positive outlook for these semiconductor companies.
| Company | Target High | Target Low | Consensus |
|---|---|---|---|
| QUALCOMM Incorporated | 210 | 165 | 185.71 |
| CEVA, Inc. | 28 | 28 | 28 |
QUALCOMM’s consensus target price of 185.71 USD suggests upside potential compared to its current price of 163.65 USD, while CEVA’s target at 28 USD indicates expected appreciation from its current 22.93 USD.
Analyst Opinions Comparison
This section compares analysts’ ratings and grades for QUALCOMM Incorporated and CEVA, Inc.:
Rating Comparison
QUALCOMM Incorporated Rating
- Rating: B+, considered very favorable by analysts.
- Discounted Cash Flow Score: 4, indicating favorable DCF.
- ROE Score: 5, very favorable efficiency in equity use.
- ROA Score: 5, very favorable asset utilization.
- Debt To Equity Score: 1, very unfavorable financial risk.
- Overall Score: 3, moderate overall financial standing.
CEVA, Inc. Rating
- Rating: C+, also labeled very favorable.
- Discounted Cash Flow Score: 3, showing moderate DCF.
- ROE Score: 1, very unfavorable equity efficiency.
- ROA Score: 1, very unfavorable asset utilization.
- Debt To Equity Score: 4, favorable financial risk.
- Overall Score: 2, moderate but lower than QUALCOMM.
Which one is the best rated?
QUALCOMM holds a stronger position with a higher rating of B+ and better scores in discounted cash flow, ROE, and ROA. CEVA has a lower rating and scores, except for a better debt-to-equity score, making QUALCOMM better rated overall.
Scores Comparison
Here is a comparison of the Altman Z-Score and Piotroski Score for the two companies:
QCOM Scores
- Altman Z-Score: 6.37, indicating a safe zone from bankruptcy risk.
- Piotroski Score: 7, reflecting strong financial health.
CEVA Scores
- Altman Z-Score: 9.99, indicating a safe zone and very low bankruptcy risk.
- Piotroski Score: 4, showing average financial strength.
Which company has the best scores?
CEVA has a higher Altman Z-Score, suggesting stronger bankruptcy safety, while QCOM has a higher Piotroski Score, indicating better overall financial health. Each shows strengths in different score categories based on the data provided.
Grades Comparison
The following presents a detailed comparison of recent grades issued by reputable grading companies for QUALCOMM Incorporated and CEVA, Inc.:
QUALCOMM Incorporated Grades
The table below summarizes recent grades from notable financial institutions for QUALCOMM Incorporated:
| Grading Company | Action | New Grade | Date |
|---|---|---|---|
| Mizuho | Downgrade | Neutral | 2026-01-09 |
| Rosenblatt | Maintain | Buy | 2025-11-06 |
| B of A Securities | Maintain | Buy | 2025-11-06 |
| Mizuho | Maintain | Outperform | 2025-11-06 |
| Wells Fargo | Maintain | Underweight | 2025-11-06 |
| Piper Sandler | Maintain | Overweight | 2025-11-06 |
| UBS | Maintain | Neutral | 2025-11-06 |
| JP Morgan | Maintain | Overweight | 2025-11-04 |
| Citigroup | Maintain | Neutral | 2025-10-28 |
| Rosenblatt | Maintain | Buy | 2025-10-28 |
QUALCOMM’s grades show a mixed but generally positive trend, with multiple Buy and Overweight ratings alongside a recent downgrade to Neutral by Mizuho.
CEVA, Inc. Grades
The following table lists recent grades from established grading companies for CEVA, Inc.:
| Grading Company | Action | New Grade | Date |
|---|---|---|---|
| Barclays | Maintain | Overweight | 2025-11-12 |
| Rosenblatt | Maintain | Buy | 2025-11-11 |
| Rosenblatt | Maintain | Buy | 2025-08-14 |
| Oppenheimer | Maintain | Outperform | 2025-05-09 |
| Rosenblatt | Maintain | Buy | 2025-05-08 |
| Barclays | Maintain | Overweight | 2025-05-08 |
| Rosenblatt | Maintain | Buy | 2025-04-23 |
| Barclays | Maintain | Overweight | 2025-02-14 |
| Rosenblatt | Maintain | Buy | 2025-02-14 |
| Rosenblatt | Maintain | Buy | 2025-02-11 |
CEVA, Inc. consistently holds strong Buy and Overweight ratings, indicating stable positive sentiment from grading companies.
Which company has the best grades?
CEVA, Inc. has received consistently strong Buy and Overweight ratings without downgrades, whereas QUALCOMM shows a broader range including Neutral and Underweight ratings with a recent downgrade. This contrast suggests CEVA may currently enjoy more uniformly positive analyst sentiment, which could influence investor confidence and perceived risk differently between the two.
Strengths and Weaknesses
Here is a comparison table summarizing the key strengths and weaknesses of QUALCOMM Incorporated (QCOM) and CEVA, Inc. (CEVA) based on their latest financial and strategic data.
| Criterion | QUALCOMM Incorporated (QCOM) | CEVA, Inc. (CEVA) |
|---|---|---|
| Diversification | Strong product segmentation with dominant QCT segment (~$38.4B in 2025) and QTL (~$5.6B) | Limited diversification, focused mainly on license and royalty revenue (~$107M combined in 2024) |
| Profitability | Favorable net margin (12.5%), ROIC (13.2%), and ROE (26.1%) indicating strong profitability | Negative net margin (-8.2%), ROIC (-2.7%), and ROE (-3.3%) reflect ongoing losses and inefficiency |
| Innovation | Consistent high fixed asset turnover (9.44) and strong R&D implied by product leadership | Innovation hampered by deteriorating profitability and declining ROIC trend |
| Global presence | Extensive global reach with high market share in mobile chipsets | Niche market player with limited scale and geographic presence |
| Market Share | Large market share supported by diversified product lines and strong brand | Small market share with value destruction and weak competitive position |
Key takeaways: QUALCOMM maintains a strong competitive position with solid profitability and diversified revenue streams, despite a slight decline in ROIC. CEVA faces significant challenges with negative profitability and value destruction, limiting its investment appeal. Investors should weigh QCOM’s stability against CEVA’s higher risk profile.
Risk Analysis
Below is a comparison table of key risks facing QUALCOMM Incorporated (QCOM) and CEVA, Inc. based on the most recent data from 2025 and 2024 respectively:
| Metric | QUALCOMM Incorporated (QCOM) | CEVA, Inc. |
|---|---|---|
| Market Risk | Beta 1.21, moderately volatile | Beta 1.44, higher volatility |
| Debt Level | Debt/Equity 0.7, moderate leverage | Debt/Equity 0.02, very low leverage |
| Regulatory Risk | Moderate, exposed to global telecom regulations | Moderate, dependent on IP licensing and standards |
| Operational Risk | Large scale with 49K employees; complex supply chains | Smaller scale (406 employees), reliance on few key clients |
| Environmental Risk | Medium, tech sector with growing ESG focus | Lower, but increasing pressure on semiconductor IP firms |
| Geopolitical Risk | High due to global supply chain and US-China tensions | Moderate, exposure to international markets and tech export controls |
QUALCOMM faces its greatest risks from geopolitical tensions impacting its supply chain and regulatory environments in the telecom industry. CEVA’s most impactful risk is operational dependence on licensing and IP enforcement, combined with weaker profitability metrics. Both companies remain financially stable, but QUALCOMM shows stronger fundamentals and risk management.
Which Stock to Choose?
QUALCOMM Incorporated (QCOM) shows favorable income growth with a 13.66% revenue increase in 2025 and positive profitability ratios including a 12.51% net margin and 26.13% ROE. The company maintains moderate debt levels with net debt to EBITDA at 0.62 and a strong current ratio of 2.82. Its rating is very favorable, supported by robust returns and stable financial health.
CEVA, Inc. (CEVA) reports a 9.77% revenue growth in 2024 but faces challenges with negative profitability, including an -8.22% net margin and -3.3% ROE. The company has minimal debt with a debt-to-equity ratio of 0.02 and a very strong current ratio of 7.09. Despite a very favorable overall rating, CEVA struggles with value creation and declining profitability.
Investors with a risk-tolerant profile or seeking growth might find QUALCOMM’s strong income evolution and favorable financial ratios appealing, while those prioritizing low debt and liquidity could view CEVA’s balance sheet strength as positive despite its current profitability challenges. The choice could depend on the investor’s tolerance for risk and preference for stability versus growth potential.
Disclaimer: Investment carries a risk of loss of initial capital. The past performance is not a reliable indicator of future results. Be sure to understand risks before making an investment decision.
Go Further
I encourage you to read the complete analyses of QUALCOMM Incorporated and CEVA, Inc. to enhance your investment decisions: