Home > Comparison > Technology > MSFT vs CCCS
The strategic rivalry between Microsoft Corporation and CCC Intelligent Solutions Holdings Inc. shapes the Technology sector’s software infrastructure landscape. Microsoft operates as a diversified tech giant with broad cloud, productivity, and personal computing platforms. In contrast, CCC focuses on specialized AI-driven SaaS solutions for the insurance economy. This analysis will evaluate which company’s operational model and growth trajectory present the superior risk-adjusted opportunity for a balanced, diversified portfolio.
Table of contents
Companies Overview
Microsoft and CCC Intelligent Solutions shape distinct corners of the software infrastructure landscape.
Microsoft Corporation: Global Software and Cloud Powerhouse
Microsoft dominates as a technology giant with a $3.2T market cap. Its core revenue engine spans Productivity and Business Processes, Intelligent Cloud, and More Personal Computing. In 2026, Microsoft sharpens its strategic focus on expanding Azure cloud services and integrating AI across enterprise software, reinforcing its position as a cloud and productivity ecosystem leader.
CCC Intelligent Solutions Holdings Inc.: Insurance Tech Innovator
CCC positions itself as a specialist in AI-driven SaaS for the property and casualty insurance economy with a $5.6B market cap. It generates revenue by digitizing workflows and connecting insurance carriers, repair shops, and manufacturers. In 2026, CCC prioritizes enhancing AI analytics and expanding its telematics and mobile platforms, aiming to deepen its niche foothold in insurance technology.
Strategic Collision: Similarities & Divergences
Both firms operate in software infrastructure but diverge sharply in focus. Microsoft embraces a broad, integrated cloud and enterprise software ecosystem, while CCC pursues a vertical, specialized SaaS approach within insurance. Their battleground centers on cloud and AI innovation, yet Microsoft’s scale and diversification contrast with CCC’s targeted niche expertise. These distinctions define contrasting investment profiles of tech behemoth versus focused sector disruptor.
Income Statement Comparison
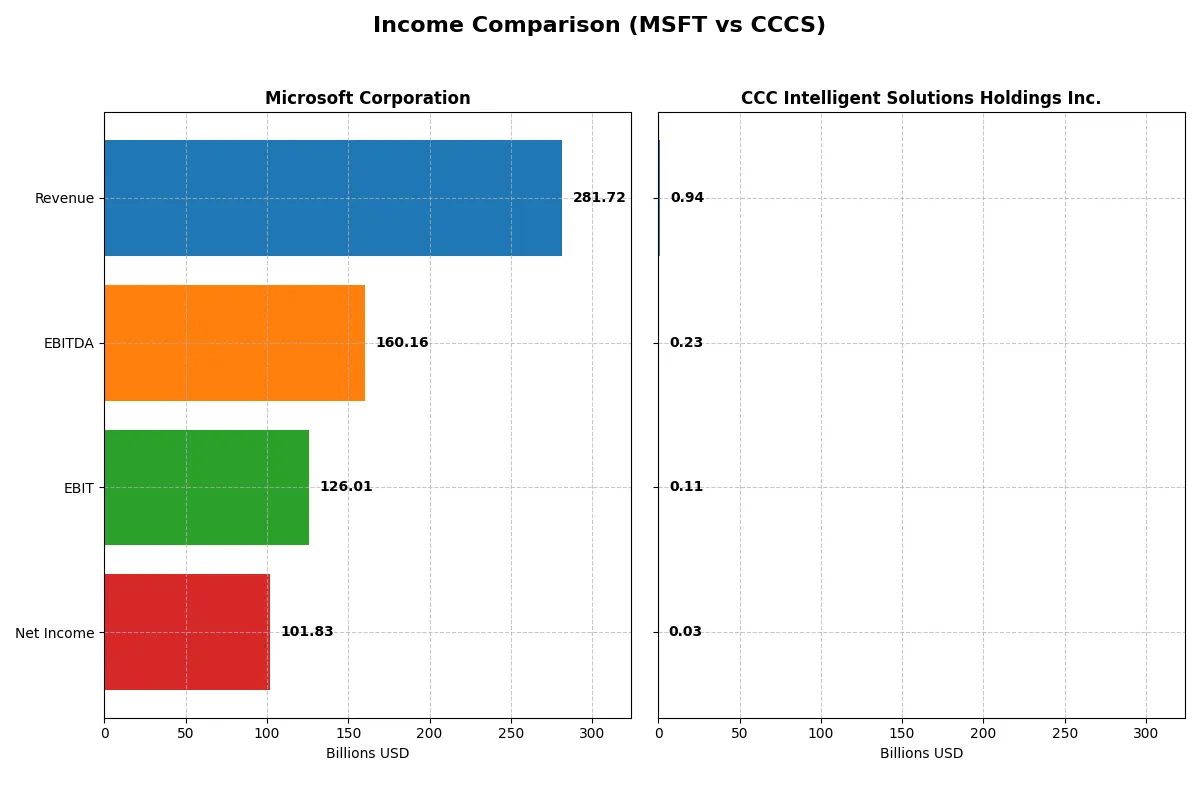
This data dissects the core profitability and scalability of both corporate engines to reveal who dominates the bottom line:
| Metric | Microsoft Corporation (MSFT) | CCC Intelligent Solutions Holdings Inc. (CCCS) |
|---|---|---|
| Revenue | 282B | 945M |
| Cost of Revenue | 88B | 231M |
| Operating Expenses | 65B | 634M |
| Gross Profit | 194B | 714M |
| EBITDA | 160B | 233M |
| EBIT | 126B | 109M |
| Interest Expense | 2.39B | 65M |
| Net Income | 102B | 26M |
| EPS | 13.7 | 0.043 |
| Fiscal Year | 2025 | 2024 |
Income Statement Analysis: The Bottom-Line Duel
The following income statement comparison reveals which company operates with superior efficiency and profit momentum in their respective markets.
Microsoft Corporation Analysis
Microsoft’s revenue surged from 168B in 2021 to 282B in 2025, reflecting strong top-line growth. Net income increased from 61B to 102B, maintaining a robust net margin near 36%. Gross margins consistently exceed 68%, showcasing operational efficiency. The 2025 fiscal year highlights sustained momentum with a 15% revenue growth and stable margin expansion, underpinned by disciplined expense management.
CCC Intelligent Solutions Holdings Inc. Analysis
CCC’s revenue advanced from 633M in 2020 to 945M in 2024, achieving a respectable 49% growth over five years. Net income swung from a -17M loss in 2020 to a positive 26M in 2024, signaling a turnaround. Gross margin remains healthy at 75%, but net margin lingers at a modest 2.8%. The 2024 year reflects a sharp improvement in profitability and EBIT growth, yet overall scale and margin depth remain limited compared to larger peers.
Scale and Margin Dominance vs. Emerging Profitability
Microsoft dominates with vast revenue scale and consistent double-digit net margins, delivering reliable profit growth and operational leverage. CCC shows promising earnings recovery and margin expansion but from a much smaller base and lower net profitability. For investors prioritizing scale and margin strength, Microsoft offers a more compelling fundamental profile. CCC appeals more to those focused on turnaround potential and growth in a niche market.
Financial Ratios Comparison
These vital ratios act as a diagnostic tool to expose the underlying fiscal health, valuation premiums, and capital efficiency of the companies compared below:
| Ratios | Microsoft Corporation (MSFT) | CCC Intelligent Solutions Holdings Inc. (CCCS) |
|---|---|---|
| ROE | 29.6% | 1.3% |
| ROIC | 22.0% | 1.9% |
| P/E | 36.3 | 274.0 |
| P/B | 10.8 | 3.6 |
| Current Ratio | 1.35 | 3.65 |
| Quick Ratio | 1.35 | 3.65 |
| D/E | 0.18 | 0.42 |
| Debt-to-Assets | 9.8% | 26.7% |
| Interest Coverage | 53.9 | 1.24 |
| Asset Turnover | 0.46 | 0.30 |
| Fixed Asset Turnover | 1.23 | 4.68 |
| Payout ratio | 23.6% | 0% |
| Dividend yield | 0.65% | 0% |
| Fiscal Year | 2025 | 2024 |
Efficiency & Valuation Duel: The Vital Signs
Financial ratios serve as a company’s DNA, uncovering hidden risks and revealing operational strengths that raw numbers alone cannot show.
Microsoft Corporation
Microsoft demonstrates robust profitability with a 29.65% ROE and a strong 36.15% net margin, signaling operational excellence. The stock trades at a stretched P/E of 36.3, indicating high market expectations. Shareholders receive modest dividends (0.65% yield), while Microsoft reinvests heavily in R&D, fueling sustained growth.
CCC Intelligent Solutions Holdings Inc.
CCCS lacks sufficient ratio data for a thorough analysis. This absence of key metrics introduces uncertainty about profitability, valuation, and financial health. Investors face challenges assessing its operational efficiency and shareholder returns without this critical information, increasing risk in portfolio decisions.
Premium Valuation vs. Data Uncertainty
Microsoft offers a clear profile of high profitability and premium valuation, balancing reward with solid operational metrics. CCCS’s missing ratio data obscures risk and return prospects, favoring investors preferring transparency and proven performance. Microsoft suits those valuing operational safety over speculative opportunity.
Which one offers the Superior Shareholder Reward?
I compare Microsoft Corporation (MSFT) and CCC Intelligent Solutions Holdings Inc. (CCCS) focusing on their shareholder return strategies. MSFT pays a steady dividend with a 0.65% yield and a sustainable 24% payout ratio, backed by strong free cash flow of 9.6B and a prudent buyback program fueling total returns. CCCS pays no dividends, reinvesting heavily in growth with modest free cash flow of 0.38B and a recent weak profitability profile. Its buyback activity is negligible, raising questions about capital allocation efficiency. Historically, MSFT’s balanced distribution, robust cash flow coverage, and disciplined buybacks offer a more reliable and attractive total return in 2026. I clearly favor MSFT for superior shareholder reward and long-term value sustainability.
Comparative Score Analysis: The Strategic Profile
The radar chart reveals the fundamental DNA and strategic trade-offs of Microsoft Corporation and CCC Intelligent Solutions Holdings Inc.:

Microsoft shows a balanced financial profile with very favorable ROE and ROA, moderate DCF and debt levels, but weaker valuation scores. CCC lacks comparable data, limiting a full side-by-side assessment. Microsoft leverages operational efficiency, while CCC’s edge remains unclear without detailed metrics.
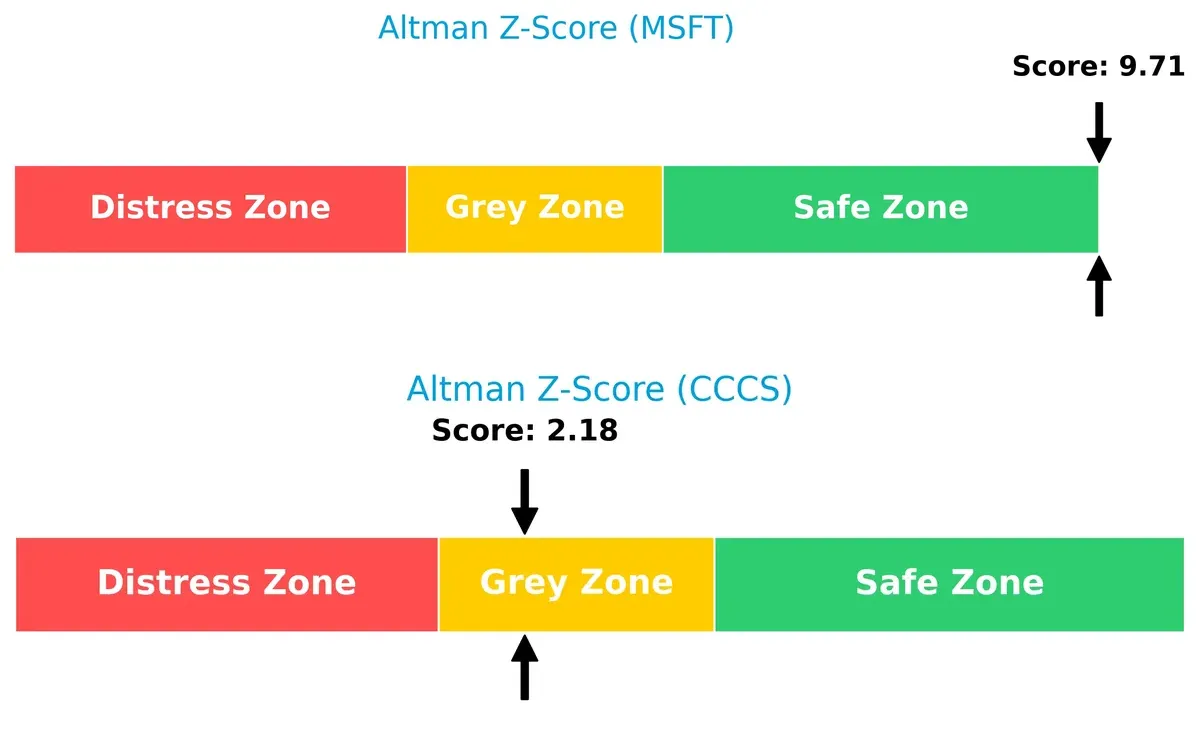
Bankruptcy Risk: Solvency Showdown
Microsoft’s Altman Z-Score of 9.7 places it firmly in the safe zone, signaling robust financial stability. CCC’s 2.2 score lands in the grey zone, indicating moderate bankruptcy risk under current market conditions:
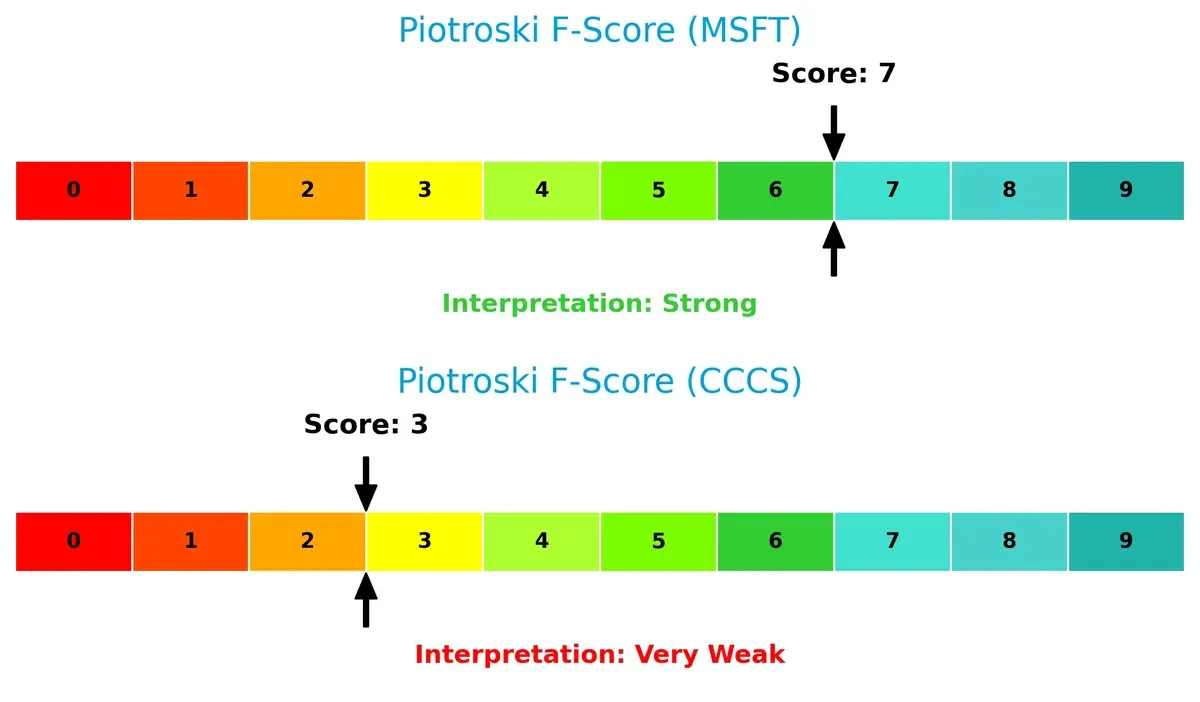
Financial Health: Quality of Operations
Microsoft’s Piotroski F-Score of 7 denotes strong financial health, reflecting solid profitability and operational efficiency. CCC’s score of 3 flags potential red flags and weaker internal financial metrics:
How are the two companies positioned?
This section dissects Microsoft and CCC Intelligent Solutions’ operational DNA by comparing their revenue distribution and internal strengths and weaknesses. The goal is to confront their economic moats to identify which model offers the most resilient competitive advantage today.
Revenue Segmentation: The Strategic Mix
This visual comparison dissects how Microsoft Corporation and CCC Intelligent Solutions Holdings diversify income streams and where their primary sector bets lie:
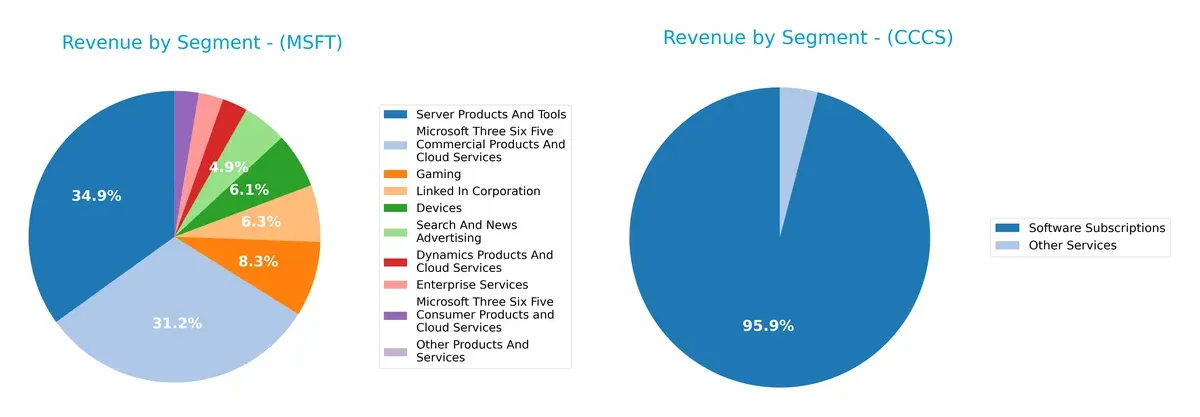
Microsoft’s revenue dwarfs CCCS, anchored by a broad portfolio including Server Products ($98B), Microsoft 365 Commercial ($87.8B), and Gaming ($23.5B). CCCS relies heavily on Software Subscriptions ($906M) with minor Other Services ($38M), reflecting a narrow focus. Microsoft’s diversified mix supports ecosystem lock-in and infrastructure dominance, while CCCS faces concentration risk with limited segment breadth in 2024.
Strengths and Weaknesses Comparison
This table compares the Strengths and Weaknesses of Microsoft Corporation and CCC Intelligent Solutions Holdings Inc.:
Microsoft Corporation Strengths
- Highly diversified revenue streams across cloud, software, devices, and advertising
- Strong global presence with significant US and non-US revenue
- Favorable profitability ratios with high net margin and ROIC
- Solid financial health with low debt and strong interest coverage
CCC Intelligent Solutions Strengths
- Focused software subscription revenue growing steadily
- Regional presence primarily in Americas with some exposure to China
Microsoft Corporation Weaknesses
- High valuation multiples with unfavorable P/E and P/B ratios
- Asset turnover below ideal levels indicating lower operational efficiency
- Dividend yield lower than typical benchmarks
CCC Intelligent Solutions Weaknesses
- Limited diversification with revenue concentrated in few segments
- Small scale revenue relative to large peers
- Lack of available financial ratios limits performance insight
Microsoft’s scale and profitability dominate, but valuation and efficiency raise caution. CCC’s narrow focus and smaller size constrain its market reach and strategic flexibility.
The Moat Duel: Analyzing Competitive Defensibility
A structural moat is the sole shield protecting long-term profits from relentless competitive erosion. Let’s dissect the core moats of these two tech players:
Microsoft Corporation: Ecosystem Lock-In
Microsoft’s moat stems from deep ecosystem lock-in, driven by its integrated cloud, software, and productivity platforms. This creates switching costs visible in its stellar 36% net margin and 13% ROIC premium over WACC. In 2026, Azure’s growth and AI integration could deepen this fortress, though its declining ROIC trend warns of rising competitive pressure.
CCC Intelligent Solutions Holdings Inc.: AI-Driven Niche Specialization
CCC’s moat lies in AI-powered workflow automation tailored to insurance and automotive sectors. Unlike Microsoft’s broad ecosystem, CCC leverages specialized SaaS and telematics to command a 75% gross margin and rapid net income growth. Expansion into international markets and deeper AI analytics offers upside, but a modest 2.8% net margin signals room to strengthen profitability.
Ecosystem Lock-In vs. AI Niche Specialization: Who Defends Better?
Microsoft’s entrenched ecosystem creates a wider moat with robust cash flow and diversified global reach. CCC’s AI specialization offers a narrower but fast-growing moat. Ultimately, Microsoft is better positioned to defend market share against broad competitive threats, while CCC must scale profitability to solidify its niche defense.
Which stock offers better returns?
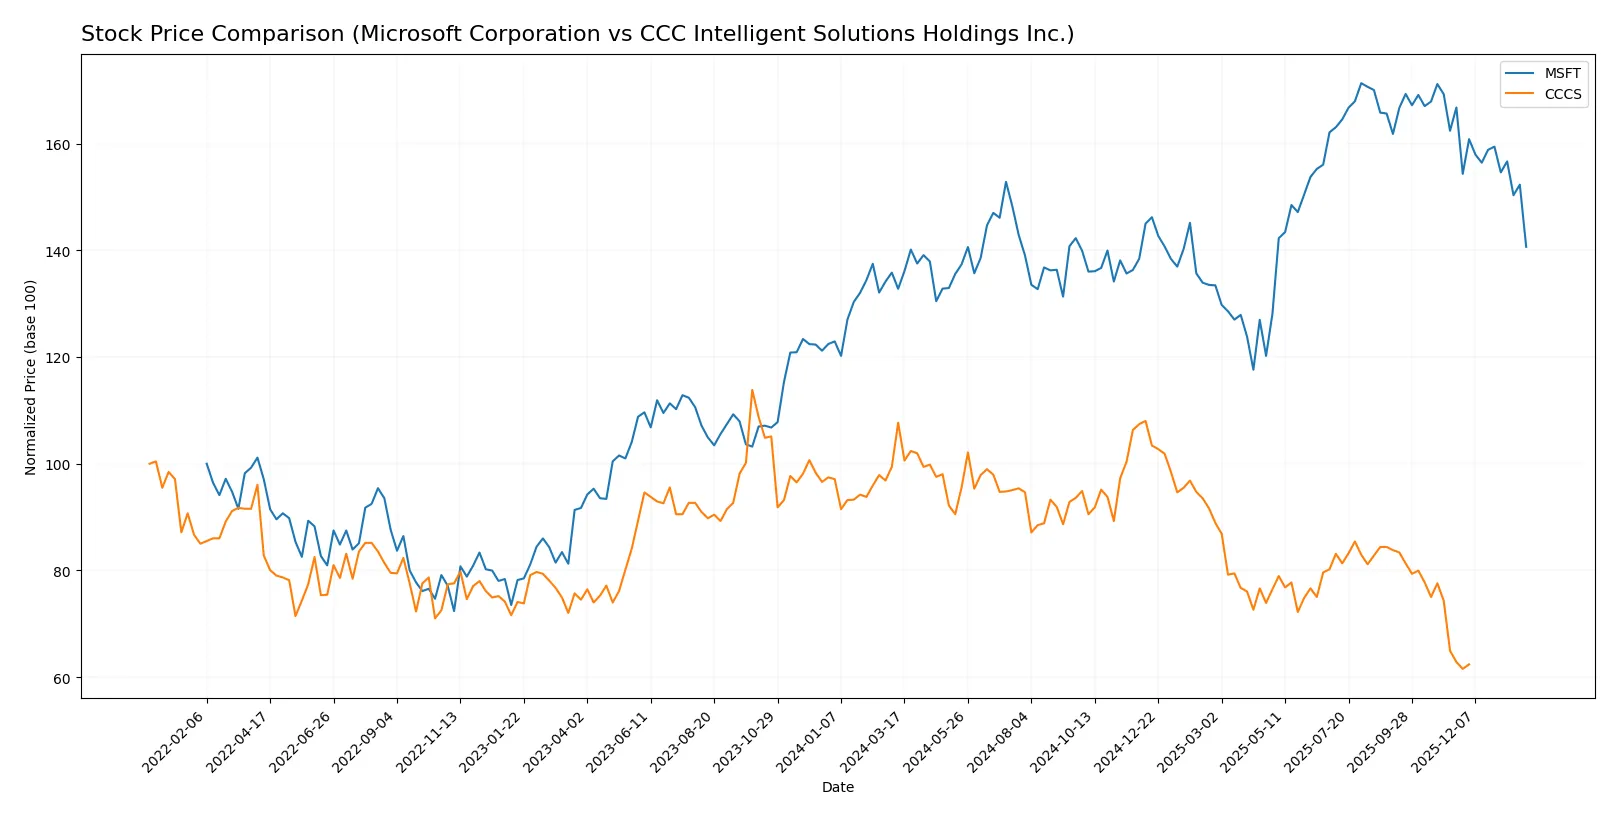
The past year shows Microsoft’s price rising steadily before recent weakening, while CCC Intelligent Solutions experienced a pronounced decline with limited recovery.
Trend Comparison
Microsoft’s stock price increased 5.93% over the past year, indicating a bullish trend with decelerating momentum. The price ranged between 359.84 and 524.11, showing notable volatility (std dev 41.93).
CCC Intelligent Solutions fell 31.78% over the same period, confirming a bearish trend with deceleration. Its price fluctuated narrowly between 7.22 and 12.67, with very low volatility (std dev 1.24).
Microsoft outperformed CCC Intelligent Solutions significantly, delivering the highest market returns and stronger price appreciation in the last 12 months.
Target Prices
Analysts present a bullish consensus for Microsoft Corporation and CCC Intelligent Solutions Holdings Inc.
| Company | Target Low | Target High | Consensus |
|---|---|---|---|
| Microsoft Corporation | 450 | 675 | 600.04 |
| CCC Intelligent Solutions | 11 | 11 | 11 |
Microsoft’s target consensus at 600 significantly exceeds its current price near 430, indicating strong upside potential. CCC’s target price of 11 also suggests appreciation from its current level around 8.75.

Don’t Let Luck Decide Your Entry Point
Optimize your entry points with our advanced ProRealTime indicators. You’ll get efficient buy signals with precise price targets for maximum performance. Start outperforming now!
How do institutions grade them?
The institutional grades for Microsoft Corporation and CCC Intelligent Solutions Holdings Inc. are as follows:
Microsoft Corporation Grades
Here are the latest grades from major financial institutions for Microsoft Corporation:
| Grading Company | Action | New Grade | Date |
|---|---|---|---|
| Citigroup | Maintain | Buy | 2026-01-30 |
| Wells Fargo | Maintain | Overweight | 2026-01-29 |
| Wedbush | Maintain | Outperform | 2026-01-29 |
| Scotiabank | Maintain | Sector Outperform | 2026-01-29 |
| RBC Capital | Maintain | Outperform | 2026-01-29 |
| Stifel | Maintain | Buy | 2026-01-29 |
| Evercore ISI Group | Maintain | Outperform | 2026-01-29 |
| Keybanc | Maintain | Overweight | 2026-01-29 |
| Piper Sandler | Maintain | Overweight | 2026-01-29 |
| Cantor Fitzgerald | Maintain | Overweight | 2026-01-29 |
Which company has the best grades?
Microsoft Corporation holds a consistent set of strong grades from reputable institutions, while CCC Intelligent Solutions has no available grades. This disparity may influence investor confidence and market perception significantly.
Risks specific to each company
These categories identify the critical pressure points and systemic threats facing both firms in the 2026 market environment:
1. Market & Competition
Microsoft Corporation
- Dominates global cloud and software infrastructure markets with a diversified portfolio and strong brand moat.
CCC Intelligent Solutions Holdings Inc.
- Faces intense competition in niche insurance tech SaaS, a rapidly evolving and fragmented market.
2. Capital Structure & Debt
Microsoft Corporation
- Maintains low debt-to-equity (0.18) and strong interest coverage (52.84), signaling conservative leverage and financial stability.
CCC Intelligent Solutions Holdings Inc.
- Limited data on debt metrics; unknown leverage heightens risk assessment uncertainty.
3. Stock Volatility
Microsoft Corporation
- Beta of 1.073 indicates market-level volatility, manageable within a large-cap tech giant framework.
CCC Intelligent Solutions Holdings Inc.
- Beta of 0.721 suggests lower volatility but thin trading volume raises liquidity concerns.
4. Regulatory & Legal
Microsoft Corporation
- Subject to global antitrust scrutiny and data privacy regulations; scale offers legal resources to manage risks.
CCC Intelligent Solutions Holdings Inc.
- Operates in regulated insurance tech space; less global exposure but compliance costs may be rising.
5. Supply Chain & Operations
Microsoft Corporation
- Complex global supply chains for hardware and cloud infrastructure; historically resilient with diversified suppliers.
CCC Intelligent Solutions Holdings Inc.
- Smaller, more focused operations potentially vulnerable to disruptions in tech and insurance ecosystems.
6. ESG & Climate Transition
Microsoft Corporation
- Industry leader in ESG initiatives and carbon neutrality commitments, enhancing long-term sustainability.
CCC Intelligent Solutions Holdings Inc.
- ESG data limited; smaller firm may face challenges adapting to evolving climate and social governance standards.
7. Geopolitical Exposure
Microsoft Corporation
- Faces risks from US-China tensions and global trade policies affecting cloud and software services.
CCC Intelligent Solutions Holdings Inc.
- Primarily US-focused, reducing geopolitical risk but limiting global growth opportunities.
Which company shows a better risk-adjusted profile?
Microsoft’s dominant market position, conservative capital structure, and strong financial scores create a more resilient risk-adjusted profile. CCC Intelligent Solutions, while innovative, suffers from limited financial transparency and higher operational vulnerabilities. Microsoft’s Altman Z-score (9.7, safe zone) versus CCC’s (2.18, grey zone) underscores this disparity. The most impactful risk for Microsoft is regulatory/legal pressures, while CCC’s key risk stems from financial uncertainty and competitive market dynamics. Recent data reveal Microsoft’s strong interest coverage and leverage management, reinforcing my confidence despite valuation concerns.
Final Verdict: Which stock to choose?
Microsoft Corporation’s superpower lies in its unmatched ability to convert invested capital into high returns, consistently creating shareholder value. Its declining ROIC trend is a point of vigilance but does not overshadow its robust cash flow generation. It fits well in an aggressive growth portfolio aiming for market leadership.
CCC Intelligent Solutions offers a strategic moat through niche market specialization and steady revenue growth. Its higher current ratio signals better near-term liquidity compared to Microsoft. However, its financial distress signals and weaker profitability suggest it suits a speculative or turnaround-focused portfolio.
If you prioritize durable competitive advantage and cash generation, Microsoft outshines as the compelling choice due to its strong ROIC and financial stability. However, if you seek high-risk, high-reward potential in a smaller, niche player, CCC Intelligent Solutions offers a speculative scenario with growth opportunities but significant risks.
Disclaimer: Investment carries a risk of loss of initial capital. The past performance is not a reliable indicator of future results. Be sure to understand risks before making an investment decision.
Go Further
I encourage you to read the complete analyses of Microsoft Corporation and CCC Intelligent Solutions Holdings Inc. to enhance your investment decisions: