In the dynamic world of technology, Cadence Design Systems, Inc. (CDNS) and The Trade Desk, Inc. (TTD) stand out as influential players driving innovation in software applications. Cadence excels in integrated circuit design and verification, while The Trade Desk pioneers data-driven digital advertising platforms. Despite operating in different niches, both companies compete for investor attention due to their market impact and growth potential. This article will help you decide which company is the more compelling investment choice in 2026.

Table of contents
Companies Overview
I will begin the comparison between Cadence Design Systems and The Trade Desk by providing an overview of these two companies and their main differences.
Cadence Design Systems Overview
Cadence Design Systems, Inc. focuses on providing software, hardware, and services for integrated circuit design and verification. Headquartered in San Jose, California, Cadence serves markets including 5G communications, aerospace, automotive, and healthcare. The company’s offerings span digital IC design, custom IC simulation, and intellectual property products, positioning it as a key player in semiconductor design automation.
The Trade Desk Overview
The Trade Desk, Inc. operates a cloud-based platform enabling buyers to manage data-driven digital advertising campaigns across various formats and devices. Based in Ventura, California, The Trade Desk serves advertising agencies and service providers, facilitating programmatic advertising globally. Founded in 2009, it emphasizes self-service technology for optimization of display, video, audio, native, and social advertising.
Key similarities and differences
Both companies operate in the technology sector under software applications but serve distinct markets. Cadence Design Systems targets semiconductor and electronics design automation, offering hardware and software solutions for chip verification. In contrast, The Trade Desk focuses on digital advertising technology via a cloud platform. While both emphasize innovation and technology, their business models differ significantly, with Cadence centered on semiconductor tools and The Trade Desk on programmatic ad buying.
Income Statement Comparison
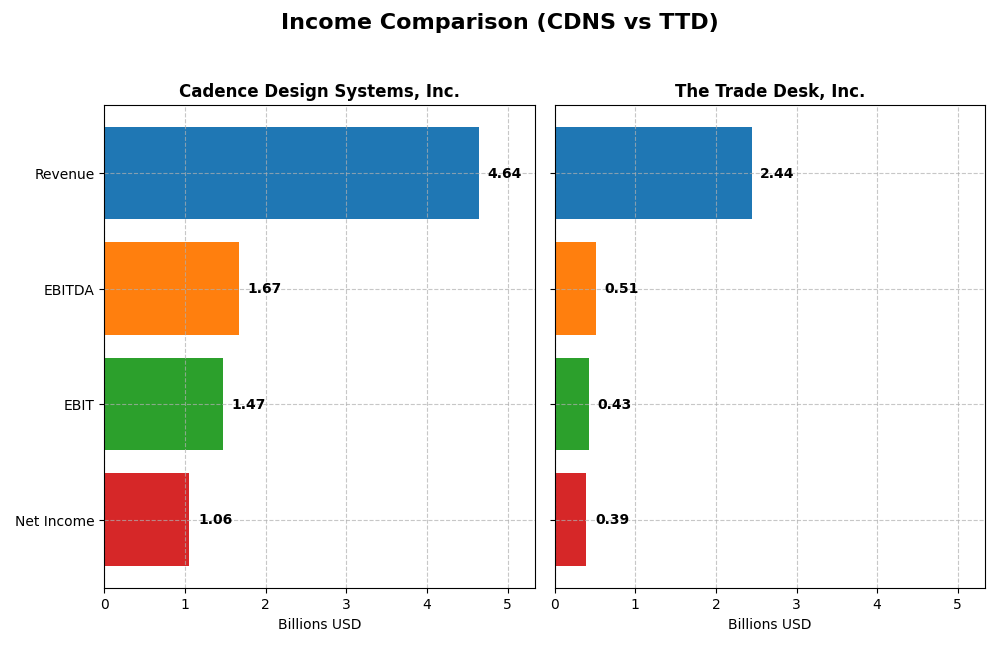
The following table presents a side-by-side comparison of key income statement metrics for Cadence Design Systems, Inc. and The Trade Desk, Inc. for the fiscal year 2024.
| Metric | Cadence Design Systems, Inc. | The Trade Desk, Inc. |
|---|---|---|
| Market Cap | 86.4B | 17.3B |
| Revenue | 4.64B | 2.44B |
| EBITDA | 1.67B | 515M |
| EBIT | 1.47B | 427M |
| Net Income | 1.06B | 393M |
| EPS | 3.89 | 0.80 |
| Fiscal Year | 2024 | 2024 |
Income Statement Interpretations
Cadence Design Systems, Inc.
Cadence Design Systems exhibited strong growth from 2020 to 2024, with revenue rising from $2.68B to $4.64B and net income increasing from $591M to $1.06B. Gross and EBIT margins remained favorable around 86% and 32%, respectively, indicating stable profitability. The 2024 year showed solid revenue growth of 13.5%, though net margin slightly declined by 10.7%, reflecting some pressure on overall profitability.
The Trade Desk, Inc.
The Trade Desk’s revenue soared from $836M in 2020 to $2.44B in 2024, with net income growing from $242M to $393M. Margins remained favorable, with gross margin around 81% and EBIT margin at 17.5%. The 2024 fiscal year featured exceptional revenue growth of 25.6% and an impressive 74.9% increase in net margin, highlighting significant improvements in operational efficiency and profitability.
Which one has the stronger fundamentals?
Both companies show favorable income statement evaluations, but The Trade Desk demonstrates higher revenue growth and stronger recent improvements in net margin and EPS growth. Cadence Design Systems maintains higher margins and consistent profitability. While Cadence offers margin stability, The Trade Desk’s rapid growth and expanding margins suggest a dynamic fundamental profile based on recent income statement trends.
Financial Ratios Comparison
The table below compares key financial ratios for Cadence Design Systems, Inc. (CDNS) and The Trade Desk, Inc. (TTD) for the most recent fiscal year 2024.
| Ratios | Cadence Design Systems, Inc. (CDNS) | The Trade Desk, Inc. (TTD) |
|---|---|---|
| ROE | 22.6% | 13.3% |
| ROIC | 13.4% | 10.0% |
| P/E | 77.2 | 146.8 |
| P/B | 17.4 | 19.6 |
| Current Ratio | 2.93 | 1.86 |
| Quick Ratio | 2.74 | 1.86 |
| D/E (Debt to Equity) | 0.55 | 0.11 |
| Debt-to-Assets | 28.8% | 5.1% |
| Interest Coverage | 17.8 | 0 (no data) |
| Asset Turnover | 0.52 | 0.40 |
| Fixed Asset Turnover | 7.68 | 5.17 |
| Payout Ratio | 0% | 0% |
| Dividend Yield | 0% | 0% |
Interpretation of the Ratios
Cadence Design Systems, Inc.
Cadence shows strong profitability with a favorable net margin of 22.74% and a robust return on equity at 22.58%. Liquidity ratios are solid, with a current ratio of 2.93 and quick ratio of 2.74, indicating good short-term financial health. However, high valuation multiples like a PE of 77.2 and PB of 17.44 raise concerns. Cadence does not pay dividends, likely reinvesting earnings to support growth.
The Trade Desk, Inc.
The Trade Desk has a favorable net margin of 16.08% and a decent return on invested capital at 10.02%, though its ROE is neutral at 13.33%. Liquidity is sound with current and quick ratios near 1.86, and debt levels are low, supporting financial stability. The company’s high PE of 146.77 and PB of 19.56 suggest elevated valuation. Like Cadence, The Trade Desk pays no dividends, focusing on reinvestment and expansion.
Which one has the best ratios?
Both companies have a favorable overall ratio profile with 57.14% favorable ratios. Cadence excels in profitability and liquidity but faces valuation concerns. The Trade Desk shows strong liquidity and low debt but weaker asset turnover and higher valuation multiples. Overall, both present strengths and weaknesses, with neither clearly outperforming across all financial metrics.
Strategic Positioning
This section compares the strategic positioning of Cadence Design Systems, Inc. and The Trade Desk, Inc., focusing on market position, key segments, and exposure to technological disruption:
Cadence Design Systems, Inc.
- Leading in software for IC design with strong market presence and moderate competitive pressure.
- Focuses on IC design software, hardware, and services for multiple industries including 5G and aerospace.
- Moderate exposure; relies on advanced verification and design tools, adapting to evolving semiconductor needs.
The Trade Desk, Inc.
- Operates a cloud-based platform for digital advertising facing intense competition.
- Specializes in data-driven digital advertising across multiple channels and devices.
- High exposure; operates in rapidly evolving digital ad tech requiring constant innovation.
Cadence Design Systems, Inc. vs The Trade Desk, Inc. Positioning
Cadence offers a diversified product portfolio across multiple tech segments, providing stability but facing a complex market. The Trade Desk concentrates on digital advertising technology, which may offer growth but faces high volatility and competitive risk.
Which has the best competitive advantage?
Cadence shows a slightly favorable moat with value creation despite declining profitability, while The Trade Desk has a slightly unfavorable moat and is shedding value, indicating Cadence currently holds a stronger competitive advantage.
Stock Comparison
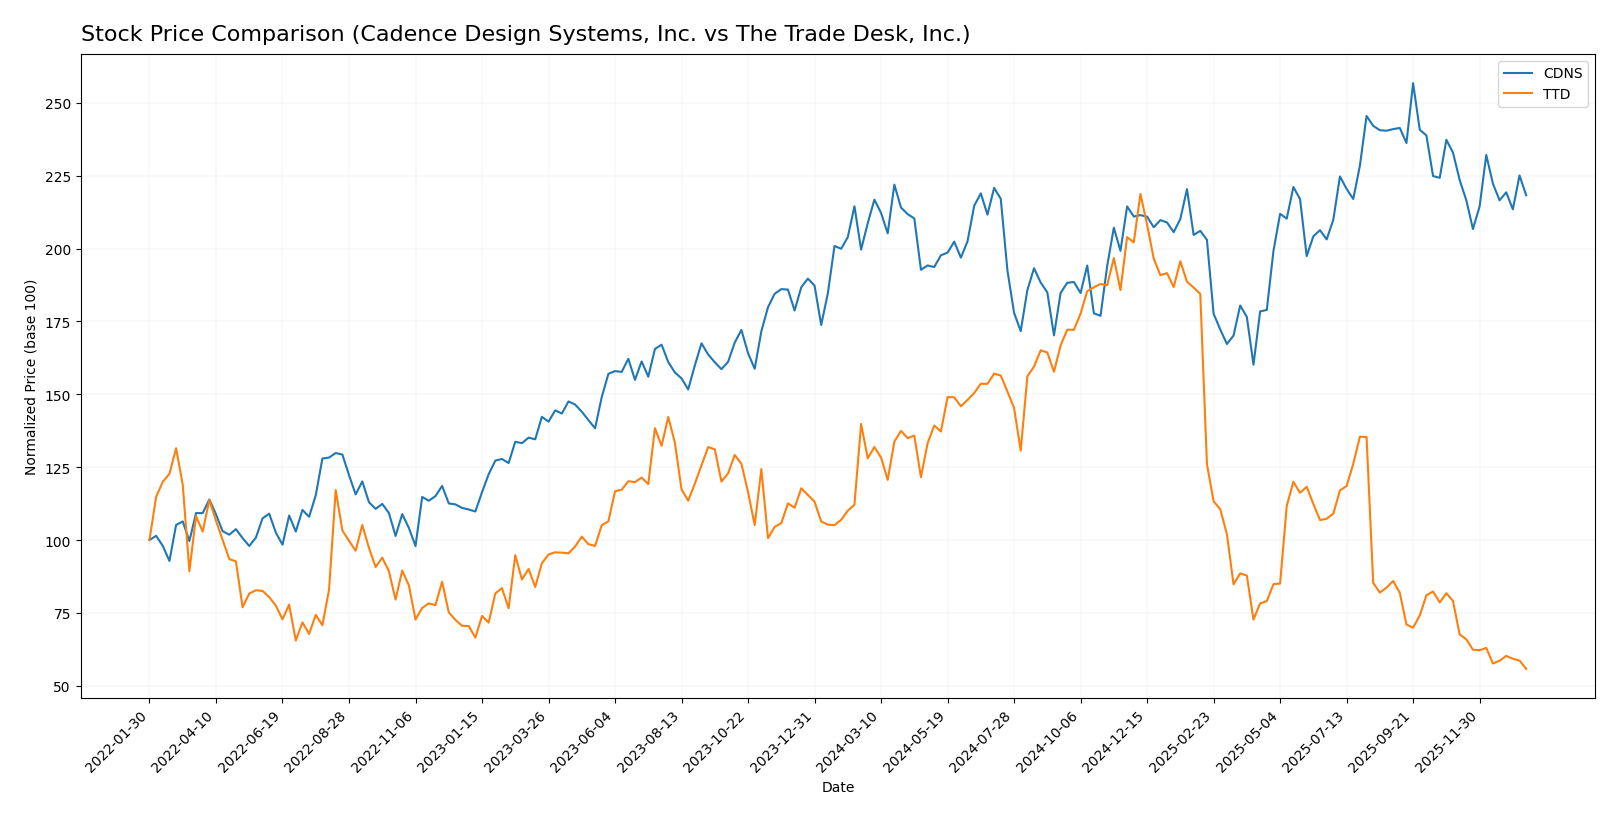
Key price movements over the past year reveal a bullish trend for Cadence Design Systems, Inc. (CDNS) with moderate deceleration, contrasted by a sharply bearish trend for The Trade Desk, Inc. (TTD) amid sustained deceleration.
Trend Analysis
Cadence Design Systems, Inc. (CDNS) exhibited a 4.59% price increase over the past 12 months, indicating a bullish trend with deceleration. The stock fluctuated between 232.88 and 373.35, with recent months showing a slight negative slope of -0.55.
The Trade Desk, Inc. (TTD) faced a 56.43% decline over the same period, confirming a bearish trend with deceleration. Prices ranged from 35.48 to 139.11, with recent performance worsening at a slope of -0.91.
Comparing both, CDNS delivered the highest market performance over the past year, outperforming TTD’s significant bearish trend.
Target Prices
Here is the current consensus on target prices from verified analysts for selected companies.
| Company | Target High | Target Low | Consensus |
|---|---|---|---|
| Cadence Design Systems, Inc. | 418 | 275 | 381 |
| The Trade Desk, Inc. | 98 | 39 | 56.73 |
Analysts expect Cadence Design Systems’ stock to trade above its current price of $317.45, indicating bullish sentiment. The Trade Desk’s consensus target of $56.73 also suggests significant upside from its current $35.48 level.
Analyst Opinions Comparison
This section compares analysts’ ratings and financial scores for Cadence Design Systems, Inc. (CDNS) and The Trade Desk, Inc. (TTD):
Rating Comparison
CDNS Rating
- Rating: B, considered Very Favorable by analysts.
- Discounted Cash Flow Score: 3, Moderate valuation.
- ROE Score: 4, Favorable return on equity metric.
- ROA Score: 5, Very Favorable asset utilization.
- Debt To Equity Score: 2, Moderate financial risk.
- Overall Score: 3, Moderate overall financial score.
TTD Rating
- Rating: B, also rated Very Favorable overall.
- Discounted Cash Flow Score: 4, viewed as Favorable.
- ROE Score: 4, equally Favorable on return on equity.
- ROA Score: 4, Favorable but lower than CDNS.
- Debt To Equity Score: 3, moderate but stronger balance sheet.
- Overall Score: 3, same Moderate overall score.
Which one is the best rated?
Both CDNS and TTD share the same overall rating of B and an overall score of 3, indicating moderate financial strength. CDNS excels in asset utilization (ROA), whereas TTD has a more favorable discounted cash flow score and a stronger debt-to-equity position.
Scores Comparison
Here is a comparison of the Altman Z-Score and Piotroski Score for Cadence Design Systems, Inc. and The Trade Desk, Inc.:
CDNS Scores
- Altman Z-Score: 14.51, indicating a strong safe zone.
- Piotroski Score: 7, reflecting strong financial health.
TTD Scores
- Altman Z-Score: 4.30, also in the safe zone.
- Piotroski Score: 5, indicating average financial health.
Which company has the best scores?
Cadence Design Systems exhibits higher scores in both Altman Z-Score and Piotroski Score, indicating stronger financial stability and health compared to The Trade Desk based on the provided data.
Grades Comparison
Here is the detailed grades comparison of Cadence Design Systems, Inc. and The Trade Desk, Inc.:
Cadence Design Systems, Inc. Grades
The table below shows recent grades and actions from notable grading companies for Cadence Design Systems, Inc.
| Grading Company | Action | New Grade | Date |
|---|---|---|---|
| Needham | Maintain | Buy | 2025-12-22 |
| Wells Fargo | Maintain | Overweight | 2025-10-28 |
| Baird | Maintain | Outperform | 2025-10-28 |
| Needham | Maintain | Buy | 2025-10-28 |
| JP Morgan | Maintain | Overweight | 2025-10-28 |
| Oppenheimer | Maintain | Underperform | 2025-10-28 |
| Rosenblatt | Maintain | Neutral | 2025-10-28 |
| Rosenblatt | Maintain | Neutral | 2025-10-22 |
| Needham | Maintain | Buy | 2025-07-29 |
| Loop Capital | Maintain | Buy | 2025-07-29 |
Cadence Design Systems exhibits a predominantly positive outlook with multiple “Buy,” “Overweight,” and “Outperform” ratings, though a few neutral and one underperform grade indicate some analyst caution.
The Trade Desk, Inc. Grades
The table below shows recent grades and actions from notable grading companies for The Trade Desk, Inc.
| Grading Company | Action | New Grade | Date |
|---|---|---|---|
| Morgan Stanley | Maintain | Equal Weight | 2026-01-13 |
| Wells Fargo | Maintain | Equal Weight | 2026-01-12 |
| Cantor Fitzgerald | Maintain | Neutral | 2026-01-08 |
| Wolfe Research | Maintain | Outperform | 2026-01-06 |
| Guggenheim | Maintain | Buy | 2026-01-05 |
| Jefferies | Maintain | Hold | 2025-12-11 |
| Wedbush | Maintain | Neutral | 2025-12-08 |
| DA Davidson | Maintain | Buy | 2025-11-10 |
| Truist Securities | Maintain | Buy | 2025-11-07 |
| Wells Fargo | Maintain | Equal Weight | 2025-11-07 |
The Trade Desk’s grades indicate a mixed but generally positive stance, with several “Buy” and “Outperform” ratings balanced by multiple “Equal Weight,” “Neutral,” and “Hold” assessments.
Which company has the best grades?
Cadence Design Systems, Inc. has received more consistently positive grades, with a larger proportion of “Buy,” “Overweight,” and “Outperform” ratings compared to The Trade Desk, Inc., which shows a more cautious consensus. This difference may suggest varying analyst confidence levels, potentially impacting investor sentiment and risk appetite.
Strengths and Weaknesses
Below is a summary table comparing the key strengths and weaknesses of Cadence Design Systems, Inc. (CDNS) and The Trade Desk, Inc. (TTD) based on their financial performance, innovation, market position, and global footprint as of 2026.
| Criterion | Cadence Design Systems, Inc. (CDNS) | The Trade Desk, Inc. (TTD) |
|---|---|---|
| Diversification | Moderate: Primarily software & technology services; steady growth in product and maintenance revenue (4.2B in 2024) | Narrower focus on digital advertising platform; lacks product segmentation data |
| Profitability | High profitability with 22.7% net margin and 13.4% ROIC; creating value but with declining ROIC trend | Moderate profitability with 16.1% net margin and 10.0% ROIC; currently shedding value with declining ROIC |
| Innovation | Strong innovation in EDA tools, maintaining competitive edge but facing margin pressure | Growing innovation in programmatic advertising, but profitability challenges persist |
| Global presence | Established global presence in semiconductor and software markets | Expanding global reach in digital advertising, but smaller scale compared to CDNS |
| Market Share | Solid market share in electronic design automation software | Leading in programmatic ad buying but highly competitive industry |
Key takeaways: Cadence Design Systems demonstrates robust profitability and a strong market position with diversified software offerings, though profitability shows signs of deceleration. The Trade Desk holds a niche in digital advertising with solid margins but is currently facing value erosion and higher competitive risks. Investors should weigh CDNS’s stable value creation against TTD’s growth potential tempered by profitability concerns.
Risk Analysis
Below is a summary table comparing the key risks for Cadence Design Systems, Inc. (CDNS) and The Trade Desk, Inc. (TTD) based on the most recent data from 2024.
| Metric | Cadence Design Systems, Inc. (CDNS) | The Trade Desk, Inc. (TTD) |
|---|---|---|
| Market Risk | Moderate (Beta 1.02) | Moderate (Beta 1.11) |
| Debt Level | Moderate (Debt/Equity 0.55) | Low (Debt/Equity 0.11) |
| Regulatory Risk | Medium due to global tech compliance | Medium, digital advertising regulations evolving |
| Operational Risk | Moderate (complex IC design products) | Moderate (platform reliability and data privacy) |
| Environmental Risk | Low (software sector, limited footprint) | Low (software platform, minimal direct impact) |
| Geopolitical Risk | Medium (global semiconductor supply chains) | Medium (global ad markets, data flow restrictions) |
The most likely and impactful risks are market fluctuations and regulatory changes. Cadence faces challenges in semiconductor design amid global supply chain uncertainties. The Trade Desk must navigate evolving digital advertising regulations and data privacy laws. Both companies have manageable debt and strong financial health, but investors should watch regulatory and geopolitical developments closely.
Which Stock to Choose?
Cadence Design Systems, Inc. (CDNS) shows a favorable income evolution with strong revenue and net income growth over 2020-2024. Its financial ratios are mostly favorable, including a high net margin of 22.74% and return on equity of 22.58%. The company maintains moderate debt levels with a debt-to-assets ratio of 28.8%, and its rating is very favorable with a B grade.
The Trade Desk, Inc. (TTD) has experienced robust revenue growth, outperforming CDNS in one-year revenue increase at 25.63%, with favorable net margin and operating metrics. Its financial ratios are also largely favorable, though with a lower return on equity of 13.33% and significantly lower debt levels at 5.11% debt-to-assets. The rating is similarly very favorable with a B grade.
For investors prioritizing growth and stronger profitability, CDNS might appear more attractive given its higher returns and consistent value creation despite a slight decline in ROIC. Conversely, TTD’s sharper revenue growth and lower leverage may appeal to those who favor a growth profile with lower debt exposure, though its economic moat appears slightly unfavorable. Thus, the choice could depend on the investor’s risk tolerance and focus on profitability versus growth dynamics.
Disclaimer: Investment carries a risk of loss of initial capital. The past performance is not a reliable indicator of future results. Be sure to understand risks before making an investment decision.
Go Further
I encourage you to read the complete analyses of Cadence Design Systems, Inc. and The Trade Desk, Inc. to enhance your investment decisions: