In the dynamic world of software applications, Cadence Design Systems, Inc. and ServiceTitan, Inc. stand out with distinct yet overlapping market approaches. Cadence leads in integrated circuit design and verification, serving high-tech industries, while ServiceTitan specializes in field service software for infrastructure maintenance. Both companies drive innovation in their niches, making them compelling contenders. This article will help you decide which company holds the most promise for your investment portfolio.
Table of contents
Companies Overview
I will begin the comparison between Cadence Design Systems, Inc. and ServiceTitan, Inc. by providing an overview of these two companies and their main differences.
Cadence Design Systems Overview
Cadence Design Systems, Inc. specializes in software, hardware, and services for integrated circuit (IC) design and verification globally. Its offerings include platforms for functional verification, digital IC design, physical implementation, and system design products, serving markets such as 5G communications, aerospace, automotive, and healthcare. Founded in 1987 and headquartered in San Jose, CA, Cadence employs over 12K people and is a major player in the technology software application sector.
ServiceTitan Overview
ServiceTitan, Inc. focuses on software solutions for managing field service operations related to the installation, maintenance, and servicing of residential and commercial infrastructure. Founded in 2008 and based in Glendale, CA, the company has grown to employ around 3K people. ServiceTitan operates in the technology sector with a concentration on software applications that streamline service workflows and improve operational efficiency in field services.
Key similarities and differences
Both companies operate in the software application industry within the technology sector and are publicly traded on NASDAQ. Cadence targets integrated circuit design and verification markets with complex hardware-software platforms, while ServiceTitan delivers field service management software primarily for residential and commercial infrastructure. Cadence’s business is more hardware-integrated and diversified across industries, whereas ServiceTitan focuses on niche service operations management, reflecting distinct business models within the broader software domain.
Income Statement Comparison
This table presents a side-by-side comparison of key income statement metrics for Cadence Design Systems, Inc. and ServiceTitan, Inc. based on their most recent fiscal year data.
| Metric | Cadence Design Systems, Inc. | ServiceTitan, Inc. |
|---|---|---|
| Market Cap | 86.4B | 8.5B |
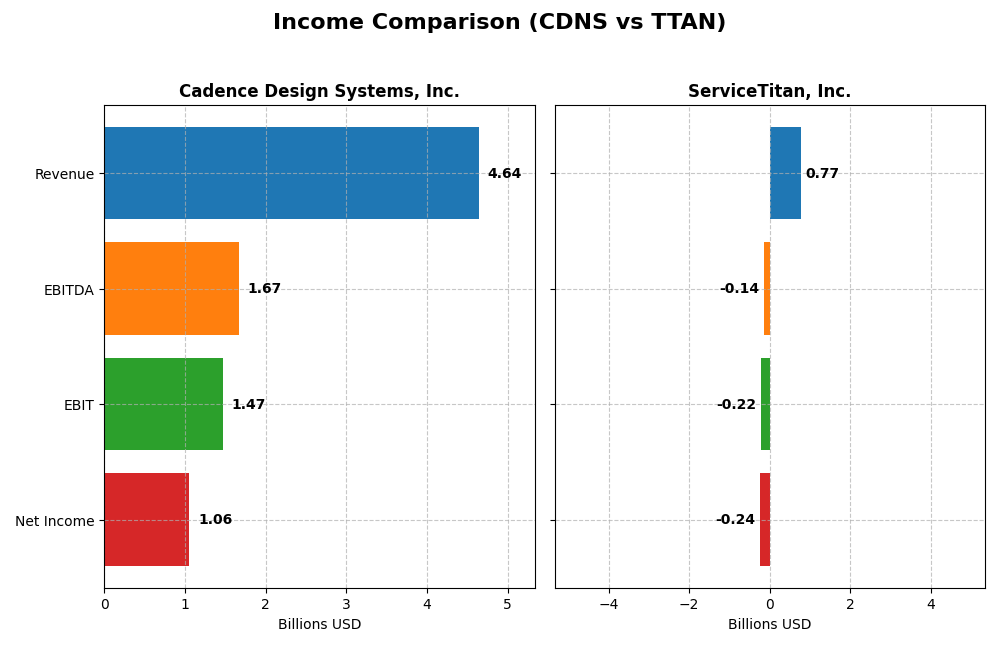
| Revenue | 4.64B | 772M |
| EBITDA | 1.67B | -141M |
| EBIT | 1.47B | -221M |
| Net Income | 1.06B | -239M |
| EPS | 3.89 | -8.53 |
| Fiscal Year | 2024 | 2025 |
Income Statement Interpretations
Cadence Design Systems, Inc.
From 2020 to 2024, Cadence Design Systems saw steady revenue growth from $2.68B to $4.64B and net income rising from $590M to $1.06B, reflecting strong profitability. Gross and EBIT margins remained robust, around 86% and 32% respectively. In 2024, revenue growth accelerated to 13.5%, while net margin slightly declined, indicating efficient cost management but some pressure on profitability.
ServiceTitan, Inc.
ServiceTitan’s revenue increased significantly from $468M in 2023 to $772M in 2025, driven by a 25.6% growth in the latest year. Despite a favorable gross margin near 65%, the company reported negative EBIT and net margins, -29% and -31%, respectively, indicating ongoing losses. The 2025 net income loss widened to $239M, signaling challenges in controlling operating expenses amid rapid expansion.
Which one has the stronger fundamentals?
Cadence Design Systems exhibits stronger fundamentals with sustained revenue and profit growth, high margins, and favorable cost controls over five years. ServiceTitan benefits from rapid revenue gains but suffers sizable losses and negative margins, reflecting a riskier profile. Overall, Cadence’s consistent profitability contrasts with ServiceTitan’s operational deficits despite growth momentum.
Financial Ratios Comparison
The table below presents key financial ratios for Cadence Design Systems, Inc. (CDNS) and ServiceTitan, Inc. (TTAN) based on their most recent fiscal year data, providing a snapshot of their financial performance and stability.
| Ratios | Cadence Design Systems, Inc. (CDNS) | ServiceTitan, Inc. (TTAN) |
|---|---|---|
| ROE | 22.6% | -16.4% |
| ROIC | 13.4% | -14.1% |
| P/E | 77.2 | -18.1 |
| P/B | 17.4 | 3.0 |
| Current Ratio | 2.93 | 3.74 |
| Quick Ratio | 2.74 | 3.74 |
| D/E | 0.55 | 0.11 |
| Debt-to-Assets | 28.8% | 9.4% |
| Interest Coverage | 17.8 | -14.8 |
| Asset Turnover | 0.52 | 0.44 |
| Fixed Asset Turnover | 7.68 | 9.57 |
| Payout ratio | 0 | 0 |
| Dividend yield | 0 | 0 |
Interpretation of the Ratios
Cadence Design Systems, Inc.
Cadence Design Systems shows predominantly strong financial ratios including favorable net margin (22.74%), ROE (22.58%), and ROIC (13.43%), supported by solid liquidity with a current ratio of 2.93. However, valuation ratios like PE at 77.2 and PB at 17.44 are unfavorable, suggesting a high price relative to earnings and book value. The company does not pay dividends, likely reflecting a strategy focused on reinvestment and growth.
ServiceTitan, Inc.
ServiceTitan’s financial ratios reveal significant weaknesses, with negative net margin (-30.98%), ROE (-16.44%), and ROIC (-14.11%), indicating operational and profitability challenges. Despite a low debt-to-equity ratio (0.11) and favorable WACC (4.95%), the overall financial health remains concerning. The lack of dividends aligns with its negative earnings and possible prioritization of growth or R&D investments.
Which one has the best ratios?
Cadence Design Systems holds a more favorable overall ratio profile, with most profitability and liquidity indicators rated positively despite valuation concerns. In contrast, ServiceTitan exhibits multiple unfavorable profitability ratios and negative earnings, leading to a slightly unfavorable overall rating. Thus, Cadence Design Systems currently presents stronger financial metrics based on the available data.
Strategic Positioning
This section compares the strategic positioning of Cadence Design Systems, Inc. and ServiceTitan, Inc., including Market position, Key segments, and Exposure to technological disruption:
Cadence Design Systems, Inc. (CDNS)
- Established leader in software and hardware for IC design with strong competitive landscape.
- Key segments include IC design software, verification, IP products, and services across multiple industries.
- Exposure tied to semiconductor design technology advancements and integration challenges.
ServiceTitan, Inc. (TTAN)
- Newer company focused on software for field service management in residential and commercial sectors.
- Primary business drivers are platform and subscription revenues from field service software solutions.
- Limited exposure to tech disruption, focused on service infrastructure software for buildings.
CDNS vs TTAN Positioning
CDNS operates a diversified business across technology sectors with broad product lines, while TTAN concentrates on a niche field service software market. CDNS benefits from scale and multiple revenue streams; TTAN’s focus may limit market reach but targets specific service needs.
Which has the best competitive advantage?
CDNS shows a slightly favorable moat with value creation and declining profitability, indicating some competitive strength. TTAN has an unfavorable moat, shedding value despite stable profitability, suggesting weaker competitive advantage.
Stock Comparison
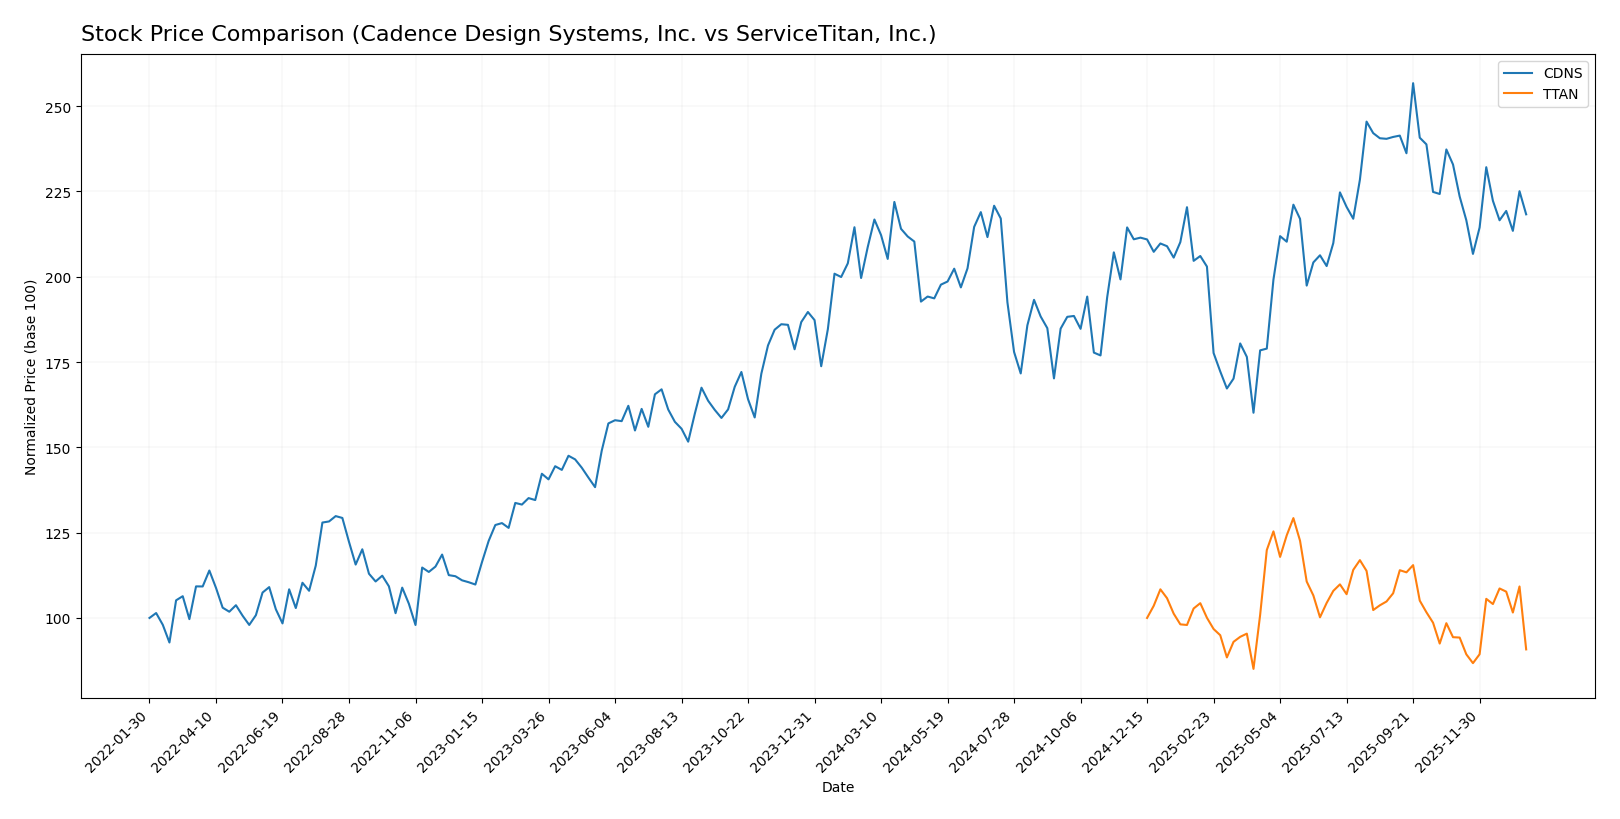
The stock price chart highlights contrasting dynamics over the past 12 months, with Cadence Design Systems, Inc. exhibiting a moderate bullish trend despite recent deceleration, while ServiceTitan, Inc. shows a sustained bearish trend with acceleration.
Trend Analysis
Cadence Design Systems, Inc. experienced a 4.59% price increase over the past year, indicating a bullish trend with deceleration; the stock ranged between 232.88 and 373.35, showing volatility with a 29.12 standard deviation.
ServiceTitan, Inc. recorded a 9.22% decline, confirming a bearish trend with acceleration; its price fluctuated between 85.07 and 129.26, with lower volatility reflected by a 9.86 standard deviation.
Comparing both, Cadence Design Systems delivered the highest market performance over the last year, outperforming ServiceTitan’s declining stock trend.
Target Prices
The consensus target prices suggest growth potential for both Cadence Design Systems, Inc. and ServiceTitan, Inc.
| Company | Target High | Target Low | Consensus |
|---|---|---|---|
| Cadence Design Systems, Inc. | 418 | 275 | 381 |
| ServiceTitan, Inc. | 145 | 117 | 132.44 |
Analysts expect Cadence’s stock to trade notably above its current price of $317.45, reflecting confidence in its technology leadership. ServiceTitan’s consensus target also indicates upside from its current $90.78, suggesting positive market sentiment towards its field service software.
Analyst Opinions Comparison
This section compares analysts’ ratings and grades for Cadence Design Systems, Inc. and ServiceTitan, Inc.:
Rating Comparison
CDNS Rating
- Rating: B, considered Very Favorable
- Discounted Cash Flow Score: 3, Moderate
- ROE Score: 4, Favorable
- ROA Score: 5, Very Favorable
- Debt To Equity Score: 2, Moderate
- Overall Score: 3, Moderate
TTAN Rating
- Rating: C-, considered Very Favorable
- Discounted Cash Flow Score: 1, Very Unfavorable
- ROE Score: 1, Very Unfavorable
- ROA Score: 1, Very Unfavorable
- Debt To Equity Score: 3, Moderate
- Overall Score: 1, Very Unfavorable
Which one is the best rated?
Based on the provided data, Cadence Design Systems (CDNS) holds a higher overall rating and better scores in discounted cash flow, ROE, and ROA. ServiceTitan (TTAN) scores lower in these areas but has a slightly better debt-to-equity score.
Scores Comparison
Here is a comparison of the Altman Z-Score and Piotroski Score for Cadence Design Systems, Inc. (CDNS) and ServiceTitan, Inc. (TTAN):
CDNS Scores
- Altman Z-Score: 14.5, indicating a safe zone, low bankruptcy risk
- Piotroski Score: 7, classified as strong financial health
TTAN Scores
- Altman Z-Score: 15.7, indicating a safe zone, low bankruptcy risk
- Piotroski Score: 6, considered average financial health
Which company has the best scores?
Both CDNS and TTAN have Altman Z-Scores in the safe zone, suggesting low bankruptcy risk. CDNS shows a stronger Piotroski Score of 7 compared to TTAN’s 6, indicating better overall financial strength based on these metrics.
Grades Comparison
Here is the comparison of recent reliable grades assigned to Cadence Design Systems, Inc. and ServiceTitan, Inc.:
Cadence Design Systems, Inc. Grades
The following table summarizes the latest analyst grades for Cadence Design Systems, Inc.:
| Grading Company | Action | New Grade | Date |
|---|---|---|---|
| Needham | Maintain | Buy | 2025-12-22 |
| Wells Fargo | Maintain | Overweight | 2025-10-28 |
| Baird | Maintain | Outperform | 2025-10-28 |
| Needham | Maintain | Buy | 2025-10-28 |
| JP Morgan | Maintain | Overweight | 2025-10-28 |
| Oppenheimer | Maintain | Underperform | 2025-10-28 |
| Rosenblatt | Maintain | Neutral | 2025-10-28 |
| Rosenblatt | Maintain | Neutral | 2025-10-22 |
| Needham | Maintain | Buy | 2025-07-29 |
| Loop Capital | Maintain | Buy | 2025-07-29 |
Overall, Cadence Design Systems shows a predominantly positive rating trend with multiple “Buy,” “Overweight,” and “Outperform” grades, albeit with one “Underperform” and some “Neutral” ratings.
ServiceTitan, Inc. Grades
The following table presents the latest analyst grades for ServiceTitan, Inc.:
| Grading Company | Action | New Grade | Date |
|---|---|---|---|
| Piper Sandler | Maintain | Overweight | 2025-12-05 |
| BMO Capital | Maintain | Outperform | 2025-12-05 |
| TD Cowen | Maintain | Buy | 2025-12-05 |
| Morgan Stanley | Maintain | Equal Weight | 2025-12-05 |
| BMO Capital | Maintain | Outperform | 2025-11-20 |
| Wells Fargo | Maintain | Overweight | 2025-09-19 |
| Stifel | Maintain | Buy | 2025-09-19 |
| Piper Sandler | Maintain | Overweight | 2025-09-19 |
| Canaccord Genuity | Maintain | Buy | 2025-09-19 |
| Citigroup | Maintain | Neutral | 2025-09-09 |
ServiceTitan’s ratings reflect a strong positive consensus with several “Buy,” “Overweight,” and “Outperform” grades, and only one “Neutral” and one “Equal Weight” rating.
Which company has the best grades?
Both Cadence Design Systems and ServiceTitan have a consensus “Buy” rating, but ServiceTitan shows a slightly more uniform positive outlook without any negative ratings. This could indicate a steadier analyst confidence, potentially impacting investor sentiment favorably towards ServiceTitan.
Strengths and Weaknesses
Below is a comparison of key strengths and weaknesses for Cadence Design Systems, Inc. (CDNS) and ServiceTitan, Inc. (TTAN) based on the most recent financial and operational data.
| Criterion | Cadence Design Systems, Inc. (CDNS) | ServiceTitan, Inc. (TTAN) |
|---|---|---|
| Diversification | Strong product and maintenance revenue (4.21B in 2024) with additional tech services | Platform and subscription focused, less diversified (1.3B total in 2025) |
| Profitability | High net margin (22.74%) and ROIC (13.43%), creating value with slight decline | Negative net margin (-30.98%) and ROIC (-14.11%), shedding value |
| Innovation | Consistent investment in technology services, solid fixed asset turnover (7.68) | High fixed asset turnover (9.57) but overall profitability challenges |
| Global presence | Established global footprint with large market share in semiconductor design | Growing presence but smaller scale and market share compared to CDNS |
| Market Share | Leading position in EDA software market, strong brand recognition | Smaller market share in SaaS for trades, competitive but niche |
Key takeaways: Cadence Design Systems shows strong profitability and market leadership with a diversified revenue base, despite a slight decline in ROIC. ServiceTitan faces profitability challenges and value erosion but benefits from efficient asset use and growth potential. Investors should weigh CDNS’s stable value creation against TTAN’s risks and growth prospects.
Risk Analysis
Below is a comparative table highlighting key risk metrics for Cadence Design Systems, Inc. (CDNS) and ServiceTitan, Inc. (TTAN) based on the most recent financial data.
| Metric | Cadence Design Systems, Inc. (CDNS) | ServiceTitan, Inc. (TTAN) |
|---|---|---|
| Market Risk | Beta 1.02 (moderate market volatility) | Beta -0.85 (inverse market correlation) |
| Debt level | Debt-to-Equity 0.55 (moderate) | Debt-to-Equity 0.11 (low) |
| Regulatory Risk | Moderate (technology/software sector regulations) | Moderate (software sector, growing company) |
| Operational Risk | Low (established with 12.8K employees) | Moderate (smaller scale, 3K employees) |
| Environmental Risk | Low (software focus, minimal physical footprint) | Low (software focus, minimal physical footprint) |
| Geopolitical Risk | Moderate (US-based, global clients in sensitive sectors) | Moderate (US-based with expanding market) |
The most impactful risks are operational and market risks. CDNS faces typical market volatility with a beta near 1, while TTAN’s negative beta suggests unusual market dynamics. ServiceTitan’s unfavorable profitability and weak returns increase operational risk, despite low debt. Cadence’s higher valuation multiples imply price risk. Both companies have moderate exposure to regulatory and geopolitical factors given their US base and global reach. Investors should weigh TTAN’s growth potential against its financial instability carefully.
Which Stock to Choose?
Cadence Design Systems, Inc. (CDNS) shows favorable income evolution with a 13.48% revenue growth in 2024 and strong profitability metrics such as a 22.74% net margin and a 22.58% ROE. Its debt levels remain manageable with a net debt to EBITDA of -0.04, complemented by a very favorable rating of B and a solid Altman Z-Score in the safe zone. Despite a slight decline in ROIC, the company is creating value with mostly favorable financial ratios.
ServiceTitan, Inc. (TTAN) reports favorable revenue growth of 25.64% in 2025 but continues to face profitability challenges with a negative net margin of -30.98% and ROE of -16.44%. The company’s debt profile is conservative with a low debt-to-equity ratio of 0.11, yet its financial ratios are slightly unfavorable overall. TTAN holds a very favorable rating of C- but shows value destruction with an unfavorable MOAT and weaker Piotroski score.
From an investor’s perspective, the choice could depend on risk tolerance and investment strategy. Those prioritizing stability and consistent value creation might find CDNS more appealing given its strong profitability and favorable financial health. Conversely, risk-tolerant investors focused on growth potential could view TTAN’s high revenue growth, despite current losses, as a possible opportunity amid its improving trend.
Disclaimer: Investment carries a risk of loss of initial capital. The past performance is not a reliable indicator of future results. Be sure to understand risks before making an investment decision.
Go Further
I encourage you to read the complete analyses of Cadence Design Systems, Inc. and ServiceTitan, Inc. to enhance your investment decisions: