Home > Comparison > Technology > NOW vs CDNS
The strategic rivalry between ServiceNow, Inc. and Cadence Design Systems, Inc. shapes the evolution of the technology sector’s software application landscape. ServiceNow excels as a cloud-based enterprise workflow automation powerhouse, while Cadence dominates in integrated circuit design software and hardware solutions. This head-to-head pits scalable enterprise SaaS against capital-intensive design innovation. This analysis will reveal which company’s trajectory offers superior risk-adjusted returns for diversified portfolios in 2026.
Table of contents
Companies Overview
ServiceNow and Cadence Design Systems both command critical roles in the software application industry, shaping enterprise and semiconductor markets respectively.
ServiceNow, Inc.: Enterprise Workflow Automation Leader
ServiceNow dominates enterprise cloud computing by automating workflows via its Now platform. Its revenue stems from IT service management, operations, security, and HR solutions. In 2026, it strategically deepens automation capabilities and expands partnerships to enhance customer process efficiency globally.
Cadence Design Systems, Inc.: Semiconductor Design Software Pioneer
Cadence leads in software and hardware for IC design and verification. Revenues come from its comprehensive suite supporting chip design, simulation, and testing. Its 2026 focus remains on advanced verification tools and IP products to accelerate semiconductor innovation across multiple industries.
Strategic Collision: Similarities & Divergences
Both firms rely on software to solve complex enterprise problems but differ in scope—ServiceNow targets operational workflows, while Cadence focuses on semiconductor design. Their primary battleground is technological innovation within their niches. Investors face distinct profiles: ServiceNow rides enterprise digitization waves, Cadence benefits from semiconductor cycle dynamics.
Income Statement Comparison
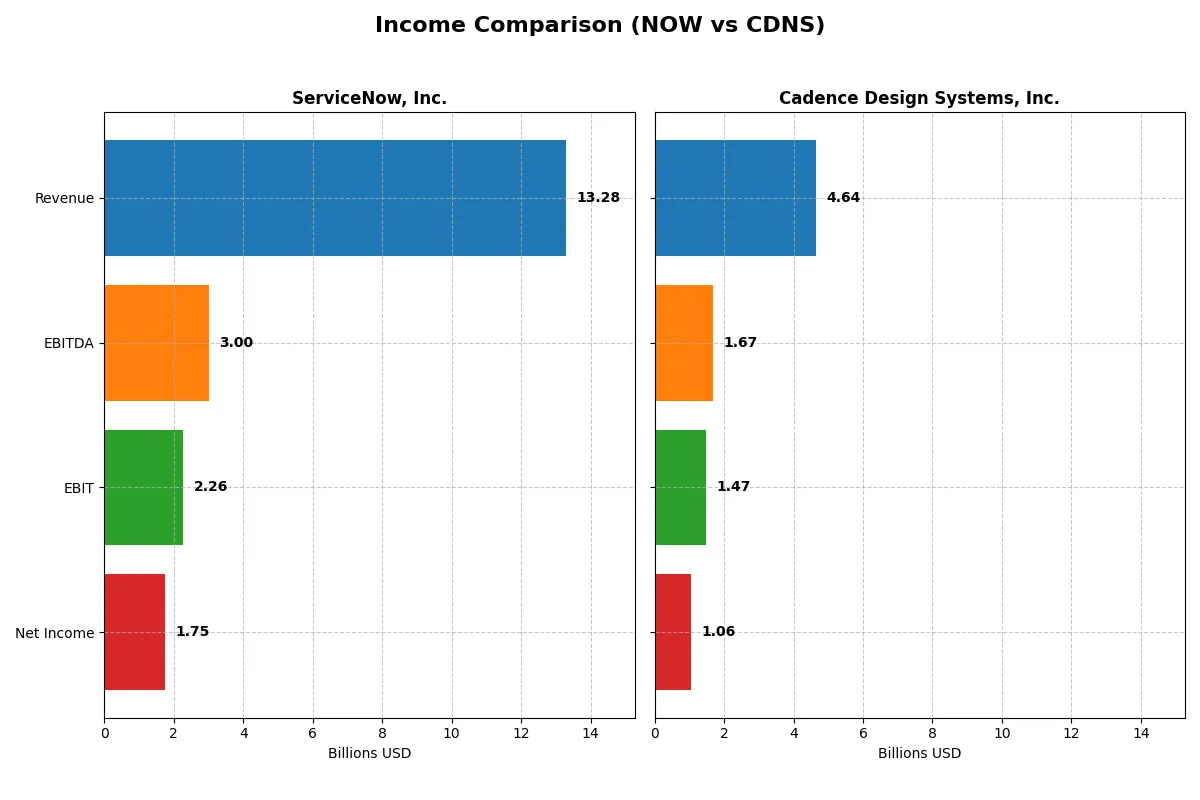
The following data dissects the core profitability and scalability of both corporate engines to reveal who dominates the bottom line:
| Metric | ServiceNow, Inc. (NOW) | Cadence Design Systems, Inc. (CDNS) |
|---|---|---|
| Revenue | 13.3B | 4.6B |
| Cost of Revenue | 3.0B | 648M |
| Operating Expenses | 8.5B | 2.6B |
| Gross Profit | 10.3B | 4.0B |
| EBITDA | 3.0B | 1.7B |
| EBIT | 2.3B | 1.5B |
| Interest Expense | 0 | 76M |
| Net Income | 1.7B | 1.1B |
| EPS | 1.69 | 3.89 |
| Fiscal Year | 2025 | 2024 |
Income Statement Analysis: The Bottom-Line Duel
This income statement comparison exposes which company runs a more efficient and profitable business engine under current market conditions.
ServiceNow, Inc. Analysis
ServiceNow’s revenue surged from $5.9B in 2021 to $13.3B in 2025, more than doubling in five years. Its net income climbed impressively from $230M to $1.75B, showcasing strong profitability growth. The company maintains robust gross margins above 77% and a healthy net margin near 13%, reflecting disciplined cost control despite rapid expansion. The latest year confirmed accelerating EBIT growth of 28%, signaling strong operational momentum.
Cadence Design Systems, Inc. Analysis
Cadence grew revenue from $2.7B in 2020 to $4.6B in 2024, a solid 73% increase over five years. Net income rose steadily to $1.06B, supported by an excellent gross margin exceeding 86% and a net margin of 23%. Cadence’s EBIT margin stands at an impressive 32%, indicating superior operating efficiency. However, its net margin contracted slightly by 10% last year, hinting at margin pressures despite ongoing revenue gains.
Growth Scale vs. Margin Strength
ServiceNow dominates on scale and rapid profit growth, doubling revenue and multiplying net income sixfold since 2021. Cadence excels in margin quality and operational efficiency but grows more moderately. For investors prioritizing high growth and expanding earnings, ServiceNow presents a more dynamic profile. Conversely, Cadence offers a stable, high-margin business that may appeal to those valuing profitability resilience.
Financial Ratios Comparison
These vital ratios act as a diagnostic tool to expose underlying fiscal health, valuation premiums, and capital efficiency of the companies compared below:
| Ratios | ServiceNow, Inc. (NOW) | Cadence Design Systems, Inc. (CDNS) |
|---|---|---|
| ROE | 13.5% | 22.6% |
| ROIC | 9.0% | 13.4% |
| P/E | 90.9 | 77.2 |
| P/B | 12.3 | 17.4 |
| Current Ratio | 0.95 | 2.93 |
| Quick Ratio | 0.95 | 2.74 |
| D/E | 0.25 | 0.55 |
| Debt-to-Assets | 12.3% | 28.8% |
| Interest Coverage | 0 | 17.8 |
| Asset Turnover | 0.51 | 0.52 |
| Fixed Asset Turnover | 4.29 | 7.68 |
| Payout ratio | 0 | 0 |
| Dividend yield | 0 | 0 |
| Fiscal Year | 2025 | 2024 |
Efficiency & Valuation Duel: The Vital Signs
Financial ratios serve as a company’s DNA, unveiling hidden risks and operational strengths that shape investment decisions. They decode profitability, liquidity, and valuation nuances essential for assessing true corporate health.
ServiceNow, Inc.
ServiceNow delivers solid profitability with a 13.48% ROE and a favorable 13.16% net margin. However, its valuation appears stretched, marked by a high P/E of 90.88 and a P/B at 12.25. The company opts against dividends, reinvesting heavily in R&D to sustain growth, reflecting a long-term innovation focus despite a suboptimal current ratio of 0.95.
Cadence Design Systems, Inc.
Cadence excels with superior profitability: a 22.58% ROE and a strong 22.74% net margin. Its valuation is also elevated, with a P/E of 77.2 and P/B of 17.44, yet it maintains a robust liquidity profile, boasting a 2.93 current ratio. Like ServiceNow, Cadence foregoes dividends, channeling capital into growth and R&D, underpinning its operational efficiency.
Valuation Stretch vs. Operational Strength
Cadence offers a stronger profitability and liquidity profile with a more favorable global ratio assessment. ServiceNow’s valuation is more stretched, and its liquidity poses a concern. Investors prioritizing operational safety may lean toward Cadence’s balanced financial health, while those focused on innovation might watch ServiceNow’s reinvestment strategy closely.
Which one offers the Superior Shareholder Reward?
ServiceNow (NOW) does not pay dividends but reinvests heavily in growth, showing zero payout ratio and yield. Cadence Design Systems (CDNS) also pays no dividends but delivers stronger free cash flow yield and robust buybacks. CDNS’s buyback intensity and higher operating margins suggest more sustainable shareholder returns. I favor CDNS for a superior total return profile in 2026 due to its balance of cash flow generation and disciplined capital allocation.
Comparative Score Analysis: The Strategic Profile
The radar chart reveals the fundamental DNA and trade-offs shaping ServiceNow and Cadence Design’s financial and valuation profiles:
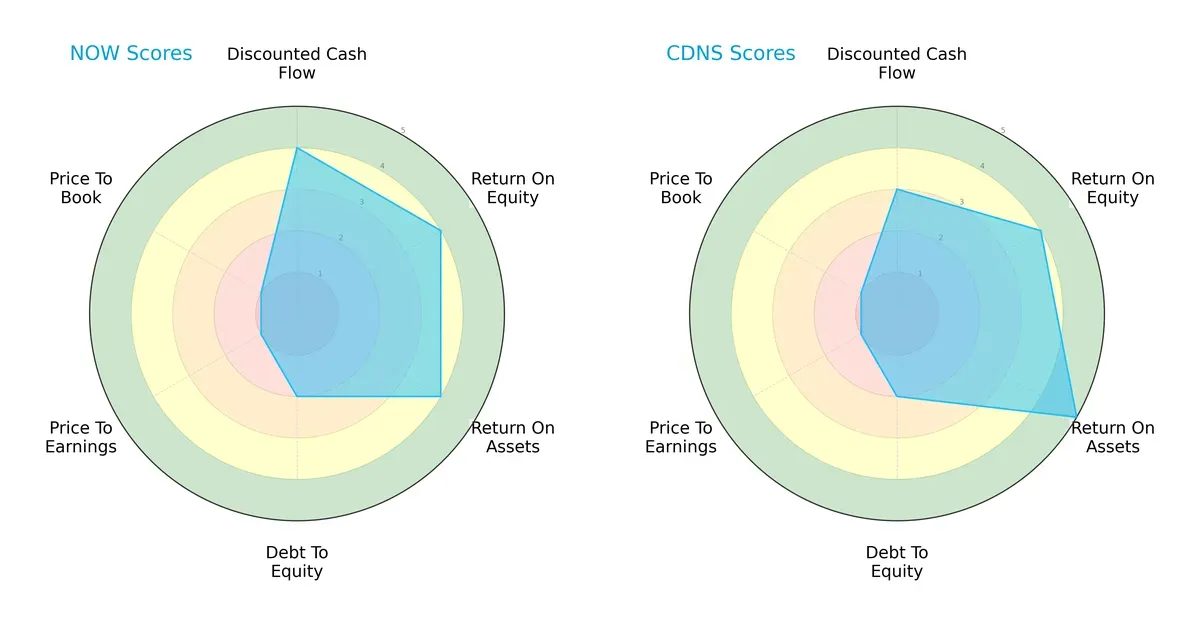
ServiceNow shows strength in discounted cash flow and solid returns on equity and assets but carries moderate debt risk and very unfavorable valuation scores. Cadence Design balances excellent asset efficiency and a slightly lower DCF score, sharing the same debt and valuation challenges. Cadence’s profile leans on operational efficiency, while ServiceNow relies more on cash flow robustness.
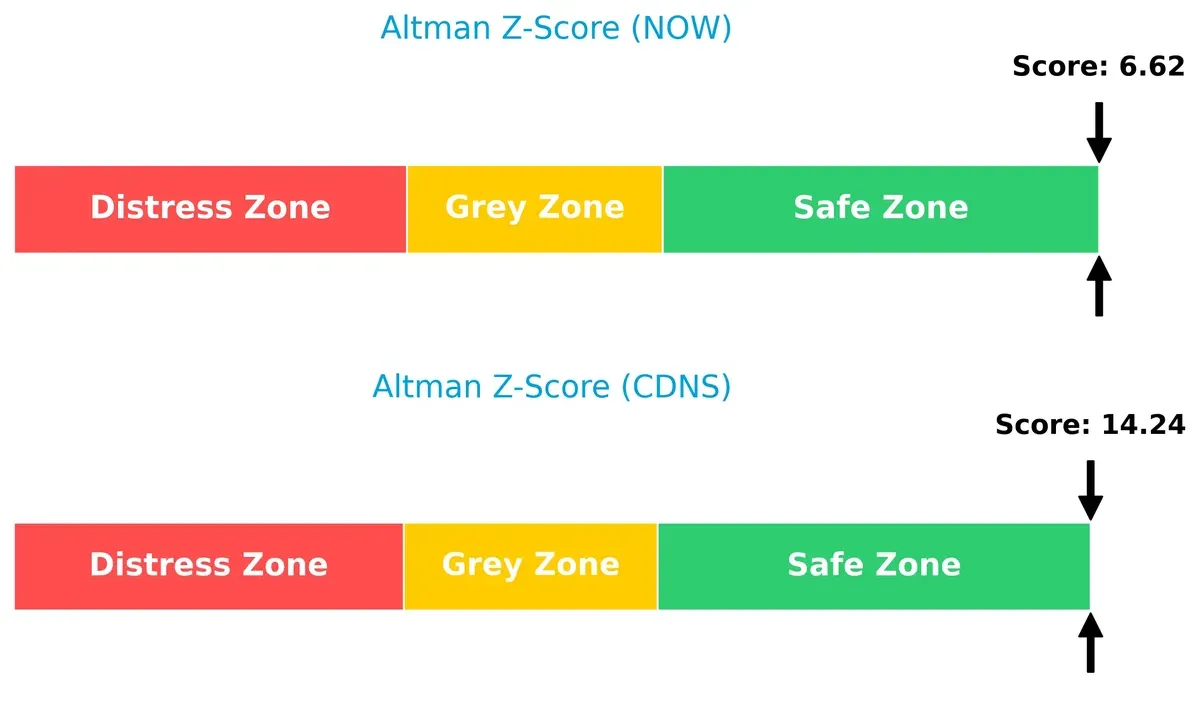
Bankruptcy Risk: Solvency Showdown
The Altman Z-Score delta highlights Cadence Design’s superior solvency, indicating a stronger buffer against bankruptcy than ServiceNow in this cycle:
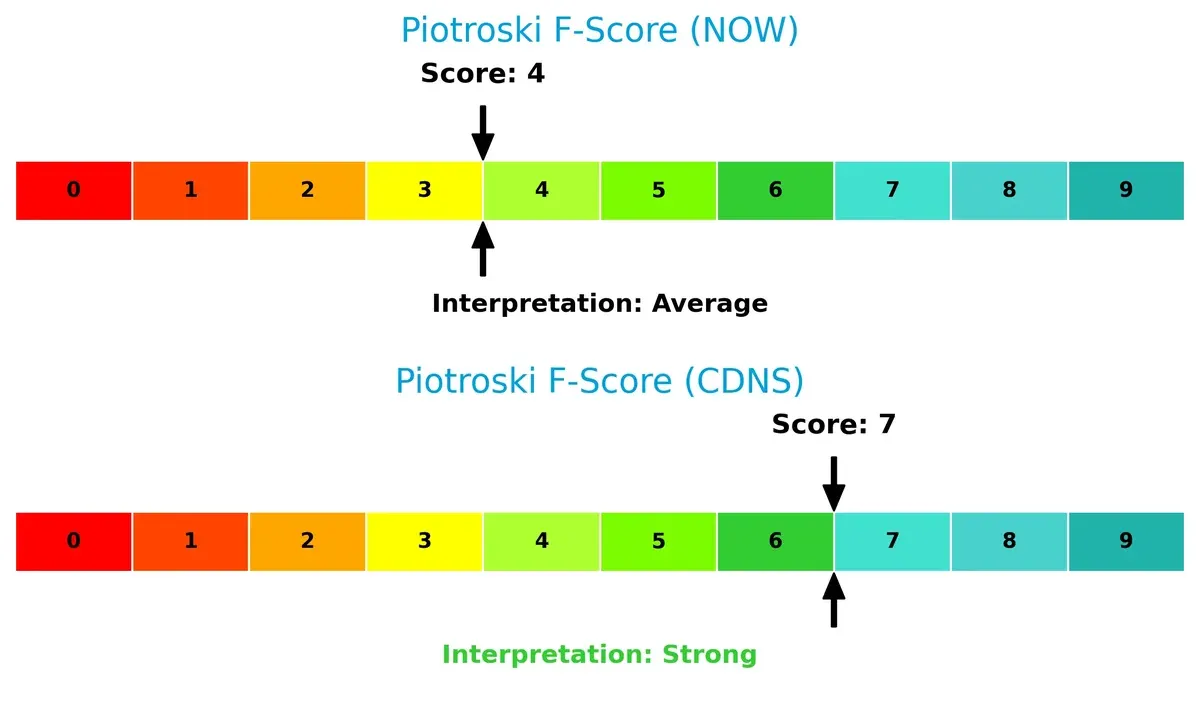
Financial Health: Quality of Operations
Cadence Design’s Piotroski F-Score of 7 signals strong financial health, outperforming ServiceNow’s average score of 4, which suggests internal red flags and weaker operational quality:
How are the two companies positioned?
This section dissects the operational DNA of ServiceNow and Cadence by comparing their revenue distribution and internal dynamics. The goal is to confront their economic moats and identify which model delivers the most resilient competitive advantage today.
Revenue Segmentation: The Strategic Mix
This visual comparison dissects how ServiceNow, Inc. and Cadence Design Systems, Inc. diversify their income streams and where their primary sector bets lie:
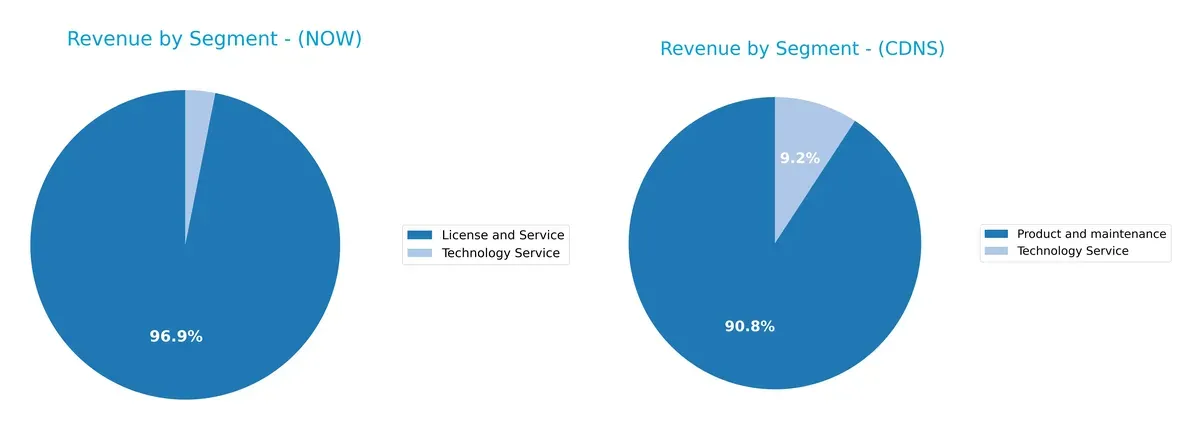
ServiceNow anchors its revenue heavily in License and Service, reaching $12.9B in 2025, with a smaller $414M Technology Service segment. Cadence Design’s $4.2B Product and Maintenance dwarfs its $428M Technology Service. ServiceNow shows a more concentrated model focused on digital workflow dominance, while Cadence balances product stability with service growth. ServiceNow risks overdependence on a single segment, whereas Cadence mitigates risk through a more balanced revenue mix.
Strengths and Weaknesses Comparison
This table compares the strengths and weaknesses of ServiceNow and Cadence Design Systems based on key financial and strategic metrics:
ServiceNow Strengths
- Favorable net margin at 13.16%
- Low debt-to-assets ratio at 12.3%
- Strong interest coverage with infinite value
- High fixed asset turnover at 4.29x
- Significant revenue growth in North America, EMEA, Asia Pacific
Cadence Design Systems Strengths
- Superior net margin at 22.74%
- Strong ROE at 22.58% and ROIC at 13.43%
- Favorable current and quick ratios above 2.7
- High fixed asset turnover at 7.68x
- Diversified global presence including Americas, Asia, EMEA, Japan
ServiceNow Weaknesses
- Unfavorable P/E ratio at 90.88
- Low current ratio below 1 indicates liquidity risk
- High P/B ratio at 12.25
- Zero dividend yield
- Neutral ROE and ROIC close to WACC
- Moderate asset turnover at 0.51x
Cadence Design Systems Weaknesses
- Unfavorable P/E at 77.2, though lower than ServiceNow
- High P/B at 17.44
- Moderate debt-to-equity ratio at 0.55
- Zero dividend yield
- Asset turnover neutral at 0.52x
Both companies show financial strengths but differ in profitability and liquidity profiles. ServiceNow’s lower debt and strong interest coverage provide stability, while Cadence excels in profitability and liquidity. Both face valuation concerns and lack dividend income, which may impact investor perception and capital allocation strategies.
The Moat Duel: Analyzing Competitive Defensibility
A structural moat protects long-term profits from competition’s relentless erosion. Without it, sustainable growth is a mirage:
ServiceNow, Inc.: Workflow Automation Switching Costs
ServiceNow’s moat stems from high switching costs embedded in its Now platform. This manifests as stable margins and a growing ROIC trend through 2025. Expansion into AI-driven workflow automation could deepen its client lock-in in 2026.
Cadence Design Systems, Inc.: Proprietary Design Software Intangible Assets
Cadence’s moat relies on specialized, hard-to-replicate IC design software, contrasting with ServiceNow’s platform lock-in. It consistently creates value with a strong ROIC above WACC, despite a recent decline. Opportunities lie in 5G and automotive chip design growth.
Switching Costs vs. Proprietary Software: The Moat Face-Off
ServiceNow’s increasing ROIC signals a widening moat driven by customer dependency. Cadence earns higher excess returns but faces margin pressure. I see ServiceNow better positioned to defend and expand its market share in 2026.
Which stock offers better returns?
The past year saw ServiceNow and Cadence Design Systems both face bearish trends, with notable declines and deceleration in price momentum amid increasing trading volumes.
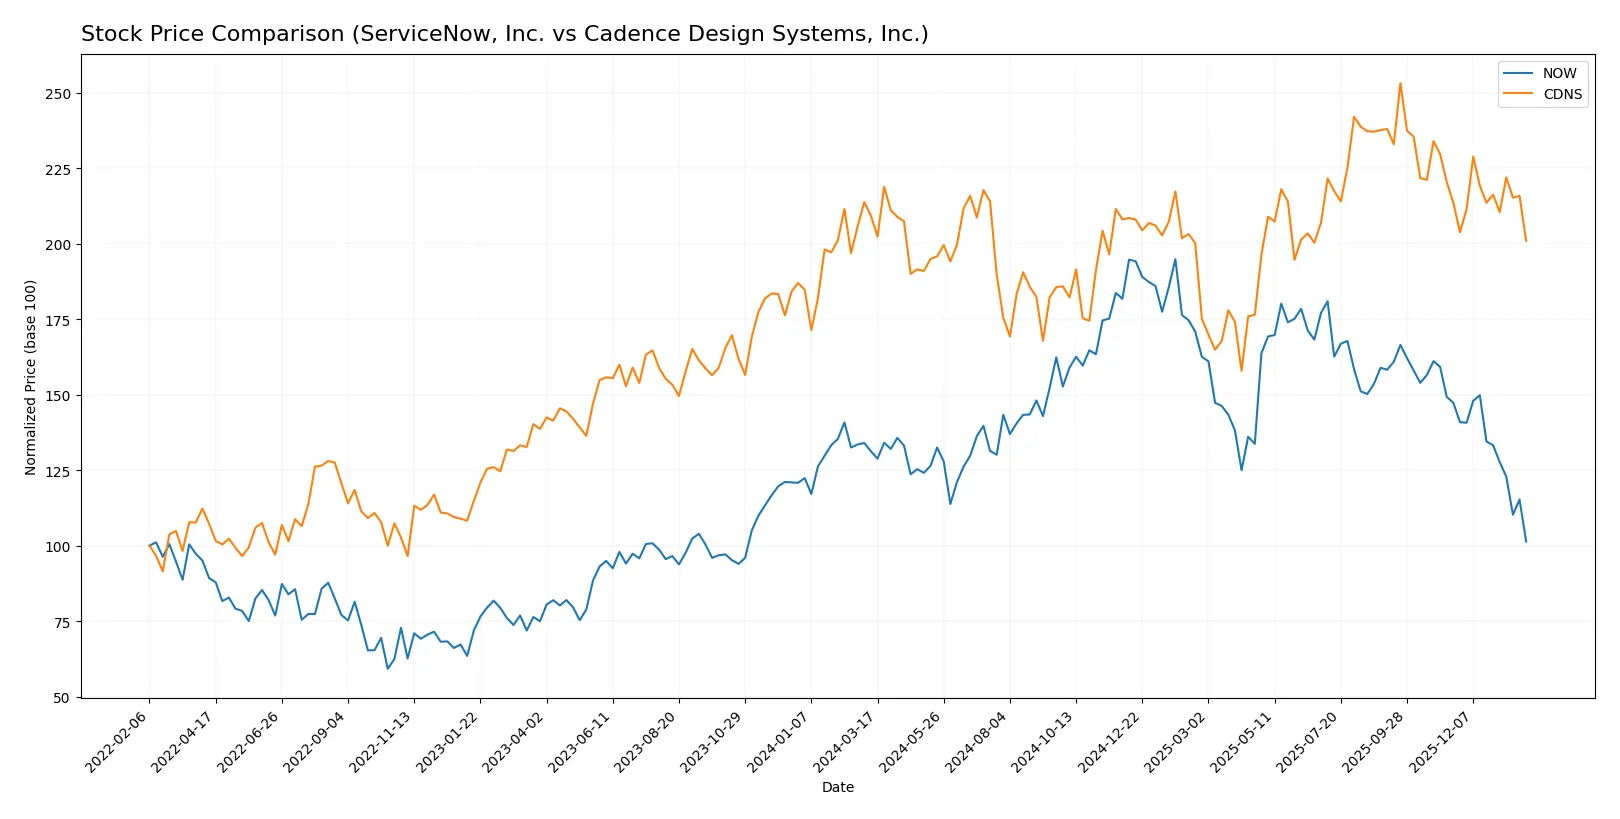
Trend Comparison
ServiceNow’s stock price fell 22.79% over the past 12 months, marking a bearish trend with decelerating losses. The price ranged between 117.01 and 225.0, showing high volatility (24.31 std deviation).
Cadence Design Systems declined 3.97% over the same period, also bearish with decelerating trend. The stock showed a wide price range from 232.88 to 373.35 and a higher volatility (29.14 std deviation).
ServiceNow’s decline significantly exceeded Cadence’s, delivering weaker market performance despite both stocks trending downward and showing seller dominance in recent trading sessions.
Target Prices
Analysts present a wide range of target prices, reflecting divergent outlooks for ServiceNow and Cadence Design Systems.
| Company | Target Low | Target High | Consensus |
|---|---|---|---|
| ServiceNow, Inc. | 115 | 1315 | 440.14 |
| Cadence Design Systems, Inc. | 275 | 418 | 382.17 |
ServiceNow’s consensus target at 440.14 far exceeds its current 117.01 price, indicating strong bullish sentiment despite high volatility in estimates. Cadence’s consensus target of 382.17 also suggests substantial upside from its 296.36 price, reflecting confidence in its growth potential.

Don’t Let Luck Decide Your Entry Point
Optimize your entry points with our advanced ProRealTime indicators. You’ll get efficient buy signals with precise price targets for maximum performance. Start outperforming now!
How do institutions grade them?
ServiceNow, Inc. Grades
The table below summarizes recent grades issued by key financial institutions for ServiceNow, Inc.:
| Grading Company | Action | New Grade | Date |
|---|---|---|---|
| Citigroup | Maintain | Buy | 2026-01-30 |
| BTIG | Maintain | Buy | 2026-01-29 |
| Stifel | Maintain | Buy | 2026-01-29 |
| RBC Capital | Maintain | Outperform | 2026-01-29 |
| Macquarie | Maintain | Neutral | 2026-01-29 |
| DA Davidson | Maintain | Buy | 2026-01-29 |
| Needham | Maintain | Buy | 2026-01-29 |
| Keybanc | Maintain | Underweight | 2026-01-29 |
| Evercore ISI Group | Maintain | Outperform | 2026-01-29 |
| Cantor Fitzgerald | Maintain | Overweight | 2026-01-29 |
Cadence Design Systems, Inc. Grades
Below is the summary of recent grades from reputable firms for Cadence Design Systems, Inc.:
| Grading Company | Action | New Grade | Date |
|---|---|---|---|
| Needham | Maintain | Buy | 2025-12-22 |
| Baird | Maintain | Outperform | 2025-10-28 |
| JP Morgan | Maintain | Overweight | 2025-10-28 |
| Needham | Maintain | Buy | 2025-10-28 |
| Wells Fargo | Maintain | Overweight | 2025-10-28 |
| Rosenblatt | Maintain | Neutral | 2025-10-28 |
| Oppenheimer | Maintain | Underperform | 2025-10-28 |
| Rosenblatt | Maintain | Neutral | 2025-10-22 |
| Stifel | Maintain | Buy | 2025-07-29 |
| Keybanc | Maintain | Overweight | 2025-07-29 |
Which company has the best grades?
ServiceNow shows a consensus of Buy and Outperform ratings, with few Neutral or negative views. Cadence has strong Buy and Overweight ratings too but includes an Underperform, indicating more mixed sentiment. Investors may weigh ServiceNow’s more consistently positive outlook as a signal of broader institutional confidence.
Risks specific to each company
The following categories identify critical pressure points and systemic threats facing ServiceNow, Inc. and Cadence Design Systems, Inc. in the 2026 market environment:
1. Market & Competition
ServiceNow, Inc.
- Faces intense competition in enterprise cloud software with high switching costs but a crowded field.
Cadence Design Systems, Inc.
- Competes in specialized IC design software with strong IP but vulnerable to rapid tech changes.
2. Capital Structure & Debt
ServiceNow, Inc.
- Maintains low debt-to-equity (0.25), favorable leverage, but weak liquidity (current ratio 0.95).
Cadence Design Systems, Inc.
- Higher leverage (debt-to-equity 0.55) but strong liquidity (current ratio 2.93) and interest coverage.
3. Stock Volatility
ServiceNow, Inc.
- Beta near 1 (0.98) indicates market-level volatility with some downside risk.
Cadence Design Systems, Inc.
- Slightly higher beta (1.02) signals marginally greater sensitivity to market swings.
4. Regulatory & Legal
ServiceNow, Inc.
- Exposed to data privacy and cloud compliance regulations globally, increasing operational risks.
Cadence Design Systems, Inc.
- Faces export controls and IP protection challenges in semiconductor design amid geopolitical tensions.
5. Supply Chain & Operations
ServiceNow, Inc.
- Relies on cloud infrastructure partners; operational disruptions could impact service delivery.
Cadence Design Systems, Inc.
- Dependent on semiconductor manufacturing partners; supply shortages or delays pose risks.
6. ESG & Climate Transition
ServiceNow, Inc.
- Invested in sustainable cloud operations but faces pressure to enhance ESG disclosures.
Cadence Design Systems, Inc.
- Strong focus on energy-efficient chip design but exposed to raw material sourcing scrutiny.
7. Geopolitical Exposure
ServiceNow, Inc.
- Moderate exposure due to global client base but less directly impacted by trade conflicts.
Cadence Design Systems, Inc.
- High exposure to US-China tech tensions impacting semiconductor supply chains and sales.
Which company shows a better risk-adjusted profile?
ServiceNow’s main risk is its weak liquidity, which threatens operational agility. Cadence’s largest risk lies in geopolitical exposure affecting its supply chain. Cadence’s stronger liquidity and financial scores offer a more resilient risk-adjusted profile. Notably, Cadence’s Altman Z-score is more than double that of ServiceNow, reflecting superior bankruptcy safety.
Final Verdict: Which stock to choose?
ServiceNow’s superpower lies in its impressive revenue growth and expanding profitability, driven by a scalable cloud platform that fuels operational efficiency. However, its subpar liquidity ratio is a point of vigilance, signaling potential short-term financial strain. It aligns well with aggressive growth portfolios willing to accept some balance sheet risk.
Cadence Design stands out with a robust moat rooted in its specialized software tools and recurring revenue streams, translating into high profitability and strong capital efficiency. Its solid liquidity and safer balance sheet provide better downside protection than ServiceNow. This makes it suited for GARP portfolios seeking growth with a margin of safety.
If you prioritize rapid expansion and market penetration, ServiceNow offers a compelling scenario due to accelerating top-line growth despite balance sheet risks. However, if you seek a more stable investment with strong cash flow and a durable moat, Cadence outshines by combining profitability with financial resilience, even at a premium valuation.
Disclaimer: Investment carries a risk of loss of initial capital. The past performance is not a reliable indicator of future results. Be sure to understand risks before making an investment decision.
Go Further
I encourage you to read the complete analyses of ServiceNow, Inc. and Cadence Design Systems, Inc. to enhance your investment decisions: