Investors often seek companies that blend innovation with market resilience, making Broadridge Financial Solutions, Inc. and Jacobs Solutions Inc. compelling contenders. Both operate within the broad technology and services sector, yet Broadridge focuses on financial communications and automation, while Jacobs excels in infrastructure consulting and engineering. This article will dissect their strategies and market positions to help you identify which company holds the most promise for your investment portfolio.

Table of contents
Companies Overview
I will begin the comparison between Broadridge Financial Solutions and Jacobs Solutions by providing an overview of these two companies and their main differences.
Broadridge Financial Solutions Overview
Broadridge Financial Solutions, Inc. focuses on investor communications and technology-driven solutions for the financial services industry. The company offers services including proxy processing, regulatory reporting, data analytics, and transaction lifecycle automation. Founded in 1962 and headquartered in Lake Success, NY, Broadridge serves public corporations, mutual funds, and capital markets with a workforce of 14,000 employees.
Jacobs Solutions Overview
Jacobs Solutions Inc. provides infrastructure, advanced facilities, and consulting services worldwide, covering sectors like consumer, manufacturing, defense, energy, and transport. Founded in 1947 and based in Dallas, TX, Jacobs offers architecture, engineering, project management, and long-term facility operations. The company employs 45,000 people and operates across multiple continents including the Americas, Europe, Asia, and the Middle East.
Key similarities and differences
Both companies operate in the technology sector and serve complex, professional markets with a focus on services and consultancy. Broadridge specializes in financial services technology and communications, while Jacobs concentrates on infrastructure and engineering consulting across diverse industries. Broadridge’s business is heavily data and compliance-driven, whereas Jacobs emphasizes physical infrastructure and project delivery on a global scale.
Income Statement Comparison
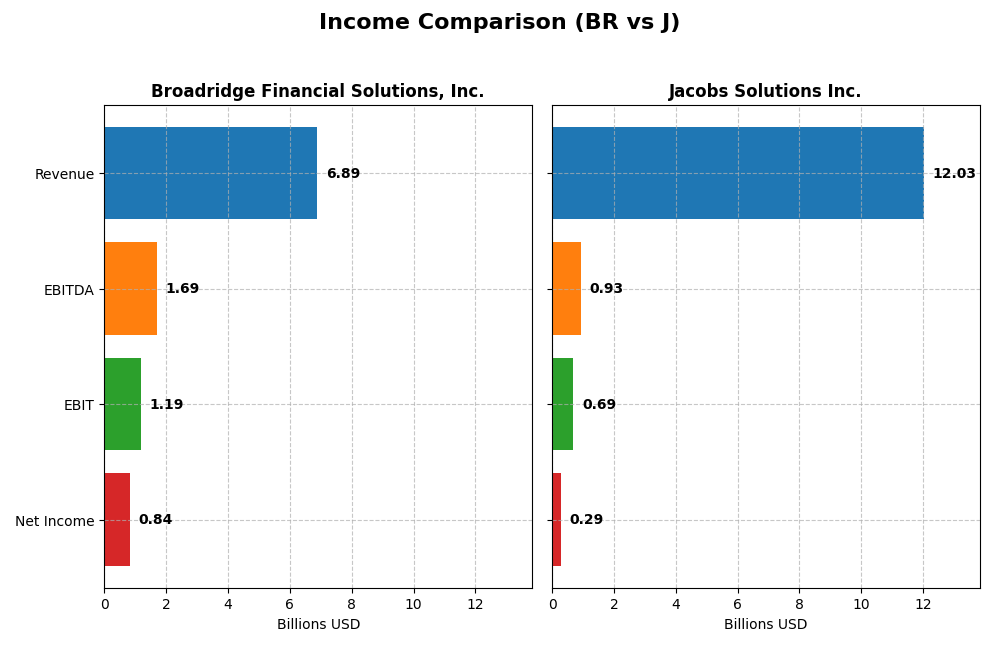
This table presents a side-by-side comparison of the most recent fiscal year income statement figures for Broadridge Financial Solutions, Inc. and Jacobs Solutions Inc.
| Metric | Broadridge Financial Solutions, Inc. (BR) | Jacobs Solutions Inc. (J) |
|---|---|---|
| Market Cap | 25.5B | 16.6B |
| Revenue | 6.89B | 12.03B |
| EBITDA | 1.69B | 927M |
| EBIT | 1.19B | 689M |
| Net Income | 840M | 290M |
| EPS | 7.17 | 2.39 |
| Fiscal Year | 2025 | 2025 |
Income Statement Interpretations
Broadridge Financial Solutions, Inc.
Broadridge’s revenue grew steadily from 5B in 2021 to nearly 6.9B in 2025, with net income rising from 547M to 840M over the same period. Margins showed strength, with gross margin at 31.02% and net margin at 12.19% in 2025, indicating healthy profitability. The latest year saw a solid 5.9% revenue increase, 16.2% EBIT growth, and a notable 21.2% rise in EPS, reflecting improved operational efficiency.
Jacobs Solutions Inc.
Jacobs reported fluctuating revenue, peaking at 14.1B in 2021 before declining to 12B in 2025. Net income also fell from 410M in 2021 to 290M in 2025, with margins relatively weak; gross margin stood at 24.81%, EBIT margin at 5.73%, and net margin only 2.41% in 2025. The latest year showed a 4.6% revenue rise but a sharp 27.2% drop in EBIT and a 62.3% decline in EPS, signaling margin pressure.
Which one has the stronger fundamentals?
Broadridge demonstrates stronger fundamentals with consistent revenue and net income growth, expanding margins, and favorable profitability metrics across the period. Jacobs faces challenges, marked by declining net income, falling margins, and unfavorable growth trends, particularly in earnings and operating profit. Broadridge’s financial performance appears more robust and stable based on the income statement analysis.
Financial Ratios Comparison
The table below presents a side-by-side comparison of key financial ratios for Broadridge Financial Solutions, Inc. (BR) and Jacobs Solutions Inc. (J) based on their most recent fiscal year data.
| Ratios | Broadridge Financial Solutions, Inc. (BR) | Jacobs Solutions Inc. (J) |
|---|---|---|
| ROE | 31.6% | 8.0% |
| ROIC | 13.1% | 6.5% |
| P/E | 33.9 | 61.2 |
| P/B | 10.7 | 4.9 |
| Current Ratio | 0.98 | 1.30 |
| Quick Ratio | 0.98 | 1.30 |
| D/E (Debt-to-Equity) | 1.30 | 0.74 |
| Debt-to-Assets | 40.5% | 24.1% |
| Interest Coverage | 8.75 | 5.92 |
| Asset Turnover | 0.81 | 1.07 |
| Fixed Asset Turnover | 19.9 | 28.2 |
| Payout Ratio | 47.9% | 52.7% |
| Dividend Yield | 1.41% | 0.86% |
Interpretation of the Ratios
Broadridge Financial Solutions, Inc.
Broadridge shows several favorable ratios including a strong ROE of 31.62% and ROIC of 13.05%, indicating efficient capital use. However, concerns arise from a high P/E of 33.9 and a debt-to-equity ratio of 1.3, suggesting valuation and leverage risks. The dividend yield stands at 1.41%, supported by stable payouts and moderate buybacks.
Jacobs Solutions Inc.
Jacobs presents weaker profitability with a net margin of 2.41% and ROE of 7.97%, both unfavorable. The company benefits from a lower debt-to-assets ratio at 24.08% and favorable asset turnover, but faces a high P/E of 61.17 and a modest dividend yield of 0.86%. Dividend returns appear limited amid mixed cash flow metrics.
Which one has the best ratios?
Broadridge’s ratios lean slightly favorable with stronger profitability and coverage ratios despite some valuation and liquidity concerns. Jacobs displays a neutral profile with less robust profitability but better leverage and asset efficiency. Overall, Broadridge’s ratio profile is more favorable, though both companies have areas warranting caution.
Strategic Positioning
This section compares the strategic positioning of Broadridge Financial Solutions, Inc. and Jacobs Solutions Inc. including market position, key segments, and exposure to technological disruption:
Broadridge Financial Solutions, Inc.
- Leading provider in financial services technology with stable market cap and moderate beta.
- Focuses on investor communication, technology-driven solutions, and transaction lifecycle automation.
- Moderate exposure to technological disruption through digital platforms and automation in financial services.
Jacobs Solutions Inc.
- Infrastructure and consulting leader with larger workforce and diversified global presence.
- Operates in infrastructure, advanced facilities, and consulting across multiple sectors.
- Exposure through technology and consulting innovation in infrastructure and facilities sectors.
Broadridge Financial Solutions, Inc. vs Jacobs Solutions Inc. Positioning
Broadridge pursues a concentrated strategy centered on financial technology services, benefiting from recurring revenue streams. Jacobs employs a diversified approach across infrastructure and consulting, leveraging a broad sector footprint but with varied revenue sources.
Which has the best competitive advantage?
Broadridge exhibits a very favorable moat with ROIC well above WACC and growing profitability, indicating a durable competitive advantage. Jacobs shows slightly unfavorable moat status, shedding value despite improving profitability.
Stock Comparison
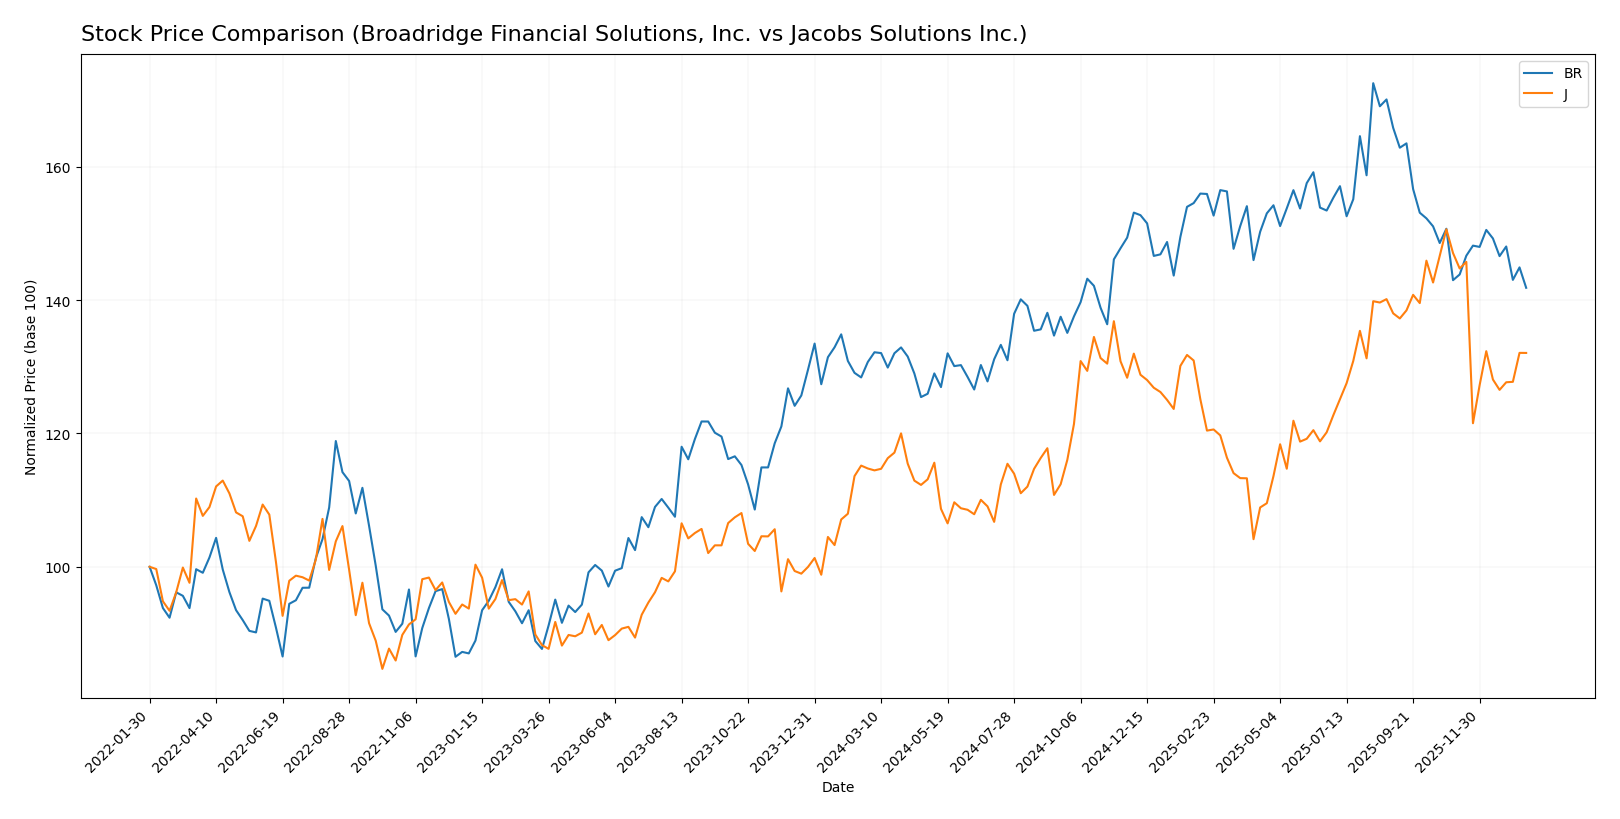
The stock price dynamics over the past 12 months reveal notable bullish trends for both Broadridge Financial Solutions, Inc. (BR) and Jacobs Solutions Inc. (J), with decelerating momentum and recent mild downward adjustments.
Trend Analysis
Broadridge Financial Solutions, Inc. (BR) showed an 8.51% price increase over the past year, indicating a bullish trend with deceleration; volatility is moderate at 17.2, with a recent slight negative slope of -0.8%.
Jacobs Solutions Inc. (J) experienced a 15.1% price gain over the same period, also bullish with deceleration, lower volatility at 11.84, but recent sharper decline of -10.19% indicating increased short-term weakness.
Comparing both, Jacobs Solutions delivered stronger overall market performance with a higher 15.1% gain versus Broadridge’s 8.51%, despite more pronounced recent downtrend signs.
Target Prices
The current analyst consensus provides clear target prices for Broadridge Financial Solutions, Inc. and Jacobs Solutions Inc.
| Company | Target High | Target Low | Consensus |
|---|---|---|---|
| Broadridge Financial Solutions, Inc. | 240 | 240 | 240 |
| Jacobs Solutions Inc. | 160 | 130 | 150.86 |
Analysts expect Broadridge’s stock to reach $240, above its current price of $218.64, indicating potential upside. Jacobs Solutions’ consensus target of $150.86 also suggests moderate growth from its current $139.94 price.
Analyst Opinions Comparison
This section compares analysts’ ratings and grades for Broadridge Financial Solutions, Inc. and Jacobs Solutions Inc.:
Rating Comparison
BR Rating
- Rating: B, evaluated as Very Favorable by analysts.
- Discounted Cash Flow Score: 3, indicating a moderate valuation based on future cash flows.
- ROE Score: 5, very favorable, showing strong profit generation from equity.
- ROA Score: 5, very favorable, reflecting effective use of assets to generate earnings.
- Debt To Equity Score: 1, very unfavorable, indicating higher financial risk due to leverage.
- Overall Score: 3, moderate overall financial standing.
J Rating
- Rating: C+, evaluated as Very Favorable by analysts.
- Discounted Cash Flow Score: 3, also moderate valuation on future cash flows.
- ROE Score: 3, moderate efficiency in generating profit from shareholders’ equity.
- ROA Score: 3, moderate effectiveness in asset utilization.
- Debt To Equity Score: 1, very unfavorable, also indicating higher leverage and financial risk.
- Overall Score: 2, moderate but lower than BR’s overall score.
Which one is the best rated?
Based strictly on the provided data, Broadridge (BR) holds a better rating of B with higher ROE and ROA scores, while Jacobs (J) has a lower C+ rating and generally moderate financial metrics. BR’s overall score is also higher.
Scores Comparison
Here is a comparison of the financial scores for Broadridge Financial Solutions, Inc. and Jacobs Solutions Inc.:
BR Scores
- Altman Z-Score: 4.78, indicating a safe zone status.
- Piotroski Score: 7, reflecting strong financial health.
J Scores
- Altman Z-Score: 3.08, indicating a safe zone status.
- Piotroski Score: 8, reflecting very strong financial health.
Which company has the best scores?
Jacobs Solutions Inc. has a slightly lower Altman Z-Score but remains in the safe zone and a higher Piotroski Score, indicating stronger financial health compared to Broadridge Financial Solutions, Inc.
Grades Comparison
Here is the grades comparison for Broadridge Financial Solutions, Inc. and Jacobs Solutions Inc.:
Broadridge Financial Solutions, Inc. Grades
The following table summarizes recent grades from reputable grading companies for Broadridge Financial Solutions, Inc.:
| Grading Company | Action | New Grade | Date |
|---|---|---|---|
| UBS | Maintain | Neutral | 2025-11-13 |
| Morgan Stanley | Maintain | Equal Weight | 2025-11-05 |
| DA Davidson | Maintain | Neutral | 2025-10-28 |
| UBS | Maintain | Neutral | 2025-08-08 |
| Needham | Maintain | Buy | 2025-08-06 |
| Morgan Stanley | Maintain | Equal Weight | 2025-08-06 |
| RBC Capital | Maintain | Outperform | 2025-05-19 |
| JP Morgan | Maintain | Neutral | 2025-02-03 |
| UBS | Maintain | Neutral | 2025-02-03 |
| RBC Capital | Maintain | Outperform | 2025-02-03 |
The grades for Broadridge Financial Solutions, Inc. mostly reflect a stable outlook, with a consensus rating of “Buy” and a prevalence of neutral to outperform recommendations.
Jacobs Solutions Inc. Grades
Below is a summary of recent grades from recognized grading companies for Jacobs Solutions Inc.:
| Grading Company | Action | New Grade | Date |
|---|---|---|---|
| Citigroup | Maintain | Buy | 2025-11-21 |
| B of A Securities | Maintain | Neutral | 2025-11-21 |
| RBC Capital | Maintain | Outperform | 2025-11-21 |
| Baird | Downgrade | Neutral | 2025-11-21 |
| Truist Securities | Maintain | Hold | 2025-11-21 |
| Wells Fargo | Maintain | Equal Weight | 2025-11-21 |
| Barclays | Maintain | Overweight | 2025-10-20 |
| Keybanc | Maintain | Overweight | 2025-10-20 |
| Citigroup | Maintain | Buy | 2025-10-20 |
| Truist Securities | Maintain | Hold | 2025-10-08 |
Jacobs Solutions Inc. shows a range of grades, mostly positive with several “Buy” and “Overweight” ratings, alongside some neutral and hold recommendations; the consensus rating is also “Buy.”
Which company has the best grades?
Both companies have a consensus rating of “Buy,” but Jacobs Solutions Inc. has received a larger number of buy and overweight grades from analysts, indicating relatively stronger endorsement. This diversity and higher volume of positive grades may suggest greater analyst confidence, potentially influencing investor sentiment and portfolio decisions accordingly.
Strengths and Weaknesses
The table below summarizes key strengths and weaknesses of Broadridge Financial Solutions, Inc. (BR) and Jacobs Solutions Inc. (J) based on their recent financial performance and business characteristics.
| Criterion | Broadridge Financial Solutions, Inc. (BR) | Jacobs Solutions Inc. (J) |
|---|---|---|
| Diversification | Moderate diversification with a focus on recurring fees and distribution revenue streams totaling over 6.7B USD in 2025 | Highly diversified across infrastructure, consulting, aerospace, and technology segments with total revenues exceeding 12.9B USD in 2025 |
| Profitability | High profitability with net margin 12.2%, ROIC 13.1%, and ROE 31.6% in 2025; creating strong shareholder value | Lower profitability with net margin 2.4%, ROIC 6.5%, and ROE 8.0% in 2025; currently shedding value but showing improving profitability trends |
| Innovation | Steady growth in recurring fee revenue and event-driven services indicating operational innovation | Growing ROIC trend and strong performance in advanced facilities and consulting suggest ongoing innovation initiatives |
| Global presence | Global technology and investor communication solutions with expanding recurring revenue base | Broad global footprint in infrastructure and consulting services with significant presence in advanced facilities and aerospace sectors |
| Market Share | Strong position in financial technology and investor services markets | Leading in infrastructure and professional services with solid market share in aerospace and consulting |
Key takeaways: Broadridge demonstrates robust profitability and a durable competitive advantage with focused revenue streams, making it a relatively lower-risk investment. Jacobs offers broader diversification and growth potential but currently faces profitability challenges, warranting cautious consideration and attention to its improving margins.
Risk Analysis
Below is a comparative table outlining key risks for Broadridge Financial Solutions, Inc. (BR) and Jacobs Solutions Inc. (J) based on the latest 2025 data:
| Metric | Broadridge Financial Solutions, Inc. (BR) | Jacobs Solutions Inc. (J) |
|---|---|---|
| Market Risk | Moderate beta at 0.994, stable tech sector exposure | Lower beta at 0.795, diversified global infrastructure exposure |
| Debt level | Debt-to-equity 1.3 (unfavorable), debt-to-assets 40.48% (neutral) | Debt-to-equity 0.74 (neutral), debt-to-assets 24.08% (favorable) |
| Regulatory Risk | High due to financial services industry compliance | Moderate, exposure to multi-sector regulations worldwide |
| Operational Risk | Moderate; technology and process outsourcing reliance | Moderate; complex project management and global operations |
| Environmental Risk | Low to moderate; primarily tech services with limited physical footprint | Moderate; infrastructure projects with environmental impact considerations |
| Geopolitical Risk | Low; US-centric operations with limited foreign exposure | Moderate to high; operations across multiple regions including volatile areas |
In synthesis, Broadridge faces its most significant risks from relatively high leverage and regulatory pressures inherent to financial services. Jacobs’ risk is more influenced by geopolitical exposure and operational complexity across diverse global markets. Both companies maintain financial stability within safe zones according to Altman Z-scores, but Broadridge’s higher debt level and regulatory scrutiny present more impactful risks. Investors should exercise caution with Jacobs regarding geopolitical uncertainties and with Broadridge on debt management.
Which Stock to Choose?
Broadridge Financial Solutions, Inc. (BR) shows a favorable income evolution with a 5.88% revenue growth in 2025 and strong profitability metrics, including a 12.19% net margin and 31.62% ROE. Its debt level is moderate with a net debt to EBITDA of 1.7, yet some liquidity ratios are less favorable. The company holds a very favorable overall rating of B, reflecting solid financial health and value creation with a very favorable economic moat.
Jacobs Solutions Inc. (J) reveals a less favorable income profile, with a 4.6% revenue growth in 2025 but negative net margin growth overall. Profitability ratios are generally weaker, with a 2.41% net margin and 7.97% ROE. The company exhibits a lower debt burden and stronger liquidity ratios but a slightly unfavorable overall rating of C+, indicating moderate financial strength and a slightly unfavorable economic moat despite improving ROIC.
Investors focused on consistent value creation and higher profitability might find BR’s profile more appealing, given its very favorable rating and durable competitive advantage. Conversely, those with tolerance for moderate risk and interest in improving profitability trends could see potential in J, whose financial ratios and income statement present a more neutral to unfavorable pattern but show signs of ROIC improvement.
Disclaimer: Investment carries a risk of loss of initial capital. The past performance is not a reliable indicator of future results. Be sure to understand risks before making an investment decision.
Go Further
I encourage you to read the complete analyses of Broadridge Financial Solutions, Inc. and Jacobs Solutions Inc. to enhance your investment decisions: