Broadcom Inc. (AVGO) and QUALCOMM Incorporated (QCOM) stand as titans in the semiconductor industry, each driving innovation in wireless communications and infrastructure technology. Broadcom excels in diverse segments from enterprise storage to industrial systems, while QUALCOMM leads in wireless technology licensing and chipset development. Given their overlapping markets and strategic innovation, this comparison aims to uncover which company presents the most compelling investment opportunity for your portfolio. Let’s dive in and find out which stock deserves your attention.

Table of contents
Companies Overview
I will begin the comparison between Broadcom and QUALCOMM by providing an overview of these two companies and their main differences.
Broadcom Overview
Broadcom Inc. is a global technology firm specializing in semiconductor and infrastructure software solutions. Headquartered in Palo Alto, California, Broadcom operates through four segments: Wired Infrastructure, Wireless Communications, Enterprise Storage, and Industrial & Other. Its products serve diverse markets, including data centers, telecommunications, and factory automation, reflecting a broad portfolio from discrete devices to complex sub-systems.
QUALCOMM Overview
QUALCOMM Incorporated focuses on developing and commercializing foundational wireless technologies globally. Based in San Diego, California, it operates through three segments: Qualcomm CDMA Technologies, Technology Licensing, and Strategic Initiatives, covering integrated circuits, intellectual property licensing, and early-stage investments. QUALCOMM supports wireless standards like 3G, 4G, and 5G, while also engaging in innovation across AI, automotive, cloud, and IoT sectors.
Key similarities and differences
Both Broadcom and QUALCOMM are major players in the semiconductor industry with a strong presence in wireless communications. Broadcom offers a wider range of hardware and software solutions across multiple sectors, whereas QUALCOMM emphasizes wireless technology development, licensing, and strategic investments. Their business models reflect these focuses: Broadcom’s diversified product segments contrast with QUALCOMM’s technology licensing and R&D-driven approach.
Income Statement Comparison
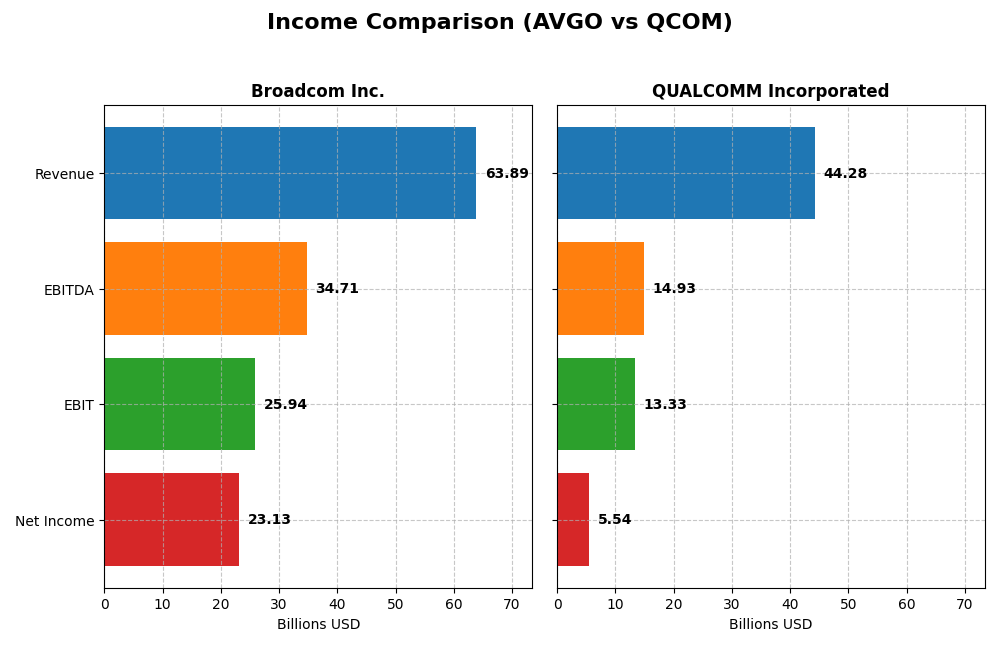
The table below compares the most recent fiscal year income statement figures of Broadcom Inc. and QUALCOMM Incorporated, highlighting key financial metrics for investors.
| Metric | Broadcom Inc. (AVGO) | QUALCOMM Incorporated (QCOM) |
|---|---|---|
| Market Cap | 1.64T | 185.3B |
| Revenue | 63.9B | 44.3B |
| EBITDA | 34.7B | 14.9B |
| EBIT | 25.9B | 13.3B |
| Net Income | 23.1B | 5.5B |
| EPS | 4.91 | 5.06 |
| Fiscal Year | 2025 | 2025 |
Income Statement Interpretations
Broadcom Inc.
Broadcom Inc. has demonstrated strong revenue growth from $27.45B in 2021 to $63.89B in 2025, with net income surging from $6.44B to $23.13B over the same period. Margins have improved notably, with a gross margin of 67.8% and net margin of 36.2% in 2025. The latest year saw an impressive 23.9% revenue growth and a sharp 216.7% net margin increase, indicating expanding profitability.
QUALCOMM Incorporated
QUALCOMM’s revenue rose from $33.57B in 2021 to $44.28B in 2025, but net income declined from $9.04B to $5.54B. Gross and EBIT margins remain favorable at 55.4% and 30.1%, respectively, yet net margin contracted to 12.5%. In 2025, revenue grew 13.7%, but net margin and EPS fell sharply by 51.9% and 44.2%, reflecting deteriorating bottom-line performance despite top-line gains.
Which one has the stronger fundamentals?
Broadcom exhibits stronger fundamentals, with consistent revenue and net income growth, substantial margin expansion, and robust earnings growth. QUALCOMM shows positive revenue trends but suffers from declining net income and margins over the period. Broadcom’s higher and improving profitability metrics contrast with QUALCOMM’s mixed income statement results and weakening bottom-line indicators.
Financial Ratios Comparison
The following table presents the most recent key financial ratios for Broadcom Inc. and QUALCOMM Incorporated, enabling a side-by-side analysis of their fiscal year 2025 performance.
| Ratios | Broadcom Inc. (AVGO) | QUALCOMM Inc. (QCOM) |
|---|---|---|
| ROE | 28.4% | 26.1% |
| ROIC | 16.7% | 30.1% |
| P/E | 73.9 | 32.7 |
| P/B | 21.0 | 8.5 |
| Current Ratio | 1.71 | 2.82 |
| Quick Ratio | 1.58 | 2.10 |
| D/E | 0.80 | 0.70 |
| Debt-to-Assets | 38.1% | 29.5% |
| Interest Coverage | 7.94 | 18.6 |
| Asset Turnover | 0.37 | 0.88 |
| Fixed Asset Turnover | 25.3 | 9.44 |
| Payout Ratio | 48.2% | 68.7% |
| Dividend Yield | 0.65% | 2.10% |
Interpretation of the Ratios
Broadcom Inc.
Broadcom shows a mix of strong and weak ratios, with a notably high net margin of 36.2% and an impressive ROE of 28.45%, signaling efficient profitability. However, its PE ratio of 73.87 and PB ratio of 21.01 raise valuation concerns, alongside a modest dividend yield of 0.65%. The company maintains a slightly favorable overall ratio profile, balancing risks with solid liquidity and coverage metrics.
QUALCOMM Incorporated
QUALCOMM presents generally favorable ratios, including a solid net margin of 12.51% and a healthy ROE of 26.13%. Its PE ratio of 32.7 and PB ratio of 8.54 are more moderate, with a dividend yield of 2.1% reflecting stronger shareholder returns. The firm demonstrates good liquidity and interest coverage, supporting a favorable global ratio opinion with fewer valuation concerns than Broadcom.
Which one has the best ratios?
Considering the ratio evaluations, QUALCOMM holds a more favorable overall profile with 64.29% of its ratios positive, compared to Broadcom’s 50%. QUALCOMM’s stronger liquidity, lower valuation multiples, and higher dividend yield contribute to its superior standing. Broadcom’s higher profitability is offset by stretched valuation and weaker dividend yield, making QUALCOMM the company with the best ratios based on this data.
Strategic Positioning
This section compares the strategic positioning of Broadcom and Qualcomm, focusing on market position, key segments, and exposure to technological disruption:
Broadcom Inc.
- Leading semiconductor firm with significant market cap; faces moderate competitive pressure.
- Diversified segments: Infrastructure Software and Semiconductor Solutions drive revenue growth.
- Moderate exposure to disruption via semiconductor and infrastructure software innovations.
QUALCOMM Incorporated
- Strong player in wireless tech with smaller market cap; active in licensing and hardware segments.
- Concentrated in wireless tech: QCT (chipsets), QTL (licensing), and QSI (early-stage investments).
- High exposure through wireless tech evolution and strategic initiatives in 5G, AI, and IoT investments.
Broadcom Inc. vs QUALCOMM Incorporated Positioning
Broadcom adopts a diversified approach spanning semiconductors and software infrastructure, benefiting from multiple business drivers. Qualcomm is more concentrated on wireless and licensing, leveraging foundational technologies but facing a narrower product scope.
Which has the best competitive advantage?
Broadcom exhibits a very favorable moat with growing ROIC above WACC, indicating durable competitive advantage and increasing profitability. Qualcomm’s moat is slightly favorable with value creation but declining ROIC, signaling less consistent profitability.
Stock Comparison
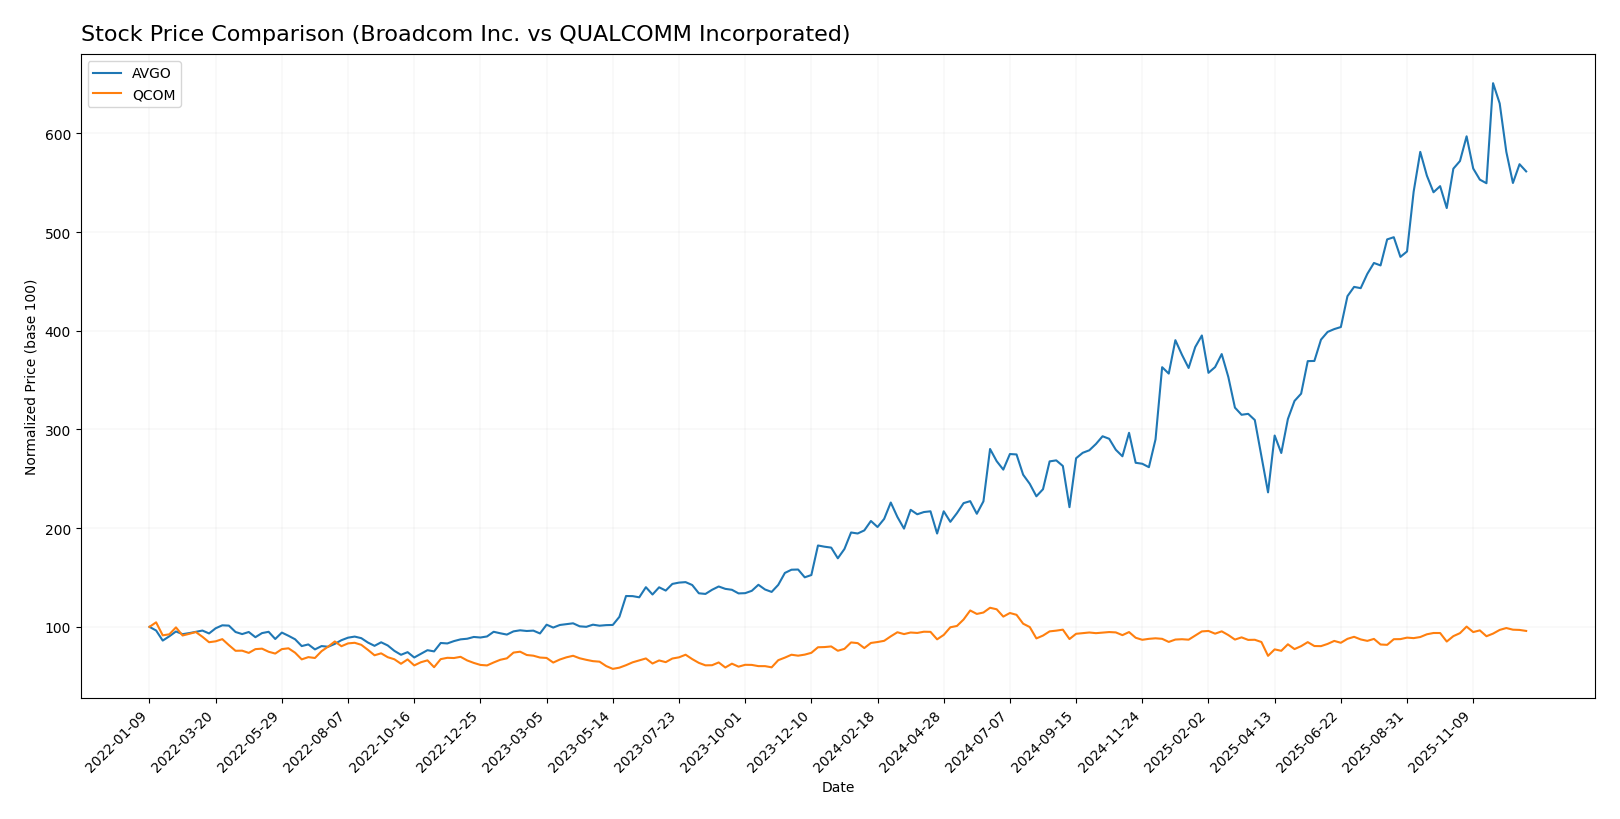
The stock prices of Broadcom Inc. (AVGO) and QUALCOMM Incorporated (QCOM) have shown significant variation over the past 12 months, reflecting distinct trading dynamics and momentum shifts in their respective markets.
Trend Analysis
Broadcom Inc. (AVGO) exhibited a strong bullish trend over the past year, with a remarkable 170.86% price increase, though the trend is currently decelerating. The stock fluctuated between $120.47 and $402.96, with a high volatility level indicated by a standard deviation of 77.85.
QUALCOMM Incorporated (QCOM) also followed a bullish trajectory over the last 12 months, gaining 14.56% with an accelerating upward trend. Its price ranged from $127.46 to $215.33, exhibiting lower volatility compared to AVGO, with a standard deviation of 16.17.
Comparing both stocks, Broadcom delivered the highest market performance with a much larger price appreciation over the analyzed period, despite recent deceleration and higher volatility relative to QUALCOMM.
Target Prices
Analysts present a cautiously optimistic consensus on target prices for Broadcom Inc. and QUALCOMM Incorporated.
| Company | Target High | Target Low | Consensus |
|---|---|---|---|
| Broadcom Inc. | 510 | 420 | 457.64 |
| QUALCOMM Inc. | 210 | 165 | 189 |
The target consensus for Broadcom at $457.64 significantly exceeds its current price of $347.62, indicating strong upside potential. QUALCOMM’s consensus of $189 also suggests moderate appreciation from its current price of $172.98.
Analyst Opinions Comparison
This section compares analysts’ ratings and grades for Broadcom Inc. (AVGO) and QUALCOMM Incorporated (QCOM):
Rating Comparison
AVGO Rating
- Rating: B, considered Very Favorable overall.
- Discounted Cash Flow Score: 3, Moderate rating.
- ROE Score: 5, Very Favorable efficiency.
- ROA Score: 5, Very Favorable asset use.
- Debt To Equity Score: 1, Very Unfavorable risk.
- Overall Score: 3, Moderate financial standing.
QCOM Rating
- Rating: B+, also Very Favorable overall.
- Discounted Cash Flow Score: 4, Favorable rating.
- ROE Score: 5, Very Favorable efficiency.
- ROA Score: 5, Very Favorable asset use.
- Debt To Equity Score: 1, Very Unfavorable risk.
- Overall Score: 3, Moderate financial standing.
Which one is the best rated?
QUALCOMM holds a slightly better rating of B+ compared to Broadcom’s B, supported by a higher discounted cash flow score. Both have equal ROE, ROA, debt-to-equity, and overall scores, indicating similar financial efficiency and risk.
Scores Comparison
Here is a comparison of the Altman Z-Score and Piotroski Score for Broadcom Inc. and QUALCOMM Incorporated:
Broadcom Inc. Scores
- Altman Z-Score: 11.42, indicating a strong safe zone.
- Piotroski Score: 8, classified as very strong financial health.
QUALCOMM Incorporated Scores
- Altman Z-Score: 6.61, indicating a safe zone.
- Piotroski Score: 7, classified as strong financial health.
Which company has the best scores?
Broadcom Inc. has higher scores for both Altman Z-Score and Piotroski Score compared to QUALCOMM. Broadcom shows a stronger financial position and health based solely on these metrics.
Grades Comparison
Here is the grades comparison for Broadcom Inc. and QUALCOMM Incorporated from reputable grading companies:
Broadcom Inc. Grades
The following table shows recent grades assigned to Broadcom Inc. by established grading companies.
| Grading Company | Action | New Grade | Date |
|---|---|---|---|
| Truist Securities | Maintain | Buy | 2025-12-19 |
| UBS | Maintain | Buy | 2025-12-15 |
| Morgan Stanley | Maintain | Overweight | 2025-12-12 |
| JP Morgan | Maintain | Overweight | 2025-12-12 |
| Citigroup | Maintain | Buy | 2025-12-12 |
| Rosenblatt | Maintain | Buy | 2025-12-12 |
| Bernstein | Maintain | Outperform | 2025-12-12 |
| Piper Sandler | Maintain | Overweight | 2025-12-12 |
| Mizuho | Maintain | Outperform | 2025-12-12 |
| Barclays | Maintain | Overweight | 2025-12-12 |
Overall, Broadcom Inc. has consistently maintained positive grades, mostly Buy, Overweight, or Outperform, reflecting strong analyst confidence.
QUALCOMM Incorporated Grades
The table below lists recent grades for QUALCOMM Incorporated from recognized grading companies.
| Grading Company | Action | New Grade | Date |
|---|---|---|---|
| Mizuho | Maintain | Outperform | 2025-11-06 |
| Piper Sandler | Maintain | Overweight | 2025-11-06 |
| Wells Fargo | Maintain | Underweight | 2025-11-06 |
| UBS | Maintain | Neutral | 2025-11-06 |
| Rosenblatt | Maintain | Buy | 2025-11-06 |
| B of A Securities | Maintain | Buy | 2025-11-06 |
| JP Morgan | Maintain | Overweight | 2025-11-04 |
| Citigroup | Maintain | Neutral | 2025-10-28 |
| Rosenblatt | Maintain | Buy | 2025-10-28 |
| UBS | Maintain | Neutral | 2025-10-27 |
QUALCOMM Incorporated exhibits a mixed rating trend, with several Buy and Overweight grades but also some Neutral and Underweight ratings, indicating varying analyst opinions.
Which company has the best grades?
Broadcom Inc. has received more uniformly positive grades, primarily Buy and Overweight, while QUALCOMM Incorporated shows a broader range including Neutral and Underweight. For investors, Broadcom’s stronger consensus may suggest steadier analyst confidence compared to QUALCOMM’s more mixed outlook.
Strengths and Weaknesses
Below is a comparative overview of key strengths and weaknesses for Broadcom Inc. (AVGO) and QUALCOMM Incorporated (QCOM) based on their latest financial and market data.
| Criterion | Broadcom Inc. (AVGO) | QUALCOMM Incorporated (QCOM) |
|---|---|---|
| Diversification | Strong diversification with major revenue from Semiconductor Solutions ($36.9B) and Infrastructure Software ($27.0B) | Moderate diversification, primarily from QCT segment ($38.4B) and QTL ($5.6B) |
| Profitability | High profitability: net margin 36.2%, ROIC 16.65%, ROE 28.45% | Good profitability: net margin 12.5%, ROIC 13.19%, ROE 26.13% |
| Innovation | Very favorable economic moat with growing ROIC (+37%) indicating strong innovation and value creation | Slightly favorable moat but declining ROIC (-52%) signals challenges in sustaining innovation |
| Global presence | Extensive global footprint through diversified software and semiconductor markets | Strong global reach, especially in mobile chipsets and licensing markets |
| Market Share | Large and growing market share in infrastructure software and semiconductor solutions | Significant share in mobile chipset market and licensing but facing competitive pressures |
Key takeaways: Broadcom shows a more robust and growing profitability profile with strong diversification, while QUALCOMM maintains good profitability but faces challenges with declining returns and less diversification. Investors should weigh Broadcom’s durable moat against QUALCOMM’s market position and potential innovation risks.
Risk Analysis
The table below summarizes key risk factors for Broadcom Inc. (AVGO) and QUALCOMM Incorporated (QCOM) based on their latest financial and operational data from 2025.
| Metric | Broadcom Inc. (AVGO) | QUALCOMM Inc. (QCOM) |
|---|---|---|
| Market Risk | Beta 1.204 indicates moderate volatility | Beta 1.214 indicates moderate volatility |
| Debt level | Debt/Equity 0.8 (neutral), Debt/Assets 38.07% (neutral) | Debt/Equity 0.7 (neutral), Debt/Assets 29.54% (favorable) |
| Regulatory Risk | Moderate, given global semiconductor regulations | Moderate, with licensing and patent exposure |
| Operational Risk | High complexity across 4 segments, risk in supply chains | Diversified segments, but dependent on licensing revenues |
| Environmental Risk | Increasing scrutiny on semiconductor manufacturing emissions | Similar industry exposure, ongoing sustainability efforts |
| Geopolitical Risk | Exposure to US-China trade tensions impacting supply chains | Significant risk from global wireless technology disputes |
Broadcom’s higher debt level and complex operations pose moderate financial and operational risks, while QUALCOMM’s reliance on intellectual property and global regulatory challenges are critical. Both face significant geopolitical risks linked to supply chain disruptions and trade tensions, which remain the most impactful uncertainties for investors in 2026.
Which Stock to Choose?
Broadcom Inc. (AVGO) shows strong income growth with a 23.87% revenue increase in 2025 and favorable profitability metrics, including a 36.2% net margin and 28.45% ROE. Its debt level is moderate, with a neutral debt-to-equity ratio, and its overall rating is very favorable.
QUALCOMM Incorporated (QCOM) displays steady income growth of 13.66% in 2025 and favorable financial ratios such as a 26.13% ROE and 12.51% net margin. It maintains lower debt levels with a favorable debt-to-assets ratio and holds a very favorable overall rating.
Investors seeking strong growth and a durable competitive advantage might find AVGO appealing due to its robust income evolution and very favorable moat evaluation. Conversely, those prioritizing financial stability and moderate growth may perceive QCOM’s favorable ratios and safer debt profile as more suitable.
Disclaimer: Investment carries a risk of loss of initial capital. The past performance is not a reliable indicator of future results. Be sure to understand risks before making an investment decision.
Go Further
I encourage you to read the complete analyses of Broadcom Inc. and QUALCOMM Incorporated to enhance your investment decisions: