Home > Comparison > Technology > MSFT vs XYZ
The strategic rivalry between Microsoft Corporation and Block, Inc. shapes the future of the technology sector. Microsoft, a capital-intensive software infrastructure giant, contrasts sharply with Block’s agile, fintech-focused platform model. This head-to-head pits entrenched enterprise dominance against disruptive payment innovation. This analysis aims to identify which company’s trajectory offers superior risk-adjusted returns for a diversified portfolio in a rapidly evolving digital economy.
Table of contents
Companies Overview
Microsoft and Block stand as pivotal innovators in the software infrastructure sector, shaping digital commerce and cloud services globally.
Microsoft Corporation: The Cloud and Productivity Titan
Microsoft dominates as a global leader in software infrastructure, generating revenue from three main segments: Productivity and Business Processes, Intelligent Cloud, and More Personal Computing. Its core engine is cloud services via Azure and enterprise software like Office 365. In 2026, Microsoft intensifies its focus on expanding cloud capabilities and AI integration, reinforcing its competitive edge in enterprise digital transformation.
Block, Inc.: The Digital Payments Disruptor
Block, Inc. drives growth as a digital payments and commerce platform innovator, earning through hardware sales and software solutions like Square Point of Sale and Cash App. Block’s strategic focus in 2026 emphasizes expanding its developer platform and enhancing payment ecosystem integration across multiple international markets, aiming to increase merchant penetration and consumer adoption.
Strategic Collision: Similarities & Divergences
Both firms compete in the software infrastructure space but differ sharply: Microsoft champions a broad cloud and productivity ecosystem, while Block pursues a specialized, integrated payments platform. Their battleground centers on enabling seamless digital commerce through software innovation. Microsoft offers a diversified enterprise investment profile, whereas Block presents a high-beta, growth-focused opportunity in fintech infrastructure.
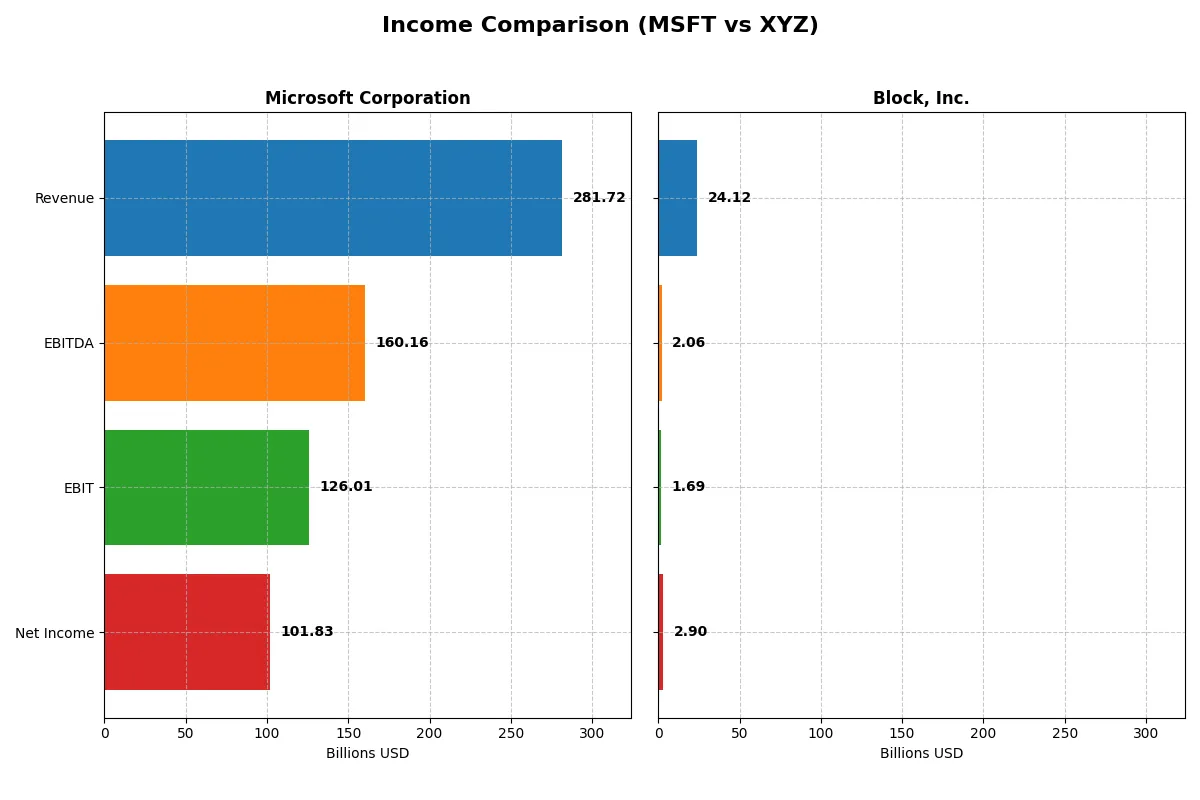
Income Statement Comparison
This data dissects the core profitability and scalability of both corporate engines to reveal who dominates the bottom line:
| Metric | Microsoft Corporation (MSFT) | Block, Inc. (XYZ) |
|---|---|---|
| Revenue | 282B | 24.1B |
| Cost of Revenue | 88B | 15.2B |
| Operating Expenses | 65.4B | 8B |
| Gross Profit | 194B | 8.9B |
| EBITDA | 160.2B | 2.1B |
| EBIT | 126B | 1.7B |
| Interest Expense | 2.4B | 9.3M |
| Net Income | 101.8B | 2.9B |
| EPS | 13.7 | 4.7 |
| Fiscal Year | 2025 | 2024 |
Income Statement Analysis: The Bottom-Line Duel
This income statement comparison reveals which company operates with superior efficiency and sustainable profit generation.
Microsoft Corporation Analysis
Microsoft’s revenue rose impressively from $168B in 2021 to $282B in 2025. Net income followed suit, growing from $61B to $102B. The company maintains robust gross margins near 69% and net margins above 36%. In 2025, Microsoft demonstrated strong momentum with a 15% revenue increase and steady margin expansion, highlighting operational excellence.
Block, Inc. Analysis
Block’s revenue nearly tripled from $9.5B in 2020 to $24.1B in 2024. Net income turned positive after losses, surging to $2.9B in 2024. Gross margin improved to 37%, while net margin reached 12%. The latest year showed explosive EBIT and net income growth, reflecting a rapid operational turnaround and scaling efficiency, albeit from a smaller base.
Margin Dominance vs. Growth Surge
Microsoft delivers superior profitability and margin stability, generating $102B net income on $282B revenue. Block impresses with rapid revenue and profit growth, expanding its net income from a loss to nearly $3B. For investors seeking consistent high-margin returns, Microsoft’s profile leads. Growth-oriented investors may find Block’s dynamic expansion more compelling despite its lower margin base.
Financial Ratios Comparison
These vital ratios act as a diagnostic tool to expose the underlying fiscal health, valuation premiums, and capital efficiency of the companies analyzed:
| Ratios | Microsoft Corporation (MSFT) | Block, Inc. (XYZ) |
|---|---|---|
| ROE | 29.6% | 13.6% |
| ROIC | 22.0% | 3.0% |
| P/E | 36.3 | 18.1 |
| P/B | 10.8 | 2.47 |
| Current Ratio | 1.35 | 2.33 |
| Quick Ratio | 1.35 | 2.31 |
| D/E (Debt-to-Equity) | 0.18 | 0.37 |
| Debt-to-Assets | 9.8% | 21.5% |
| Interest Coverage | 53.9 | 95.9 |
| Asset Turnover | 0.46 | 0.66 |
| Fixed Asset Turnover | 1.23 | 45.1 |
| Payout Ratio | 23.6% | 0% |
| Dividend Yield | 0.65% | 0% |
| Fiscal Year | 2025 | 2024 |
Efficiency & Valuation Duel: The Vital Signs
Financial ratios act as a company’s DNA, exposing hidden risks and revealing operational excellence that shapes investor decisions.
Microsoft Corporation
Microsoft dominates profitability with a 29.65% ROE and a robust 36.15% net margin, signaling operational efficiency. However, its valuation appears stretched at a 36.3 P/E and a 10.76 P/B, making the stock expensive relative to earnings and book value. Shareholders receive modest dividends (0.65%), reflecting a strategy focused more on reinvestment and growth.
Block, Inc.
Block posts a moderate 13.62% ROE and a 12.01% net margin, indicating decent profitability but lower than Microsoft’s. Its valuation is more reasonable, with an 18.1 P/E and 2.47 P/B, suggesting fair pricing. The company does not pay dividends, instead allocating capital towards growth and innovation, consistent with its high R&D intensity.
Premium Valuation vs. Growth Potential
Microsoft trades at a premium but delivers superior returns and operational metrics, while Block offers more attractive valuation with moderate profitability. Investors seeking stability and established profitability may favor Microsoft. Those prioritizing growth and lower valuation might lean towards Block’s profile.
Which one offers the Superior Shareholder Reward?
I observe Microsoft delivers a consistent dividend yield near 0.65%, with a payout ratio around 24%. Its dividends are well covered by free cash flow at 1.54x, signaling sustainability. Microsoft also executes steady buybacks, enhancing total shareholder return. Block, Inc. pays no dividends, reinvesting aggressively into growth and capital expenditures, but its free cash flow yield is modest and operating cash flow coverage weak. Its buyback activity is limited. Given Microsoft’s balanced distribution strategy, robust cash flow, and buybacks, I conclude Microsoft offers a superior and more sustainable total shareholder reward in 2026.
Comparative Score Analysis: The Strategic Profile
The radar chart reveals the fundamental DNA and trade-offs of Microsoft Corporation and Block, Inc., illustrating their core financial strengths and vulnerabilities:
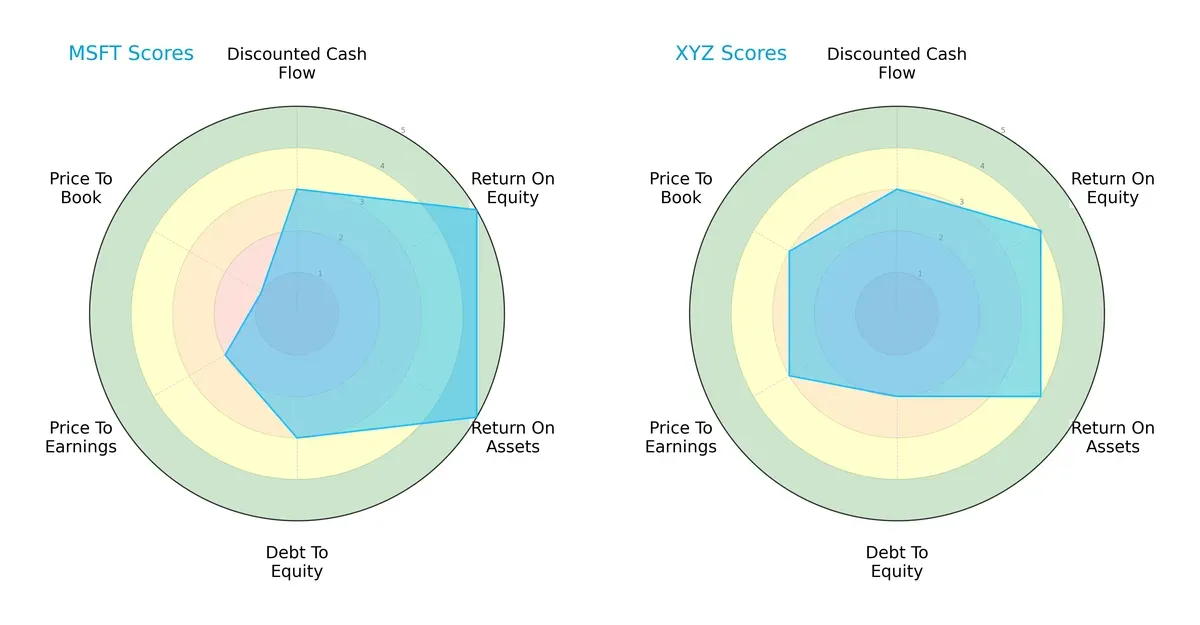
Microsoft dominates in profitability metrics with top ROE and ROA scores (5 each), signaling superior asset and equity efficiency. Block lags slightly with scores of 4 in these areas. Microsoft’s moderate debt-to-equity score (3) contrasts with Block’s weaker balance sheet (2). Valuation profiles differ sharply: Microsoft’s low P/B score (1) flags possible overvaluation risk, while Block’s moderate 3 suggests fairer pricing. Overall, Microsoft presents a more balanced and robust financial profile, whereas Block relies more on valuation appeal.
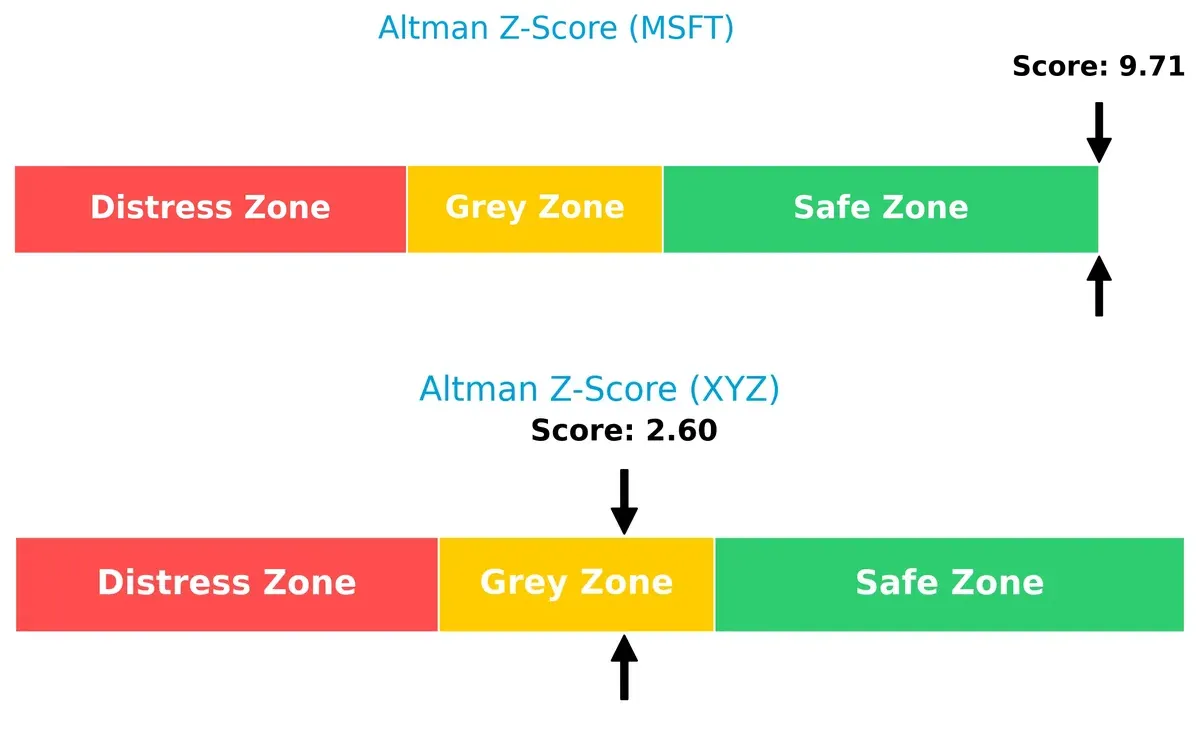
Bankruptcy Risk: Solvency Showdown
Microsoft’s Altman Z-Score of 9.7 places it securely in the safe zone, ensuring strong long-term survival prospects. Block’s 2.6 falls into the grey zone, indicating moderate bankruptcy risk amid current market cycles:
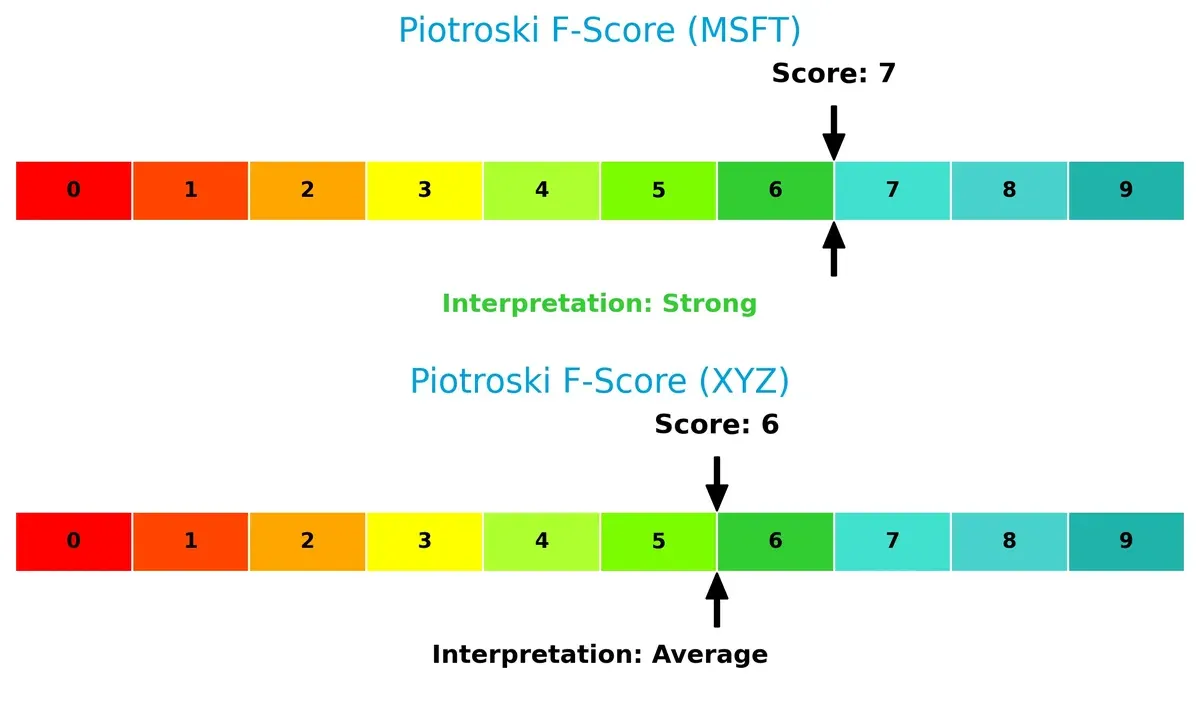
Financial Health: Quality of Operations
Microsoft’s Piotroski F-Score of 7 signals strong operational health with few internal red flags. Block’s score of 6, while decent, suggests average financial quality and potential internal weaknesses relative to Microsoft:
How are the two companies positioned?
This section dissects Microsoft and Block’s operational DNA by comparing their revenue distribution and internal strengths and weaknesses. The goal is to confront their economic moats to identify which model offers the most resilient, sustainable competitive advantage today.
Revenue Segmentation: The Strategic Mix
This visual comparison dissects how Microsoft Corporation and Block, Inc. diversify their income streams and where their primary sector bets lie:
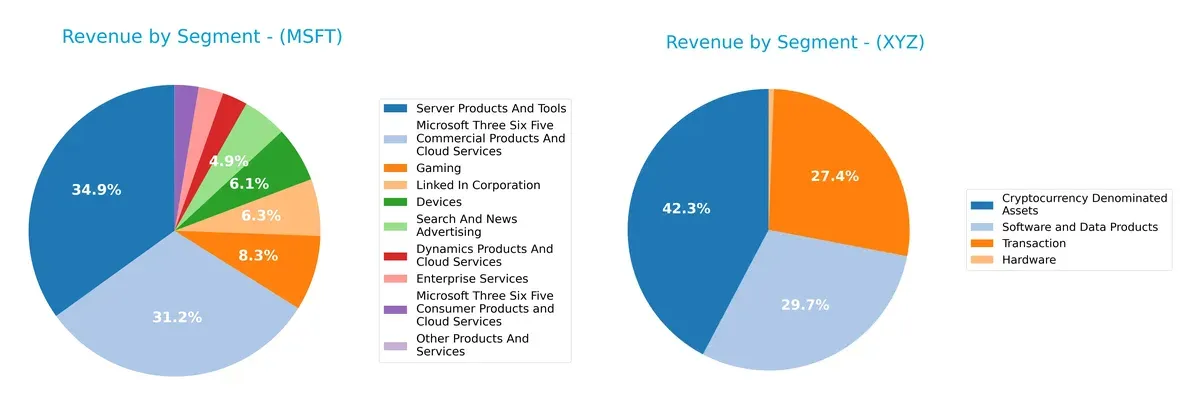
Microsoft dominates with a broad spectrum of segments, anchored by Server Products And Tools at $98.4B and Microsoft 365 Commercial at $87.8B. Block, Inc. relies heavily on Cryptocurrency Denominated Assets at $10.2B and Software and Data Products at $7.2B. Microsoft’s diversified portfolio reduces concentration risk, leveraging cloud and enterprise ecosystems. Block’s focus reveals exposure to crypto market volatility, hinging on emerging fintech infrastructure.
Strengths and Weaknesses Comparison
This table compares the strengths and weaknesses of Microsoft Corporation and Block, Inc.:
Microsoft Corporation Strengths
- Highly diversified revenue streams across cloud, software, gaming, and devices
- Strong profitability with 36.15% net margin and 29.65% ROE
- Favorable leverage metrics with low debt-to-assets at 9.79%
- Global presence with balanced US and Non-US revenues above 130B USD each
- Innovation evident in cloud services and enterprise products
Block, Inc. Strengths
- Favorable liquidity ratios with current and quick ratios above 2.3
- Strong interest coverage ratio at 181.31 indicates excellent debt servicing ability
- Favorable debt metrics with debt-to-assets at 21.53% and moderate leverage
- Solid market presence in software and cryptocurrency asset products
- High fixed asset turnover at 45.14 signaling efficient asset utilization
Microsoft Corporation Weaknesses
- High valuation multiples with PE at 36.31 and PB at 10.76 may pressure returns
- Moderate asset turnover at 0.46 signals less efficient asset use
- Low dividend yield at 0.65% may deter income-focused investors
- Neutral current ratio at 1.35 suggests limited short-term liquidity buffer
Block, Inc. Weaknesses
- Low ROIC of 3.03% below WACC at 14.13%, indicating weak capital efficiency
- Lower profitability with 12.01% net margin and 13.62% ROE
- No dividend yield limits income generation potential
- Smaller global footprint with US revenue dominating at over 22B USD vs. 1.7B Non-US
Microsoft dominates with a broad, globally diversified business and strong profitability supported by balanced capital structure. Block shows excellent liquidity and asset efficiency but struggles with capital returns and geographic concentration. These factors shape each company’s strategic focus on growth and financial resilience.
The Moat Duel: Analyzing Competitive Defensibility
A structural moat is the only reliable shield protecting long-term profits from relentless competitive erosion in dynamic markets:
Microsoft Corporation: Ecosystem Lock-In and Intangible Assets Fortress
Microsoft’s moat stems from vast ecosystem lock-in and valuable intangible assets like Office, Azure, and LinkedIn. This drives a high ROIC (~13% above WACC), sustaining margin stability. In 2026, cloud innovation and AI integration could deepen its dominance or face disruption risks.
Block, Inc.: Emerging Network Effects with Growth Potential
Block leans on network effects in payment processing and Cash App’s expanding user base, contrasting Microsoft’s entrenched ecosystem. Despite a negative ROIC gap versus WACC, its rapidly improving profitability signals strengthening competitive positioning and future market expansion opportunities.
Moat Battle: Deep Ecosystem vs. Nascent Network Growth
Microsoft’s wide, mature moat outpaces Block’s narrower, growing competitive edge. Microsoft’s value creation and margin resilience better defend market share, while Block’s rising ROIC trend shows promise but remains vulnerable.
Which stock offers better returns?
Over the past 12 months, Microsoft’s stock shows a slight bullish trend with decelerating gains, while Block, Inc. faces a clear bearish trend marked by steady price declines and reduced volatility.
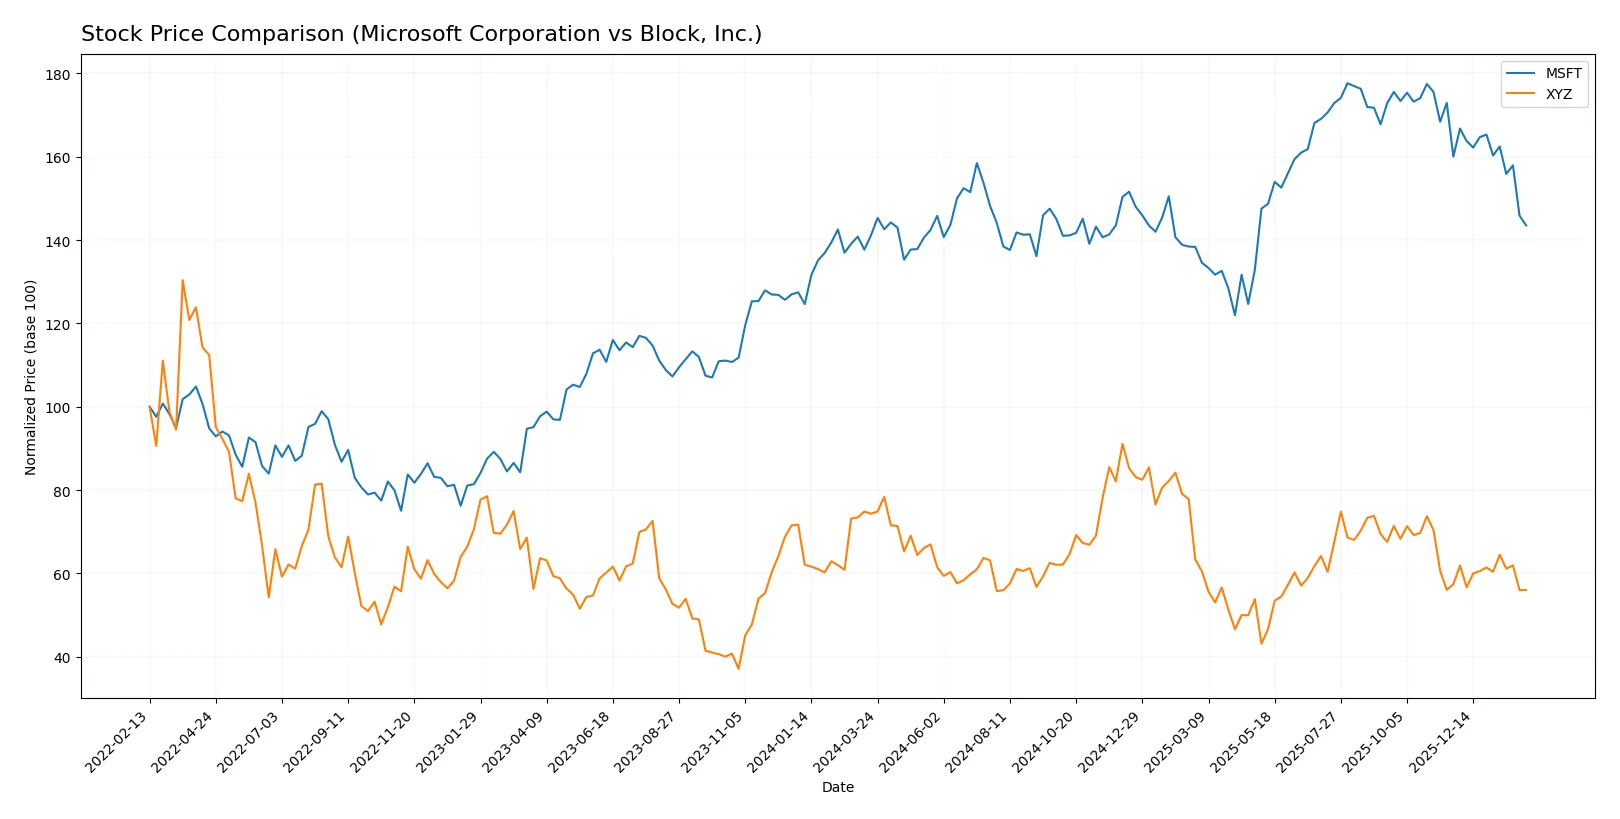
Trend Comparison
Microsoft’s stock rose 1.67% over the past year, indicating a bullish trend with deceleration. Its price peaked at 524.11 and troughed at 359.84, showing high volatility with a 41.8 standard deviation.
Block, Inc.’s stock fell 24.66% over the same period, marking a bearish trend with deceleration. The stock’s price ranged between 98.25 and 46.53, with lower volatility at a 10.41 standard deviation.
Microsoft outperformed Block, Inc. by maintaining positive, albeit slowing, gains, while Block’s stock showed a significant downward trend and weaker market performance.
Target Prices
Analysts set a clear target consensus for Microsoft Corporation and Block, Inc., reflecting optimistic upside from current prices.
| Company | Target Low | Target High | Consensus |
|---|---|---|---|
| Microsoft Corporation | 450 | 675 | 600.04 |
| Block, Inc. | 65 | 100 | 84.92 |
Microsoft’s target consensus exceeds its current price by over 40%, signaling strong growth expectations. Block’s target consensus also suggests significant upside potential from today’s price near 60.

Don’t Let Luck Decide Your Entry Point
Optimize your entry points with our advanced ProRealTime indicators. You’ll get efficient buy signals with precise price targets for maximum performance. Start outperforming now!
How do institutions grade them?
Institutional grades for Microsoft Corporation and Block, Inc. show varied analyst opinions from multiple firms:
Microsoft Corporation Grades
The table below summarizes recent grades from reputable financial institutions for Microsoft Corporation.
| Grading Company | Action | New Grade | Date |
|---|---|---|---|
| Citigroup | Maintain | Buy | 2026-01-30 |
| Wedbush | Maintain | Outperform | 2026-01-29 |
| Cantor Fitzgerald | Maintain | Overweight | 2026-01-29 |
| RBC Capital | Maintain | Outperform | 2026-01-29 |
| Stifel | Maintain | Buy | 2026-01-29 |
| DA Davidson | Maintain | Buy | 2026-01-29 |
| Keybanc | Maintain | Overweight | 2026-01-29 |
| Piper Sandler | Maintain | Overweight | 2026-01-29 |
| Evercore ISI Group | Maintain | Outperform | 2026-01-29 |
| Wells Fargo | Maintain | Overweight | 2026-01-29 |
Block, Inc. Grades
Here are the recent grades from recognized financial firms for Block, Inc.
| Grading Company | Action | New Grade | Date |
|---|---|---|---|
| Piper Sandler | Maintain | Underweight | 2026-01-14 |
| Keefe, Bruyette & Woods | Maintain | Outperform | 2026-01-02 |
| Needham | Maintain | Buy | 2025-11-24 |
| Morgan Stanley | Maintain | Equal Weight | 2025-11-21 |
| B of A Securities | Maintain | Buy | 2025-11-21 |
| Mizuho | Maintain | Outperform | 2025-11-20 |
| Stephens & Co. | Maintain | Overweight | 2025-11-20 |
| BTIG | Maintain | Buy | 2025-11-20 |
| RBC Capital | Maintain | Outperform | 2025-11-20 |
| BTIG | Maintain | Buy | 2025-11-14 |
Which company has the best grades?
Microsoft Corporation consistently receives high marks such as Buy, Outperform, and Overweight from multiple top-tier firms. Block, Inc. has mixed ratings ranging from Underweight to Buy and Outperform. This disparity suggests Microsoft enjoys stronger institutional confidence, which may influence investor sentiment and stock demand.
Risks specific to each company
The following categories identify critical pressure points and systemic threats facing Microsoft Corporation and Block, Inc. in the 2026 market environment:
1. Market & Competition
Microsoft Corporation
- Dominates with diversified software and cloud segments but faces saturation and innovation pressures.
Block, Inc.
- Faces intense competition in payment processing and fintech; smaller scale limits market power.
2. Capital Structure & Debt
Microsoft Corporation
- Low debt-to-equity ratio (0.18) and strong interest coverage (52.84) indicate prudent leverage.
Block, Inc.
- Moderate leverage (0.37 debt-to-equity) but exceptionally high interest coverage (181.31) shows strong debt servicing.
3. Stock Volatility
Microsoft Corporation
- Beta 1.08 suggests moderate volatility aligned with tech sector norms.
Block, Inc.
- High beta of 2.67 signals elevated stock price swings and higher market risk.
4. Regulatory & Legal
Microsoft Corporation
- Large tech firm under scrutiny for antitrust and privacy regulations globally.
Block, Inc.
- Fintech regulatory environment is fluid; compliance complexity increases with international expansion.
5. Supply Chain & Operations
Microsoft Corporation
- Complex global supply chains in hardware and cloud infrastructure with resilient operational management.
Block, Inc.
- Hardware dependence in payments devices poses supply risks; software platform relies on third-party integrations.
6. ESG & Climate Transition
Microsoft Corporation
- Strong ESG commitments and investments in sustainability enhance long-term corporate resilience.
Block, Inc.
- ESG initiatives less mature; climate transition risks may impact reputation and cost structures.
7. Geopolitical Exposure
Microsoft Corporation
- Exposure to US-China tech tensions and international data governance challenges.
Block, Inc.
- Limited global footprint compared to Microsoft but vulnerable to regional regulatory and trade risks.
Which company shows a better risk-adjusted profile?
Microsoft’s dominant market position and robust capital structure provide a safer risk-adjusted profile. Block’s higher volatility and regulatory uncertainty increase its risk despite solid interest coverage.
The most impactful risk for Microsoft is regulatory scrutiny that could limit growth or impose fines. For Block, market volatility and evolving fintech regulations pose the greatest threats. Microsoft’s Altman Z-score of 9.7 confirms its financial safety, while Block’s 2.6 score signals caution. This data underscores Microsoft’s resilience amid systemic risks.
Final Verdict: Which stock to choose?
Microsoft’s superpower lies in its unmatched efficiency and strong value creation, evidenced by a robust ROIC well above its cost of capital. A point of vigilance remains its declining profitability trend and stretched valuation multiples. It suits portfolios seeking steady, long-term growth with a tolerance for premium pricing.
Block, Inc. offers a strategic moat through its evolving growth trajectory and improving profitability, supported by a solid balance sheet and high liquidity ratios. While its value creation is currently negative, the upward ROIC trend signals potential. It fits well within portfolios focused on growth at a reasonable price with a higher risk appetite.
If you prioritize consistent value creation and operational efficiency, Microsoft is the compelling choice due to its dominant market position and strong financial health. However, if you seek growth potential with improving profitability and can tolerate more volatility, Block offers better upside prospects. Each represents a distinct investor profile balancing stability and growth ambition.
Disclaimer: Investment carries a risk of loss of initial capital. The past performance is not a reliable indicator of future results. Be sure to understand risks before making an investment decision.
Go Further
I encourage you to read the complete analyses of Microsoft Corporation and Block, Inc. to enhance your investment decisions: