In the fast-evolving software industry, The Trade Desk, Inc. (TTD) and Bentley Systems, Incorporated (BSY) stand out as innovative leaders with distinct yet overlapping market opportunities. TTD excels in data-driven digital advertising platforms, while BSY specializes in advanced infrastructure engineering software. This comparison explores their growth strategies and market positions to help you identify which company offers the most compelling investment potential in 2026. Let’s dive into the details and find the best fit for your portfolio.
Table of contents
Companies Overview
I will begin the comparison between The Trade Desk and Bentley Systems by providing an overview of these two companies and their main differences.
The Trade Desk Overview
The Trade Desk, Inc. is a technology company specializing in a self-service cloud-based platform that enables buyers to create, manage, and optimize data-driven digital advertising campaigns across multiple formats and devices. Founded in 2009 and headquartered in Ventura, California, it serves advertising agencies and service providers globally, positioning itself as a key player in the digital advertising technology sector.
Bentley Systems Overview
Bentley Systems, Incorporated offers infrastructure engineering software solutions worldwide, covering modeling, simulation, project delivery, and asset performance for infrastructure projects. Established in 1984 and based in Exton, Pennsylvania, Bentley serves a broad spectrum of engineering and geospatial professionals, focusing on civil, structural, and geotechnical industries through an extensive software portfolio.
Key similarities and differences
Both companies operate in the technology sector focusing on software applications, but serve distinct markets: The Trade Desk targets digital advertising buyers, while Bentley Systems caters to infrastructure engineering professionals. The Trade Desk emphasizes cloud-based advertising campaign management, whereas Bentley provides specialized engineering and project delivery software. They differ in scale with Bentley employing 5,500 staff versus 3,522 at The Trade Desk.
Income Statement Comparison
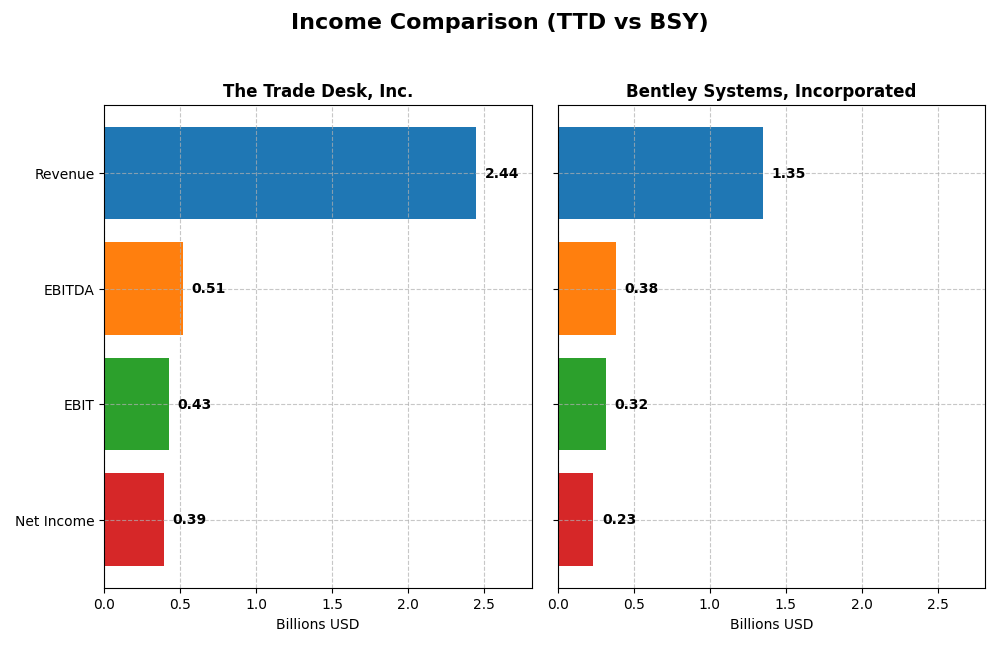
This table compares key income statement metrics for The Trade Desk, Inc. and Bentley Systems, Incorporated, based on their most recent fiscal year data for 2024.
| Metric | The Trade Desk, Inc. | Bentley Systems, Incorporated |
|---|---|---|
| Market Cap | 17.3B | 11.4B |
| Revenue | 2.44B | 1.35B |
| EBITDA | 515M | 382M |
| EBIT | 427M | 318M |
| Net Income | 393M | 242M |
| EPS | 0.80 | 0.75 |
| Fiscal Year | 2024 | 2024 |
Income Statement Interpretations
The Trade Desk, Inc.
The Trade Desk shows strong revenue growth, rising from $836M in 2020 to $2.44B in 2024, with net income increasing from $242M to $393M. Gross margin remained robust around 80%, while net margin slightly declined overall. In 2024, revenue surged 25.63%, net income more than doubled, and margins improved, reflecting enhanced operational efficiency.
Bentley Systems, Incorporated
Bentley Systems recorded steady revenue growth from $801M in 2020 to $1.35B in 2024, with net income rising from $126M to $235M. Gross margin held consistently near 81%, while net margin showed slight fluctuations but remained favorable. In 2024, revenue grew 10.15%, EBIT increased 41.35%, though net margin and EPS declined, indicating mixed profitability trends.
Which one has the stronger fundamentals?
Both companies demonstrate favorable income statement fundamentals, with The Trade Desk showing higher revenue and net income growth rates and strong margin expansion in 2024. Bentley Systems maintains stable margins but faced recent net margin and EPS declines. Overall, The Trade Desk exhibits more pronounced growth and margin improvement, while Bentley offers steadier profitability with some short-term headwinds.
Financial Ratios Comparison
The following table presents a side-by-side comparison of key financial ratios for The Trade Desk, Inc. (TTD) and Bentley Systems, Incorporated (BSY) based on their latest fiscal year 2024 data.
| Ratios | The Trade Desk, Inc. (TTD) | Bentley Systems, Incorporated (BSY) |
|---|---|---|
| ROE | 13.3% | 22.6% |
| ROIC | 10.0% | 9.3% |
| P/E | 147 | 62.6 |
| P/B | 19.6 | 14.1 |
| Current Ratio | 1.86 | 0.54 |
| Quick Ratio | 1.86 | 0.54 |
| D/E | 0.11 | 1.37 |
| Debt-to-Assets | 5.1% | 42.0% |
| Interest Coverage | 0 | 12.2 |
| Asset Turnover | 0.40 | 0.40 |
| Fixed Asset Turnover | 5.17 | 20.47 |
| Payout Ratio | 0% | 30.7% |
| Dividend Yield | 0% | 0.49% |
Interpretation of the Ratios
The Trade Desk, Inc.
The Trade Desk shows mostly favorable ratios, with a strong net margin of 16.08% and robust returns on invested capital (10.02%) and equity (13.33%). The company has a healthy liquidity position with a current ratio of 1.86 and low leverage. Concerns include a very high P/E of 146.77 and a low asset turnover of 0.4. The Trade Desk does not pay dividends, reflecting a reinvestment strategy focused on growth and R&D.
Bentley Systems, Incorporated
Bentley Systems displays a favorable net margin of 17.35% and strong return on equity at 22.55%, but mixed signals arise from a low current ratio of 0.54 and high debt-to-equity of 1.37. Its P/E of 62.63 is elevated, and asset turnover remains low at 0.4. Bentley pays a modest dividend yield of 0.49%, which may indicate limited shareholder returns amid financial constraints.
Which one has the best ratios?
The Trade Desk exhibits a more favorable overall ratio profile, with better liquidity, lower leverage, and solid profitability metrics despite a high valuation. Bentley Systems has stronger equity returns but weaker liquidity and higher financial risk. The Trade Desk’s ratios suggest a better balance between growth potential and financial health in 2024.
Strategic Positioning
This section compares the strategic positioning of The Trade Desk, Inc. and Bentley Systems, Incorporated, including market position, key segments, and exposure to technological disruption:
The Trade Desk, Inc.
- Operates a cloud-based digital advertising platform; faces competition from ad tech and media players.
- Focuses on data-driven digital advertising across multiple formats and devices, serving agencies and advertisers.
- Technology-driven platform exposed to evolving digital advertising trends and data privacy regulations.
Bentley Systems, Incorporated
- Provides infrastructure engineering software globally; competes in niche engineering and modeling software markets.
- Key segments include subscriptions, licenses, and professional services for infrastructure design and asset management.
- Relies on specialized software solutions; may face disruption from emerging modeling and simulation technologies.
The Trade Desk, Inc. vs Bentley Systems, Incorporated Positioning
The Trade Desk pursues a concentrated strategy in digital advertising technology, while Bentley Systems follows a diversified approach with broad infrastructure software solutions. The Trade Desk’s focus on advertising platforms contrasts with Bentley’s multi-segment engineering software, reflecting different market scopes and complexity.
Which has the best competitive advantage?
Both companies show slightly unfavorable MOATs with declining ROIC trends and are shedding value. The Trade Desk’s ROIC is closer to WACC, indicating marginally better capital efficiency than Bentley Systems, but neither currently demonstrates a strong competitive advantage.
Stock Comparison
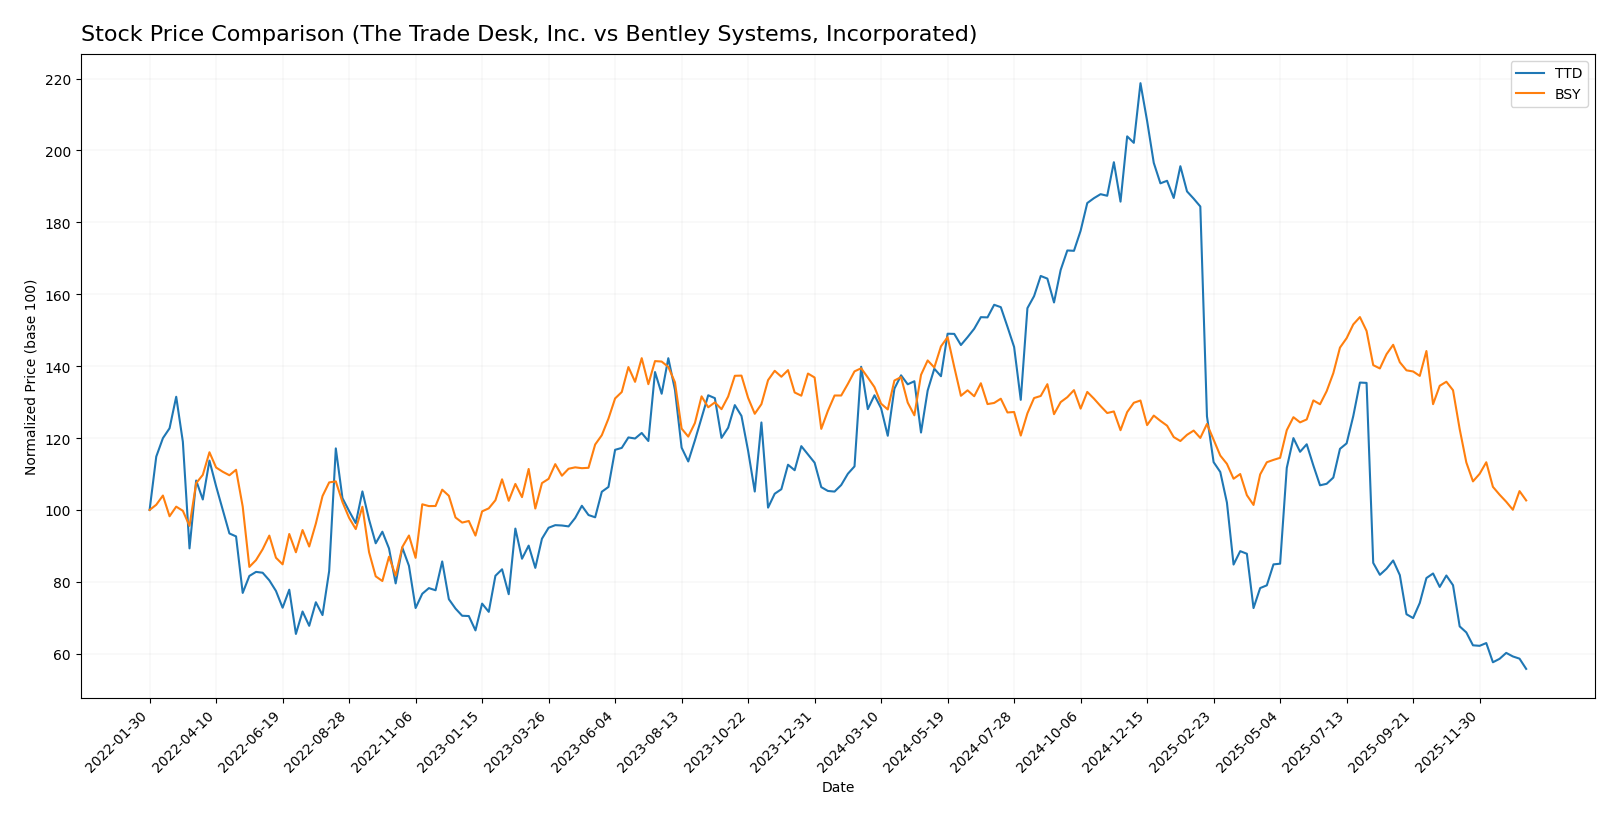
The past year has seen significant price declines for both The Trade Desk, Inc. (TTD) and Bentley Systems, Incorporated (BSY), with notable bearish trends and decelerating momentum impacting their trading dynamics.
Trend Analysis
The Trade Desk, Inc. (TTD) exhibited a bearish trend over the past 12 months with a price decline of 56.43%. The trend showed deceleration and high volatility, reflected by a 28.36 standard deviation and a range between $35.48 and $139.11.
Bentley Systems, Incorporated (BSY) also experienced a bearish trend over the same period, with a price decrease of 24.99%. This trend decelerated as well, featuring lower volatility with a 4.63 standard deviation and a price range from $38.15 to $58.59.
Comparing both stocks, TTD delivered the steepest market decline, underperforming BSY which showed a less severe bearish trend in the last year.
Target Prices
The target price consensus for these technology companies suggests potential upside from current levels.
| Company | Target High | Target Low | Consensus |
|---|---|---|---|
| The Trade Desk, Inc. | 98 | 39 | 56.73 |
| Bentley Systems, Incorporated | 55 | 45 | 48.75 |
Analysts expect The Trade Desk to trade significantly higher than its current price of 35.48 USD, while Bentley Systems’ consensus target is moderately above its current price of 39.14 USD. This indicates potential appreciation opportunities in both stocks.
Analyst Opinions Comparison
This section compares analysts’ ratings and financial scores for The Trade Desk, Inc. and Bentley Systems, Incorporated:
Rating Comparison
The Trade Desk, Inc. Rating
- Rating: B, classified as Very Favorable by analysts.
- Discounted Cash Flow Score: 4, indicating a Favorable valuation.
- ROE Score: 4, showing strong profit generation from equity.
- ROA Score: 4, reflecting effective asset utilization.
- Debt To Equity Score: 3, a Moderate financial risk profile.
- Overall Score: 3, representing a Moderate overall financial rating.
Bentley Systems, Incorporated Rating
- Rating: B-, also classified as Very Favorable by analysts.
- Discounted Cash Flow Score: 4, indicating a Favorable valuation.
- ROE Score: 4, showing strong profit generation from equity.
- ROA Score: 4, reflecting effective asset utilization.
- Debt To Equity Score: 1, indicating a Very Unfavorable risk level.
- Overall Score: 3, representing a Moderate overall financial rating.
Which one is the best rated?
Based on the provided data, The Trade Desk, Inc. holds a slightly higher rating (B) compared to Bentley Systems’ B-. Both share identical favorable scores in cash flow, ROE, ROA, and overall rating, but The Trade Desk reports a stronger debt-to-equity score, implying a more moderate financial risk profile.
Scores Comparison
Here is a comparison of the key financial scores for The Trade Desk, Inc. and Bentley Systems, Incorporated:
TTD Scores
- Altman Z-Score: 4.30, indicating a safe zone with low bankruptcy risk.
- Piotroski Score: 5, indicating average financial strength.
BSY Scores
- Altman Z-Score: 3.74, indicating a safe zone with low bankruptcy risk.
- Piotroski Score: 9, indicating very strong financial strength.
Which company has the best scores?
Based on the data, Bentley Systems has a slightly lower Altman Z-Score but remains in the safe zone and a significantly higher Piotroski Score than The Trade Desk, indicating stronger overall financial health.
Grades Comparison
Here is a comparison of recent grades assigned to The Trade Desk, Inc. and Bentley Systems, Incorporated by reputable grading companies:
The Trade Desk, Inc. Grades
The following table summarizes recent analyst grades for The Trade Desk, Inc.:
| Grading Company | Action | New Grade | Date |
|---|---|---|---|
| Morgan Stanley | Maintain | Equal Weight | 2026-01-13 |
| Wells Fargo | Maintain | Equal Weight | 2026-01-12 |
| Cantor Fitzgerald | Maintain | Neutral | 2026-01-08 |
| Wolfe Research | Maintain | Outperform | 2026-01-06 |
| Guggenheim | Maintain | Buy | 2026-01-05 |
| Jefferies | Maintain | Hold | 2025-12-11 |
| Wedbush | Maintain | Neutral | 2025-12-08 |
| DA Davidson | Maintain | Buy | 2025-11-10 |
| Truist Securities | Maintain | Buy | 2025-11-07 |
| Wells Fargo | Maintain | Equal Weight | 2025-11-07 |
Overall, The Trade Desk exhibits a consistent pattern of moderate to positive ratings, with the majority of grades clustered around Buy, Outperform, and Equal Weight.
Bentley Systems, Incorporated Grades
The following table summarizes recent analyst grades for Bentley Systems, Incorporated:
| Grading Company | Action | New Grade | Date |
|---|---|---|---|
| Piper Sandler | Downgrade | Neutral | 2026-01-13 |
| Barclays | Maintain | Equal Weight | 2026-01-12 |
| RBC Capital | Maintain | Outperform | 2026-01-05 |
| Baird | Maintain | Outperform | 2025-11-06 |
| Rosenblatt | Maintain | Buy | 2025-11-06 |
| Piper Sandler | Maintain | Overweight | 2025-11-06 |
| JP Morgan | Maintain | Neutral | 2025-11-06 |
| Rosenblatt | Upgrade | Buy | 2025-10-17 |
| Piper Sandler | Maintain | Overweight | 2025-08-07 |
| Goldman Sachs | Maintain | Sell | 2025-08-07 |
Bentley Systems shows a mixed set of ratings, ranging from Sell to Outperform and Overweight, with recent downgrades to Neutral by some analysts.
Which company has the best grades?
The Trade Desk, Inc. has more consistent Buy and Outperform ratings, while Bentley Systems, Incorporated shows a wider spread including Sell and Neutral grades. This suggests The Trade Desk may be viewed more favorably by analysts, which could influence investor confidence and portfolio positioning.
Strengths and Weaknesses
Below is a comparison of The Trade Desk, Inc. (TTD) and Bentley Systems, Incorporated (BSY) based on key investment criteria:
| Criterion | The Trade Desk, Inc. (TTD) | Bentley Systems, Incorporated (BSY) |
|---|---|---|
| Diversification | Focused on digital advertising technology; moderate product range | Diversified software solutions with heavy subscription and license revenues |
| Profitability | Net margin 16.08%, ROIC 10.02%, favorable profitability but declining ROIC trend | Net margin 17.35%, ROIC 9.3%, good profitability but steeply declining ROIC trend |
| Innovation | Consistent innovation in ad tech; moderate asset turnover (0.4) | Strong innovation in engineering software; high fixed asset turnover (20.47) |
| Global presence | Strong digital advertising presence worldwide | Global reach in engineering and design software sector |
| Market Share | High valuation multiples (PE 146.77, PB 19.56) indicate premium market position | Lower valuation multiples (PE 62.63, PB 14.13) but less favorable liquidity ratios |
Key takeaways: Both companies show strong profitability and innovation, but each faces challenges. TTD has favorable margins and liquidity but a slightly unfavorable moat due to declining ROIC. BSY’s diversified subscription model is robust, yet it suffers from declining profitability metrics and liquidity concerns. Caution and risk management remain essential when considering either stock.
Risk Analysis
Below is a comparison table highlighting key risks for The Trade Desk, Inc. (TTD) and Bentley Systems, Incorporated (BSY) as of 2024:
| Metric | The Trade Desk, Inc. (TTD) | Bentley Systems, Incorporated (BSY) |
|---|---|---|
| Market Risk | Moderate (Beta 1.105) | Higher (Beta 1.214) |
| Debt level | Low (Debt/Equity 0.11) | High (Debt/Equity 1.37) |
| Regulatory Risk | Moderate (Tech sector) | Moderate (Global infrastructure software) |
| Operational Risk | Low (Strong cloud platform) | Moderate (Complex infrastructure solutions) |
| Environmental Risk | Low | Low |
| Geopolitical Risk | Moderate (Global ad markets) | Moderate (Global infrastructure markets) |
The most impactful risks are Bentley Systems’ elevated debt level and market volatility, which could pressure its financial stability despite strong profitability scores. The Trade Desk faces market and regulatory risks but benefits from low debt and strong liquidity, reducing its bankruptcy risk. Both companies operate globally, exposing them to geopolitical uncertainties.
Which Stock to Choose?
The Trade Desk, Inc. (TTD) shows a strong income growth with a 25.63% revenue increase in 2024 and favorable profitability metrics, including a 16.08% net margin. Financial ratios are mostly positive, with low debt levels and a very favorable rating of B, though valuation ratios like P/E are high. The company’s economic moat appears slightly unfavorable due to declining ROIC, despite a solid balance sheet.
Bentley Systems, Incorporated (BSY) exhibits moderate income growth of 10.15% in 2024 and favorable profitability with a 17.35% net margin. However, financial ratios reveal higher debt and weaker liquidity, resulting in a slightly unfavorable global ratios opinion. Its rating is also very favorable at B-, supported by a very strong Piotroski score but challenged by elevated leverage and valuation metrics.
Considering ratings and financial evaluations, TTD’s strong income growth and healthier balance sheet might appeal to growth-oriented investors, while BSY’s stable profitability and strong financial health scores could be more attractive to those seeking quality with moderate growth. Both stocks face bearish price trends with deceleration, suggesting caution.
Disclaimer: Investment carries a risk of loss of initial capital. The past performance is not a reliable indicator of future results. Be sure to understand risks before making an investment decision.
Go Further
I encourage you to read the complete analyses of The Trade Desk, Inc. and Bentley Systems, Incorporated to enhance your investment decisions: