In today’s fast-evolving tech landscape, Bentley Systems, Incorporated (BSY) and ServiceTitan, Inc. (TTAN) stand out as innovators in software applications serving critical infrastructure and service industries. Bentley focuses on engineering and infrastructure design, while ServiceTitan streamlines field service operations for residential and commercial markets. Their overlapping emphasis on digital transformation and operational efficiency makes this comparison timely. Join me as we explore which company offers the most compelling investment opportunity for your portfolio.

Table of contents
Companies Overview
I will begin the comparison between Bentley Systems and ServiceTitan by providing an overview of these two companies and their main differences.
Bentley Systems Overview
Bentley Systems, Incorporated specializes in infrastructure engineering software solutions, serving markets across the Americas, Europe, the Middle East, Africa, and Asia-Pacific. The company provides open modeling, simulation applications, and project delivery systems for infrastructure design and asset management. Founded in 1984 and headquartered in Exton, PA, Bentley employs about 5,500 staff and is listed on NASDAQ with a market cap of $11.4B.
ServiceTitan Overview
ServiceTitan, Inc. focuses on software for field service operations involving installation, maintenance, and servicing of residential and commercial infrastructure systems. Founded in 2008 and based in Glendale, CA, ServiceTitan offers a technology platform tailored to streamline service activities. It employs roughly 3,050 people and is publicly traded on NASDAQ with a market cap of $8.5B.
Key similarities and differences
Both Bentley and ServiceTitan operate in the technology sector under the software application industry, serving infrastructure-related markets. Bentley concentrates on infrastructure engineering and asset management software for civil and geotechnical professionals, while ServiceTitan targets field service management for residential and commercial systems. Bentley’s global footprint and broader product suite contrast with ServiceTitan’s focus on field service software primarily in the building services sector.
Income Statement Comparison
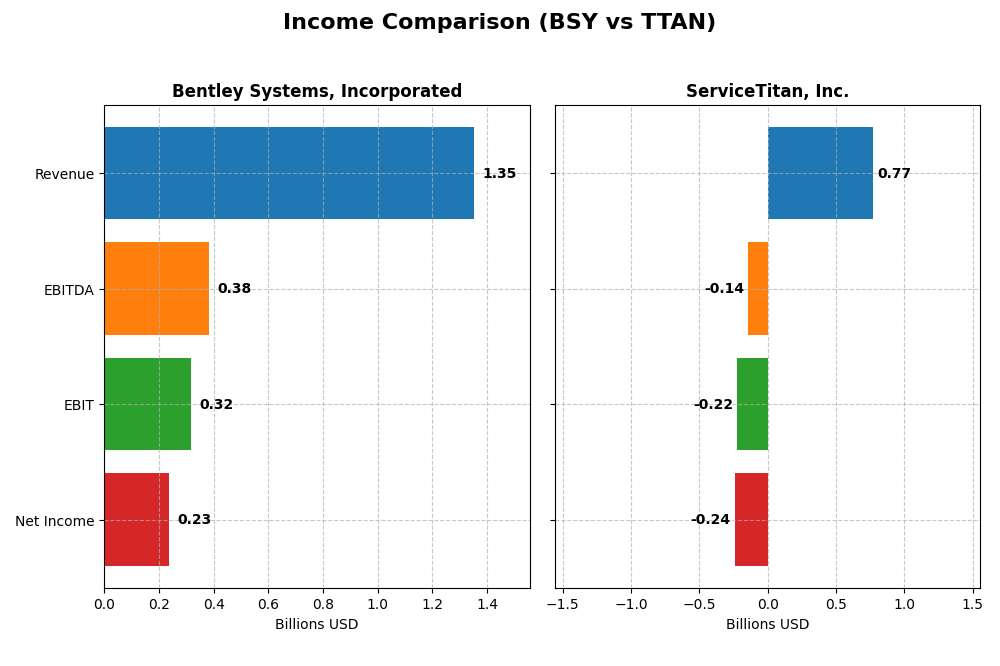
The table below compares key income statement metrics for Bentley Systems, Incorporated and ServiceTitan, Inc. for their most recent fiscal years.
| Metric | Bentley Systems, Incorporated | ServiceTitan, Inc. |
|---|---|---|
| Market Cap | 11.4B | 8.5B |
| Revenue | 1.35B | 772M |
| EBITDA | 382M | -141M |
| EBIT | 318M | -221M |
| Net Income | 235M | -239M |
| EPS | 0.75 | -8.53 |
| Fiscal Year | 2024 | 2025 |
Income Statement Interpretations
Bentley Systems, Incorporated
Bentley Systems exhibited strong revenue growth from 2020 to 2024, increasing from 801.5M to 1.35B, with net income rising from 126.3M to 234.8M. Margins remained robust, highlighted by an 80.95% gross margin and a 17.35% net margin in 2024. In the latest year, revenue growth slowed slightly to 10.15%, while net margin declined by 34.77%, reflecting some compression despite overall favorable profitability.
ServiceTitan, Inc.
ServiceTitan’s revenue climbed sharply from 468M in 2023 to 772M in 2025, supported by a 25.64% growth rate in the latest year. However, the company reported consistent net losses, with net income falling to -239.1M in 2025. Gross margin held at a favorable 64.9%, but EBIT and net margins remained negative, indicating ongoing operational challenges despite revenue expansion and improved net margin growth overall.
Which one has the stronger fundamentals?
Bentley Systems demonstrates stronger fundamentals with solid revenue and net income growth, favorable margins, and stable profitability metrics. ServiceTitan shows impressive top-line expansion but continues to face significant net losses and negative operating margins, limiting its fundamental strength. Bentley’s overall income statement performance is more favorable, indicating greater financial stability and profitability.
Financial Ratios Comparison
The table below presents the most recent financial ratios for Bentley Systems, Incorporated (BSY) and ServiceTitan, Inc. (TTAN), reflecting their fiscal year 2024 and 2025 performance respectively.
| Ratios | Bentley Systems, Incorporated (BSY) | ServiceTitan, Inc. (TTAN) |
|---|---|---|
| ROE | 22.6% | -16.4% |
| ROIC | 9.3% | -14.1% |
| P/E | 62.6 | -18.1 |
| P/B | 14.1 | 3.0 |
| Current Ratio | 0.54 | 3.74 |
| Quick Ratio | 0.54 | 3.74 |
| D/E | 1.37 | 0.11 |
| Debt-to-Assets | 42.0% | 9.4% |
| Interest Coverage | 12.2 | -14.8 |
| Asset Turnover | 0.40 | 0.44 |
| Fixed Asset Turnover | 20.5 | 9.6 |
| Payout ratio | 30.7% | 0% |
| Dividend yield | 0.49% | 0% |
Interpretation of the Ratios
Bentley Systems, Incorporated
Bentley Systems shows strong profitability with a favorable net margin of 17.35% and return on equity at 22.55%. However, concerns arise from its high price-to-earnings ratio of 62.63, low liquidity ratios around 0.54, and a debt-to-equity ratio of 1.37, all marked unfavorable. The company pays dividends with a low yield of 0.49%, suggesting modest shareholder returns.
ServiceTitan, Inc.
ServiceTitan exhibits weak profitability metrics, including a negative net margin of -30.98% and return on equity at -16.44%. Liquidity is solid with a current ratio of 3.74, while leverage remains low at 0.11 debt-to-equity. The firm does not pay dividends, reflecting its investment in growth and R&D, consistent with its negative earnings and cash flow challenges.
Which one has the best ratios?
Both companies share a slightly unfavorable global ratio outlook with 50% unfavorable metrics. Bentley Systems benefits from stronger profitability and dividend payments but struggles with valuation and liquidity. ServiceTitan maintains better liquidity and leverage but faces significant profitability and cash flow weaknesses, complicating a clear preference based on ratios alone.
Strategic Positioning
This section compares the strategic positioning of Bentley Systems and ServiceTitan, covering market position, key segments, and exposure to technological disruption:
Bentley Systems, Incorporated (BSY)
- Established software provider with strong global infrastructure market presence and some competitive pressure.
- Diversified software offerings including infrastructure design, simulation, project delivery, and asset performance management.
- Exposure to traditional software disruption risks; invests in open modeling and simulation for infrastructure engineering.
ServiceTitan, Inc. (TTAN)
- Newer software application company focused on field services for residential and commercial infrastructure.
- Concentrated on platform and subscription revenues for field service management in building infrastructure.
- Faces technological disruption typical of service management platforms but benefits from subscription-based model.
BSY vs TTAN Positioning
BSY pursues a diversified approach across multiple infrastructure software segments, offering broad solutions but facing complex market pressures. TTAN concentrates on field service software, enabling focused growth but with narrower market exposure.
Which has the best competitive advantage?
Both BSY and TTAN are shedding value with ROIC below WACC. BSY shows declining returns, while TTAN’s profitability is stable but unfavorable, indicating neither currently holds a strong economic moat.
Stock Comparison
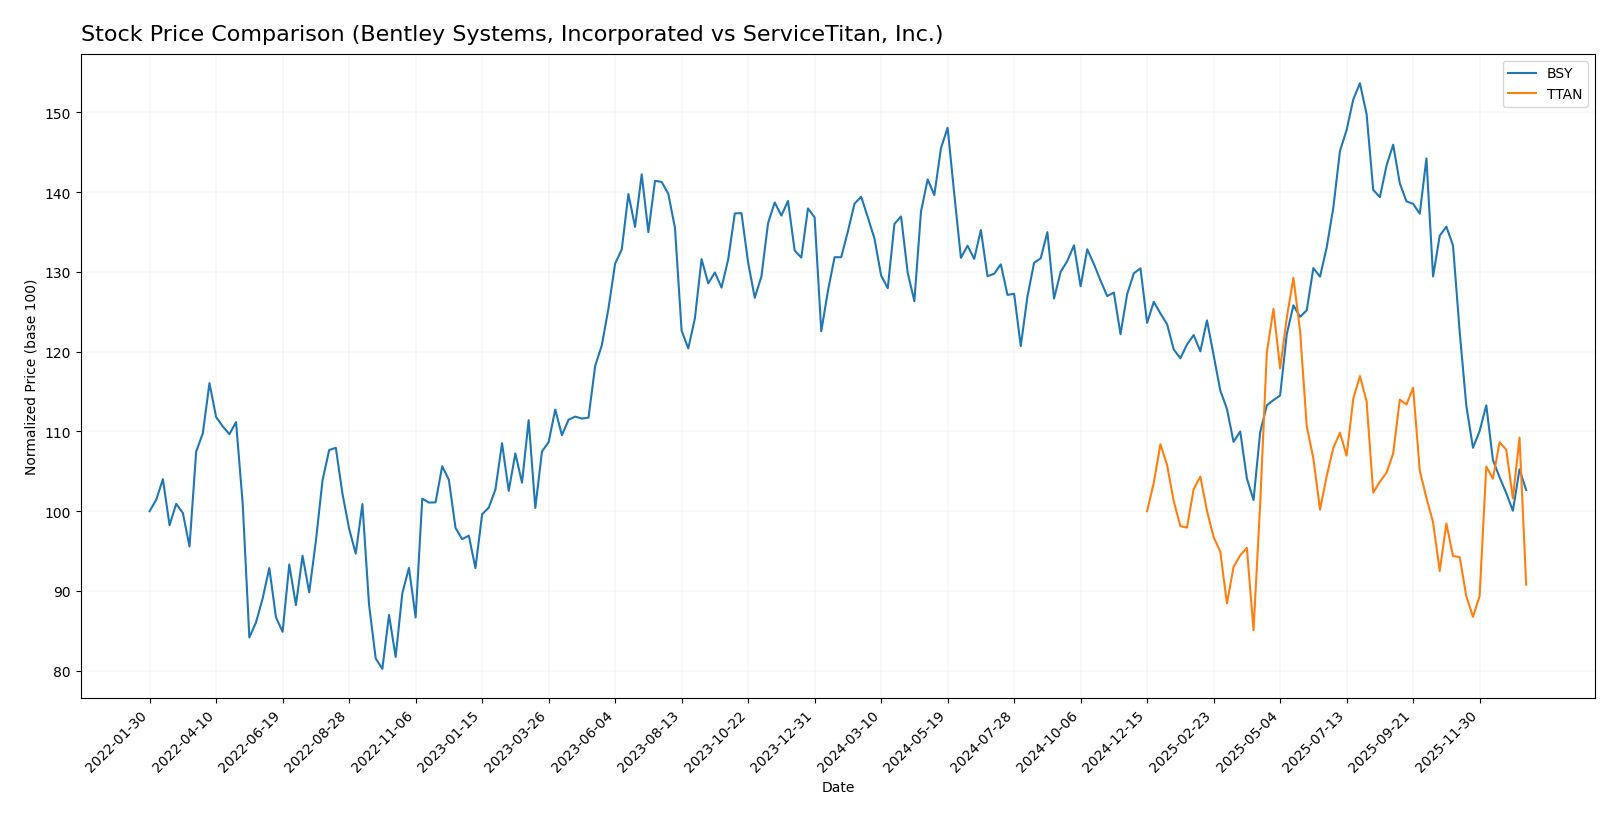
The past 12 months reveal pronounced bearish trends in both Bentley Systems, Incorporated (BSY) and ServiceTitan, Inc. (TTAN), with BSY experiencing a sharper decline and TTAN showing signs of recent trend acceleration despite ongoing downward pressure.
Trend Analysis
Bentley Systems, Incorporated (BSY) registered a -24.99% price change over the past year, indicating a clear bearish trend marked by deceleration. The stock’s volatility measured by a 4.63 std deviation, with highs at 58.59 and lows at 38.15.
ServiceTitan, Inc. (TTAN) also trended bearish with a -9.22% change but showed acceleration in its downward trend. Its volatility was higher at 9.86 std deviation, spanning a high of 129.26 and a low of 85.07.
Comparing both, BSY delivered the lowest market performance with a steeper decline, while TTAN’s less severe drop and recent acceleration suggest a more dynamic price movement.
Target Prices
Analysts present a positive target price consensus for both Bentley Systems, Incorporated and ServiceTitan, Inc.
| Company | Target High | Target Low | Consensus |
|---|---|---|---|
| Bentley Systems, Incorporated | 55 | 45 | 48.75 |
| ServiceTitan, Inc. | 145 | 117 | 132.44 |
The target consensus prices for Bentley Systems and ServiceTitan significantly exceed their current stock prices of $39.14 and $90.78, respectively, indicating analyst expectations of notable upside potential.
Analyst Opinions Comparison
This section compares analysts’ ratings and grades for Bentley Systems, Incorporated and ServiceTitan, Inc.:
Rating Comparison
BSY Rating
- Rating: B-, considered very favorable overall.
- Discounted Cash Flow Score: 4, indicating a favorable valuation outlook.
- ROE Score: 4, showing favorable profit generation from equity.
- ROA Score: 4, demonstrating favorable asset utilization to generate earnings.
- Debt To Equity Score: 1, reflecting a very unfavorable financial risk profile.
- Overall Score: 3, considered moderate.
TTAN Rating
- Rating: C-, also considered very favorable overall.
- Discounted Cash Flow Score: 1, indicating a very unfavorable valuation outlook.
- ROE Score: 1, showing very unfavorable profit generation from equity.
- ROA Score: 1, demonstrating very unfavorable asset utilization to generate earnings.
- Debt To Equity Score: 3, reflecting a moderate financial risk profile.
- Overall Score: 1, considered very unfavorable.
Which one is the best rated?
Based strictly on the data, BSY has better ratings with favorable scores in discounted cash flow, ROE, and ROA, despite a weak debt to equity score. TTAN scores lower overall, with most metrics rated very unfavorable except for a moderate debt to equity score.
Scores Comparison
The scores comparison of Bentley Systems (BSY) and ServiceTitan (TTAN) is as follows:
BSY Scores
- Altman Z-Score: 3.74, indicating a safe zone of financial stability.
- Piotroski Score: 9, reflecting very strong financial health.
TTAN Scores
- Altman Z-Score: 15.74, indicating a safe zone of financial stability.
- Piotroski Score: 6, reflecting average financial health.
Which company has the best scores?
Based on the data, TTAN has a higher Altman Z-Score indicating very strong financial safety, while BSY has a superior Piotroski Score reflecting stronger overall financial health. Each excels in different financial strength measures.
Grades Comparison
Here is a comparison of the recent grades assigned to Bentley Systems, Incorporated and ServiceTitan, Inc.:
Bentley Systems, Incorporated Grades
The following table summarizes recent grades from notable grading companies for Bentley Systems:
| Grading Company | Action | New Grade | Date |
|---|---|---|---|
| Piper Sandler | Downgrade | Neutral | 2026-01-13 |
| Barclays | Maintain | Equal Weight | 2026-01-12 |
| RBC Capital | Maintain | Outperform | 2026-01-05 |
| Baird | Maintain | Outperform | 2025-11-06 |
| Rosenblatt | Maintain | Buy | 2025-11-06 |
| Piper Sandler | Maintain | Overweight | 2025-11-06 |
| JP Morgan | Maintain | Neutral | 2025-11-06 |
| Rosenblatt | Upgrade | Buy | 2025-10-17 |
| Piper Sandler | Maintain | Overweight | 2025-08-07 |
| Goldman Sachs | Maintain | Sell | 2025-08-07 |
Bentley Systems’ grades show a mix from Neutral to Outperform, with some recent downgrades and a notable Sell rating maintained by Goldman Sachs.
ServiceTitan, Inc. Grades
The following table summarizes recent grades from notable grading companies for ServiceTitan:
| Grading Company | Action | New Grade | Date |
|---|---|---|---|
| Piper Sandler | Maintain | Overweight | 2025-12-05 |
| BMO Capital | Maintain | Outperform | 2025-12-05 |
| TD Cowen | Maintain | Buy | 2025-12-05 |
| Morgan Stanley | Maintain | Equal Weight | 2025-12-05 |
| BMO Capital | Maintain | Outperform | 2025-11-20 |
| Wells Fargo | Maintain | Overweight | 2025-09-19 |
| Stifel | Maintain | Buy | 2025-09-19 |
| Piper Sandler | Maintain | Overweight | 2025-09-19 |
| Canaccord Genuity | Maintain | Buy | 2025-09-19 |
| Citigroup | Maintain | Neutral | 2025-09-09 |
ServiceTitan’s grades predominantly range from Buy to Outperform, with consistent Overweight ratings and no downgrades or Sell ratings noted.
Which company has the best grades?
ServiceTitan has received more consistent and favorable grades, mostly Buy and Outperform, compared to Bentley Systems which shows a wider spread including Neutral and Sell ratings. For investors, this suggests ServiceTitan may currently enjoy stronger analyst confidence, potentially reflecting more optimistic growth or risk profiles.
Strengths and Weaknesses
The table below compares key strengths and weaknesses of Bentley Systems, Incorporated (BSY) and ServiceTitan, Inc. (TTAN) based on recent financial performance and strategic positioning:
| Criterion | Bentley Systems, Incorporated (BSY) | ServiceTitan, Inc. (TTAN) |
|---|---|---|
| Diversification | High: multiple revenue streams including licenses, subscriptions, and services totaling over $1.3B in 2024 | Moderate: primarily platform and subscription revenues around $1.3B in 2025 |
| Profitability | Favorable net margin (17.35%) and ROE (22.55%), but ROIC declining and slightly unfavorable overall | Unfavorable net margin (-30.98%), ROE (-16.44%), and ROIC; value is being destroyed |
| Innovation | Strong product portfolio with recurring subscription growth and high fixed asset turnover | Innovation evident but profitability issues suggest challenges in monetization and cost control |
| Global presence | Established global presence with diversified enterprise licenses and subscription models | Growing but less diversified global footprint, focused on platform subscriptions |
| Market Share | Solid market share in engineering software with stable recurring revenues | Expanding market share in trades management, but financials indicate operational inefficiencies |
Key takeaways: Bentley Systems demonstrates solid diversification and profitability metrics but faces challenges with declining ROIC and high valuation multiples. ServiceTitan shows strong growth potential in platform revenue but struggles with consistent profitability and value creation. Both require cautious evaluation focusing on risk management before investment.
Risk Analysis
Below is a comparative risk table for Bentley Systems, Incorporated (BSY) and ServiceTitan, Inc. (TTAN) based on their latest 2024-2025 financial and operational data.
| Metric | Bentley Systems, Incorporated (BSY) | ServiceTitan, Inc. (TTAN) |
|---|---|---|
| Market Risk | Moderate (Beta 1.21, volatile tech sector) | Low to Moderate (Negative Beta -0.85 indicates limited correlation with market swings) |
| Debt Level | High (Debt-to-Equity 1.37, 42% debt to assets) | Low (Debt-to-Equity 0.11, 9% debt to assets) |
| Regulatory Risk | Moderate (Global infrastructure software exposure) | Moderate (Field services software, subject to data/privacy regulations) |
| Operational Risk | Moderate (Complex software ecosystem, 5,500 employees) | Moderate (Growing company with 3,000+ employees, integration challenges) |
| Environmental Risk | Low (Primarily software business) | Low (Software service provider) |
| Geopolitical Risk | Moderate (Global infrastructure markets exposure) | Low to Moderate (Primarily US-based operations) |
The most impactful risks are Bentley’s elevated debt and market volatility, which could affect financial stability under economic stress. ServiceTitan’s negative profitability and operational scaling challenges pose risks despite low debt. Both companies face regulatory and operational risks typical of software firms with global or broad market reach. Caution is advised, especially for investors sensitive to leverage and earnings volatility.
Which Stock to Choose?
Bentley Systems, Incorporated (BSY) shows favorable income growth with a 10.15% revenue increase in 2024 and strong profitability metrics, including a 17.35% net margin and 22.55% ROE. However, its financial ratios reveal mixed signals with notable unfavorable debt levels and liquidity ratios, while the overall rating is very favorable at B-. The company’s MOAT is slightly unfavorable due to declining ROIC and value shedding.
ServiceTitan, Inc. (TTAN) exhibits higher revenue growth of 25.64% in 2025 but suffers from negative profitability, with a -30.98% net margin and negative returns on equity and assets. Its financial ratios show a split between some favorable leverage and liquidity metrics, yet the overall rating is also very favorable at C-. TTAN’s MOAT is unfavorable, indicating value destruction despite stable profitability trends.
Investors focused on stable profitability and established financial strength might find BSY’s profile more appealing, given its favorable income statement and strong rating despite some leverage concerns. Conversely, those prioritizing growth potential could see TTAN’s higher revenue expansion as attractive, although its negative profitability and MOAT suggest higher risk. The choice could therefore depend on individual risk tolerance and investment strategy preferences.
Disclaimer: Investment carries a risk of loss of initial capital. The past performance is not a reliable indicator of future results. Be sure to understand risks before making an investment decision.
Go Further
I encourage you to read the complete analyses of Bentley Systems, Incorporated and ServiceTitan, Inc. to enhance your investment decisions: