In today’s fast-evolving tech landscape, Autodesk, Inc. and The Trade Desk, Inc. stand out as leaders in software innovation, though they serve distinct yet overlapping markets. Autodesk excels in 3D design and engineering software, while The Trade Desk pioneers cloud-based digital advertising solutions. This comparison explores their growth strategies and market potential, helping you decide which company offers the most compelling investment opportunity in 2026.

Table of contents
Companies Overview
I will begin the comparison between Autodesk and The Trade Desk by providing an overview of these two companies and their main differences.
Autodesk Overview
Autodesk, Inc. specializes in 3D design, engineering, and entertainment software and services globally. Its portfolio includes AutoCAD, BIM 360, Fusion 360, and Maya, targeting professionals in architecture, engineering, construction, manufacturing, and media industries. Founded in 1982 and headquartered in San Rafael, California, Autodesk operates with 15,300 employees and holds a market cap of $56.6B, positioning it as a major player in application software.
The Trade Desk Overview
The Trade Desk, Inc. offers a cloud-based platform for managing data-driven digital advertising campaigns across multiple formats and channels, including display, video, and connected TV. It serves advertising agencies and related service providers. Established in 2009 and based in Ventura, California, The Trade Desk employs 3,522 people and has a market cap of $17.3B, focusing on technology for advertising optimization and data services.
Key similarities and differences
Both Autodesk and The Trade Desk operate in the technology sector under the software application industry, delivering cloud-based solutions. Autodesk primarily targets design and engineering professionals with 3D and CAD software, while The Trade Desk focuses on digital advertising campaign management. Autodesk is significantly larger by market capitalization and workforce, reflecting its broader industry reach compared to The Trade Desk’s specialized advertising technology niche.
Income Statement Comparison
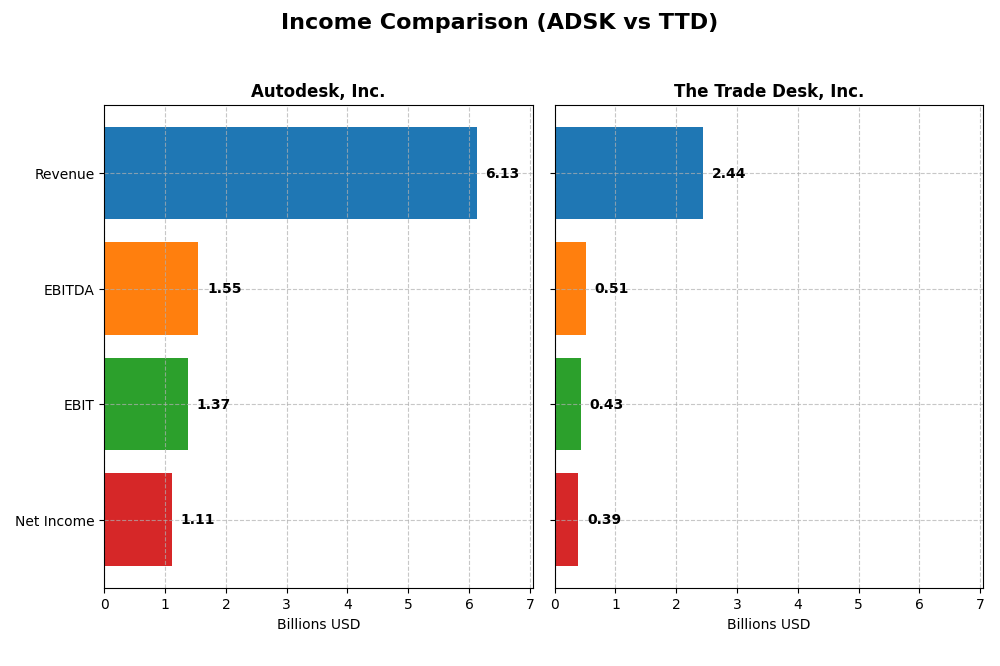
Below is a comparison of key income statement metrics for Autodesk, Inc. and The Trade Desk, Inc. based on their most recent fiscal year data.
| Metric | Autodesk, Inc. (ADSK) | The Trade Desk, Inc. (TTD) |
|---|---|---|
| Market Cap | 56.6B | 17.3B |
| Revenue | 6.13B | 2.44B |
| EBITDA | 1.55B | 515M |
| EBIT | 1.37B | 427M |
| Net Income | 1.11B | 393M |
| EPS | 5.17 | 0.80 |
| Fiscal Year | 2025 | 2024 |
Income Statement Interpretations
Autodesk, Inc.
Autodesk’s revenue steadily grew from $3.79B in 2021 to $6.13B in 2025, reflecting a 61.74% increase over five years. Net income rose until 2021 but then declined, reaching $1.11B in 2025. Margins remain strong, with a gross margin of 90.57% and an EBIT margin of 22.33%. In 2025, revenue growth accelerated by 12.7%, while net margin improved 8.9%.
The Trade Desk, Inc.
The Trade Desk saw impressive revenue growth from $837M in 2020 to $2.44B in 2024, a 192.43% increase overall. Net income increased substantially from $242M to $393M, with a favorable net margin of 16.08%. The latest year showed strong momentum, with a 25.63% revenue increase and a remarkable 74.86% improvement in net margin. EBIT margin stands at 17.47%.
Which one has the stronger fundamentals?
Both companies display favorable income statement evaluations, yet The Trade Desk exhibits more robust revenue and net income growth over recent years, including a stronger surge in EPS and net margin growth in 2024. Autodesk, while showing solid margins and growth, faces some net income and margin declines over the longer term. The Trade Desk’s fundamentals appear more dynamic, whereas Autodesk benefits from higher margins.
Financial Ratios Comparison
Below is a comparison of key financial ratios for Autodesk, Inc. (ADSK) and The Trade Desk, Inc. (TTD) based on their most recent fiscal year data.
| Ratios | Autodesk, Inc. (ADSK) FY 2025 | The Trade Desk, Inc. (TTD) FY 2024 |
|---|---|---|
| ROE | 42.4% | 13.3% |
| ROIC | 18.0% | 10.0% |
| P/E | 60.2 | 146.8 |
| P/B | 25.5 | 19.6 |
| Current Ratio | 0.68 | 1.86 |
| Quick Ratio | 0.68 | 1.86 |
| D/E (Debt-to-Equity) | 0.98 | 0.11 |
| Debt-to-Assets | 23.6% | 5.1% |
| Interest Coverage | 0 | 0 |
| Asset Turnover | 0.57 | 0.40 |
| Fixed Asset Turnover | 21.4 | 5.2 |
| Payout Ratio | 0 | 0 |
| Dividend Yield | 0% | 0% |
Interpretation of the Ratios
Autodesk, Inc.
Autodesk exhibits strong profitability ratios with a net margin of 18.14% and a robust ROE of 42.43%, indicating efficient use of equity. However, concerns arise from its high P/E of 60.2, low current ratio at 0.68, and elevated price-to-book ratio of 25.54. The company does not pay dividends, likely prioritizing reinvestment and growth, with no share buybacks reported.
The Trade Desk, Inc.
The Trade Desk shows favorable liquidity with a current ratio of 1.86 and low debt levels, reflected in a debt-to-assets ratio of 5.11%. Profitability ratios are decent, including a net margin of 16.08% and ROIC of 10.02%, though ROE is moderate at 13.33%. The company does not pay dividends, focusing on reinvestment and growth, supported by strong free cash flow.
Which one has the best ratios?
The Trade Desk holds a more favorable overall ratio profile, with 57.14% favorable ratios compared to Autodesk’s 42.86%. Autodesk’s high valuation multiples and weak liquidity metrics weigh against it, despite stronger profitability. The Trade Desk balances solid liquidity, moderate leverage, and sound profitability, suggesting a relatively healthier financial position.
Strategic Positioning
This section compares the strategic positioning of Autodesk, Inc. and The Trade Desk, Inc., including market position, key segments, and exposure to technological disruption:
Autodesk, Inc.
- Large market cap of 56.6B in software; faces competitive pressure in design and engineering software markets.
- Diverse segments: architecture, engineering, construction, manufacturing, media and entertainment software.
- Operates in established software industries with ongoing innovation in cloud-based design and collaboration tools.
The Trade Desk, Inc.
- Mid-size market cap of 17.3B in digital ad tech; competes in data-driven advertising platforms globally.
- Focused on self-service cloud platform for programmatic digital advertising across multiple media formats.
- High exposure to rapid digital advertising technology changes and evolving data privacy regulations.
Autodesk, Inc. vs The Trade Desk, Inc. Positioning
Autodesk pursues a diversified strategy across multiple professional software segments, offering stability but also complexity. The Trade Desk focuses on a concentrated niche in digital advertising technology, which may offer growth but also more volatility given market dynamics.
Which has the best competitive advantage?
Based on MOAT evaluation, Autodesk demonstrates a very favorable competitive advantage with growing ROIC above WACC, indicating durable value creation. The Trade Desk shows a slightly unfavorable position with declining ROIC, suggesting challenges in sustaining profitability.
Stock Comparison
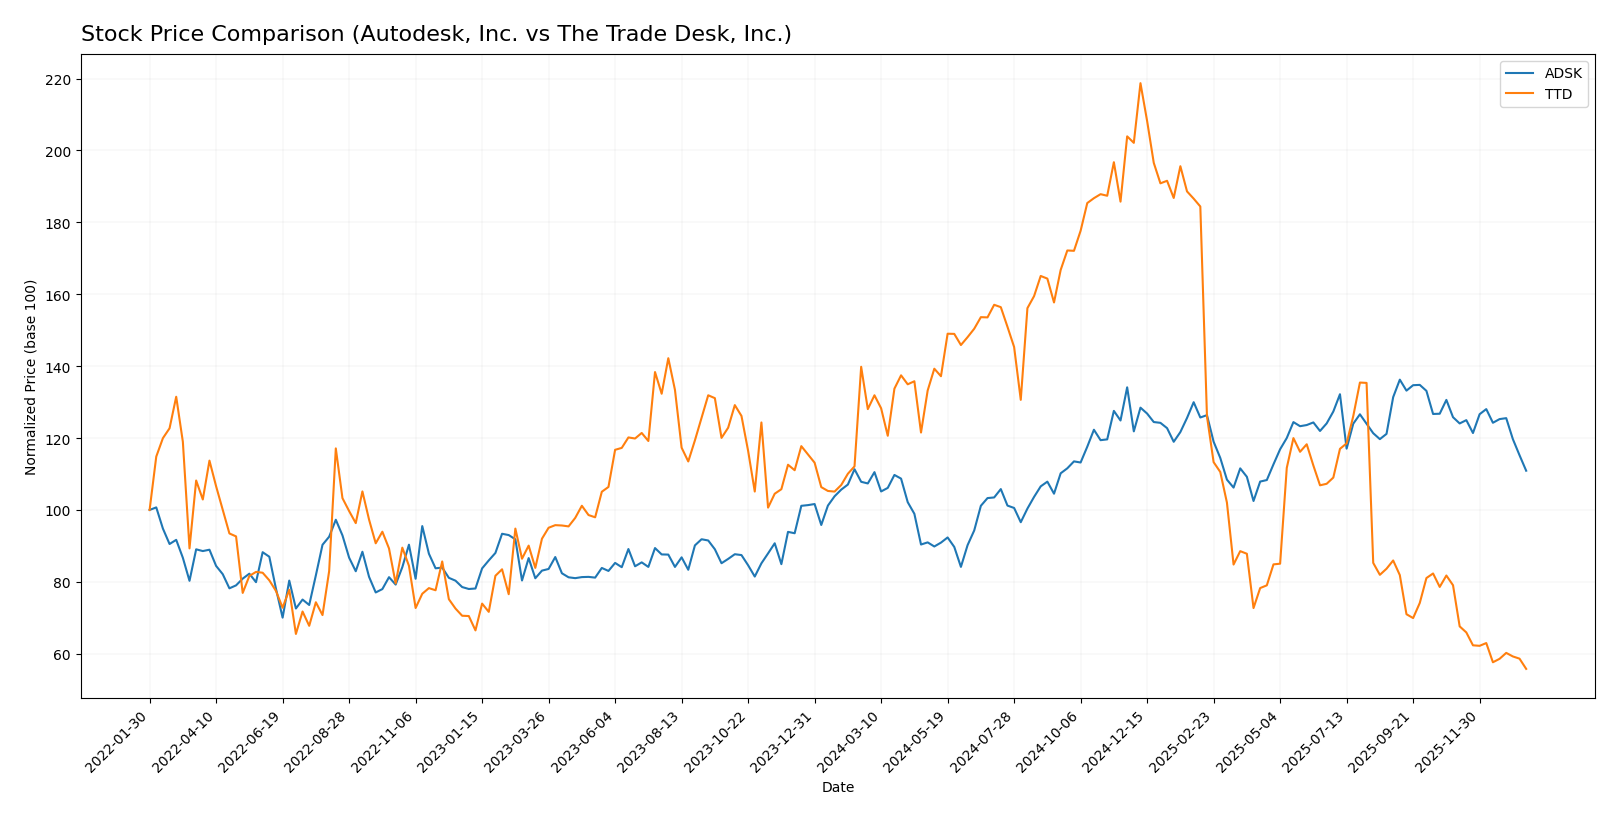
The stock price movements of Autodesk, Inc. and The Trade Desk, Inc. over the past year reveal contrasting trading dynamics, with Autodesk showing modest gains amid decelerating momentum, while The Trade Desk experienced significant declines and persistent bearish pressure.
Trend Analysis
Autodesk, Inc. recorded a 3.3% price increase over the past 12 months, indicating a bullish trend with a deceleration in momentum. The stock fluctuated between $201.6 and $326.37, showing high volatility (std deviation 29.87).
The Trade Desk, Inc. exhibited a sharp 56.43% decline over the same period, confirming a bearish trend with decelerating losses. Its price ranged from $35.48 to $139.11, with notable volatility (std deviation 28.36).
Comparing both, Autodesk delivered the highest market performance with positive returns, while The Trade Desk lagged significantly, suffering steep value erosion over the past year.
Target Prices
Analysts present a diverse range of target prices, reflecting varied expectations for Autodesk, Inc. and The Trade Desk, Inc.
| Company | Target High | Target Low | Consensus |
|---|---|---|---|
| Autodesk, Inc. | 400 | 343 | 373 |
| The Trade Desk, Inc. | 98 | 39 | 56.73 |
For Autodesk, the consensus target price of 373 is significantly above the current price of 265.69, indicating bullish analyst sentiment. The Trade Desk’s consensus target of 56.73 also suggests upside potential from its current 35.48 price, though with a wider range reflecting higher uncertainty.
Analyst Opinions Comparison
This section compares analysts’ ratings and grades for Autodesk, Inc. and The Trade Desk, Inc.:
Rating Comparison
Autodesk, Inc. Rating
- Rating: B- indicating a very favorable overall status.
- Discounted Cash Flow Score: Moderate at 3.
- ROE Score: Very favorable at 5, showing strong profit generation from equity.
- ROA Score: Favorable at 4, reflecting effective asset use.
- Debt To Equity Score: Very unfavorable at 1, signaling high financial risk.
- Overall Score: Moderate at 3, summarizing the financial standing.
The Trade Desk, Inc. Rating
- Rating: B indicating a very favorable overall status.
- Discounted Cash Flow Score: Favorable at 4.
- ROE Score: Favorable at 4, indicating efficient profit use.
- ROA Score: Favorable at 4, reflecting effective asset use.
- Debt To Equity Score: Moderate at 3, showing balanced leverage.
- Overall Score: Moderate at 3, summarizing the financial standing.
Which one is the best rated?
Based strictly on the data, The Trade Desk, Inc. holds a slightly better rating with a higher discounted cash flow and debt-to-equity score, indicating a more favorable valuation and balanced financial risk compared to Autodesk, Inc.
Scores Comparison
Here is a comparison of the financial scores for Autodesk, Inc. and The Trade Desk, Inc.:
ADSK Scores
- Altman Z-Score: 5.05, indicating a safe zone status
- Piotroski Score: 8, reflecting very strong financial health
TTD Scores
- Altman Z-Score: 4.30, indicating a safe zone status
- Piotroski Score: 5, reflecting average financial health
Which company has the best scores?
Autodesk shows stronger financial health overall, with a higher Altman Z-Score and a very strong Piotroski Score compared to The Trade Desk’s safe zone Altman Z-Score and average Piotroski Score.
Grades Comparison
Here is a comparison of the latest reliable grades given to Autodesk, Inc. and The Trade Desk, Inc.:
Autodesk, Inc. Grades
The table below summarizes recent grades from leading financial institutions for Autodesk, Inc.:
| Grading Company | Action | New Grade | Date |
|---|---|---|---|
| Barclays | Maintain | Overweight | 2025-11-26 |
| Wells Fargo | Maintain | Overweight | 2025-11-26 |
| Deutsche Bank | Upgrade | Buy | 2025-11-26 |
| B of A Securities | Maintain | Neutral | 2025-11-26 |
| Rosenblatt | Maintain | Buy | 2025-11-26 |
| Macquarie | Maintain | Outperform | 2025-11-26 |
| BMO Capital | Maintain | Market Perform | 2025-11-26 |
| Baird | Maintain | Outperform | 2025-11-26 |
| Rosenblatt | Maintain | Buy | 2025-11-24 |
| Baird | Maintain | Outperform | 2025-11-18 |
Grades for Autodesk, Inc. generally reflect a positive outlook, with multiple firms rating it as Buy, Outperform, or Overweight, indicating sustained confidence.
The Trade Desk, Inc. Grades
Below is a summary of recent grades from credible financial institutions for The Trade Desk, Inc.:
| Grading Company | Action | New Grade | Date |
|---|---|---|---|
| Morgan Stanley | Maintain | Equal Weight | 2026-01-13 |
| Wells Fargo | Maintain | Equal Weight | 2026-01-12 |
| Cantor Fitzgerald | Maintain | Neutral | 2026-01-08 |
| Wolfe Research | Maintain | Outperform | 2026-01-06 |
| Guggenheim | Maintain | Buy | 2026-01-05 |
| Jefferies | Maintain | Hold | 2025-12-11 |
| Wedbush | Maintain | Neutral | 2025-12-08 |
| DA Davidson | Maintain | Buy | 2025-11-10 |
| Truist Securities | Maintain | Buy | 2025-11-07 |
| Wells Fargo | Maintain | Equal Weight | 2025-11-07 |
The Trade Desk, Inc. shows a mixed consensus with a balance of Buy, Outperform, Neutral, and Equal Weight ratings, suggesting cautious optimism among analysts.
Which company has the best grades?
Autodesk, Inc. has received a stronger consensus, with more Buy and Outperform ratings compared to The Trade Desk, Inc., which has a higher proportion of Neutral and Equal Weight grades. This difference may influence investors’ perception of growth potential and risk.
Strengths and Weaknesses
Below is a comparison table highlighting key strengths and weaknesses of Autodesk, Inc. (ADSK) and The Trade Desk, Inc. (TTD) based on their recent financial and operational data.
| Criterion | Autodesk, Inc. (ADSK) | The Trade Desk, Inc. (TTD) |
|---|---|---|
| Diversification | Strong diversification across Architecture, Manufacturing, Media, and Software segments, reducing risk exposure. | Primarily focused on digital advertising technology; less diversified product portfolio. |
| Profitability | High profitability with 18.14% net margin and 42.43% ROE; consistently creates value (ROIC > WACC by 7.59%). | Moderate profitability with 16.08% net margin, 13.33% ROE; currently shedding value (ROIC slightly above WACC by 1.09%). |
| Innovation | Sustained innovation reflected in growing ROIC trend (+15.4%), strong presence in CAD and engineering software. | Innovation challenged by declining ROIC (-8.5%) and increasing competition in ad tech sector. |
| Global presence | Broad global footprint in multiple industries including architecture and manufacturing. | Global reach in digital advertising, but market penetration can be volatile. |
| Market Share | Leading market share in CAD and construction software markets, supported by diverse segments. | Significant player in programmatic advertising but faces intense competition and high valuation multiples. |
Key takeaways: Autodesk shows a robust and diversified business model with strong profitability and a durable competitive advantage. The Trade Desk, while a leader in ad tech, faces profitability pressures and less diversification, warranting cautious risk management.
Risk Analysis
Below is a table summarizing key risks for Autodesk, Inc. (ADSK) and The Trade Desk, Inc. (TTD) based on the most recent data from 2025 and 2024 respectively:
| Metric | Autodesk, Inc. (ADSK) | The Trade Desk, Inc. (TTD) |
|---|---|---|
| Market Risk | High beta (1.466) indicating above-average volatility | Moderate beta (1.105), moderate volatility |
| Debt Level | Debt-to-equity ~0.98 (neutral), debt-to-assets 23.62% (favorable) | Low debt-to-equity 0.11, debt-to-assets 5.11% (favorable) |
| Regulatory Risk | Moderate, as a global software provider subject to tech regulations | Moderate, digital advertising regulations evolving globally |
| Operational Risk | Large employee base (15.3K) increases complexity | Smaller team (3.5K), but platform reliance critical |
| Environmental Risk | Moderate, with focus on software development, low direct impact | Low direct environmental impact, mostly digital operations |
| Geopolitical Risk | Exposure through international sales and supply chains | Exposure via global ad markets and data privacy laws |
The most impactful risks are market volatility for Autodesk due to its higher beta and potential regulatory shifts affecting both companies amid evolving tech and advertising rules. Autodesk’s moderate leverage requires monitoring, while The Trade Desk benefits from a stronger balance sheet but faces high valuation risk.
Which Stock to Choose?
Autodesk, Inc. (ADSK) has shown favorable income growth with a 12.7% revenue increase in 2025 and strong profitability metrics, including an 18.14% net margin and 42.43% ROE. Its debt level is moderate with a net debt to EBITDA ratio of 0.62, and the company holds a very favorable overall rating of B-.
The Trade Desk, Inc. (TTD) reported robust income growth, with a 25.63% revenue increase in 2024 and solid profitability, showing a 16.08% net margin and 13.33% ROE. It maintains low debt with a net debt to EBITDA of -2.05 and a very favorable overall rating of B.
Considering ratings and financials, ADSK’s very favorable moat with a growing ROIC suggests durable competitive advantage, whereas TTD’s slightly unfavorable moat reflects declining profitability. Investors seeking growth might find TTD appealing given its income momentum, while those prioritizing quality and value creation may view ADSK more favorably.
Disclaimer: Investment carries a risk of loss of initial capital. The past performance is not a reliable indicator of future results. Be sure to understand risks before making an investment decision.
Go Further
I encourage you to read the complete analyses of Autodesk, Inc. and The Trade Desk, Inc. to enhance your investment decisions: