In the dynamic software application industry, Autodesk, Inc. and ServiceTitan, Inc. stand out for their innovative solutions tailored to professionals and businesses. Autodesk leads in 3D design and engineering software, while ServiceTitan specializes in field service management technology. Their shared focus on transforming traditional workflows through digital tools makes them compelling candidates for comparison. Join me as we explore which company presents the most attractive investment opportunity in 2026.
Table of contents
Companies Overview
I will begin the comparison between Autodesk and ServiceTitan by providing an overview of these two companies and their main differences.
Autodesk Overview
Autodesk, Inc. is a US-based technology company specializing in 3D design, engineering, and entertainment software and services. It offers a broad portfolio including AutoCAD, BIM 360, and Fusion 360, targeting professionals in architecture, engineering, construction, product design, and media. With a market cap of 56.6B USD and 15,300 employees, Autodesk is a well-established player in the application software industry.
ServiceTitan Overview
ServiceTitan, Inc. is a technology firm focused on software solutions for managing field service activities related to residential and commercial infrastructure systems. Founded in 2008 and headquartered in Glendale, CA, ServiceTitan operates with a market cap of 8.5B USD and employs around 3,000 people. It primarily serves service contractors in sectors requiring installation and maintenance support.
Key similarities and differences
Both Autodesk and ServiceTitan operate in the application software industry within the technology sector, serving professional and commercial markets. Autodesk offers a diverse range of design and engineering applications with a global reach, while ServiceTitan concentrates on field service management software for specific infrastructure services. The companies differ significantly in scale, market capitalization, and employee count, reflecting their distinct market roles and business scopes.
Income Statement Comparison
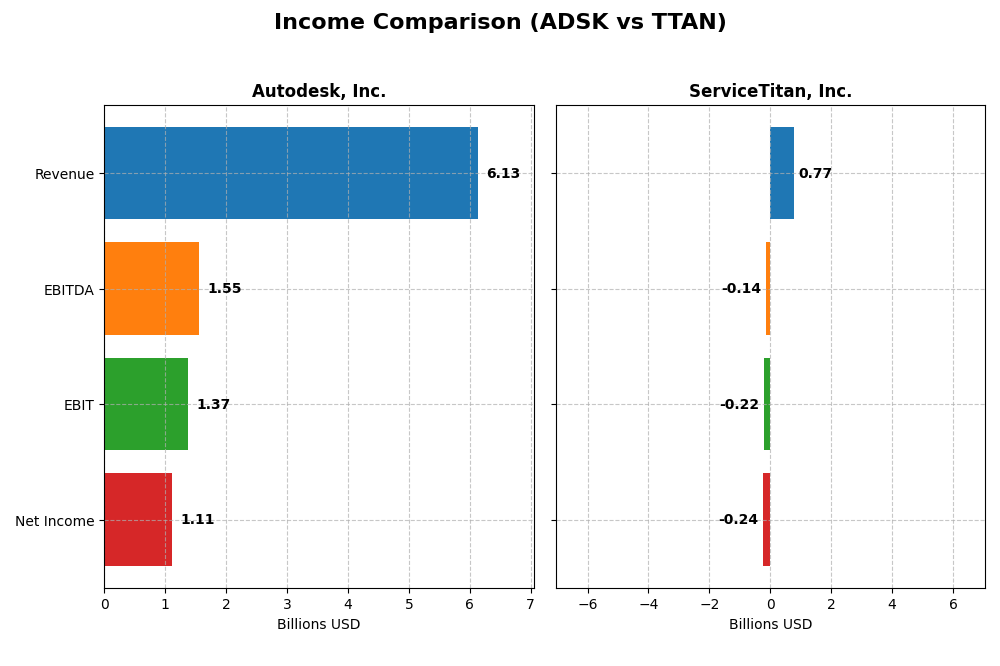
This table compares key income statement metrics for Autodesk, Inc. and ServiceTitan, Inc. based on their most recent fiscal year results.
| Metric | Autodesk, Inc. (ADSK) | ServiceTitan, Inc. (TTAN) |
|---|---|---|
| Market Cap | 56.6B | 8.5B |
| Revenue | 6.13B | 772M |
| EBITDA | 1.55B | -141M |
| EBIT | 1.37B | -221M |
| Net Income | 1.11B | -239M |
| EPS | 5.17 | -8.53 |
| Fiscal Year | 2025 | 2025 |
Income Statement Interpretations
Autodesk, Inc.
Autodesk’s revenue steadily increased from $3.79B in 2021 to $6.13B in 2025, reflecting a 61.7% growth over five years. Net income showed volatility, peaking at $1.21B in 2021 before declining to $1.11B in 2025. Margins remained strong, with a gross margin above 90% and net margin near 18% in 2025. The latest year saw 12.7% revenue growth and improved EBIT margin, signaling operational efficiency gains.
ServiceTitan, Inc.
ServiceTitan’s revenue grew from $468M in 2023 to $772M in 2025, a 65% increase over three years. Net income remained negative, though losses narrowed from -$283M in 2023 to -$239M in 2025. The company maintained a gross margin around 65%, but EBIT and net margins were negative, with EBIT margin at -28.7%. Despite revenue acceleration, operating expenses grew faster, pressuring profitability further in 2025.
Which one has the stronger fundamentals?
Autodesk demonstrates stronger fundamentals with consistent revenue growth, positive and improving net income, and high profitability margins. Its efficient cost management and zero interest expense contribute favorably. ServiceTitan shows robust top-line expansion but persistent losses and negative margins reflect ongoing challenges in achieving profitability. Autodesk’s overall income statement metrics and margin stability position it as the financially stronger company.
Financial Ratios Comparison
The table below compares key financial ratios for Autodesk, Inc. (ADSK) and ServiceTitan, Inc. (TTAN) based on their most recent fiscal year data from 2025.
| Ratios | Autodesk, Inc. (ADSK) | ServiceTitan, Inc. (TTAN) |
|---|---|---|
| ROE | 42.4% | -16.4% |
| ROIC | 18.0% | -14.1% |
| P/E | 60.2 | -18.1 |
| P/B | 25.5 | 3.0 |
| Current Ratio | 0.68 | 3.74 |
| Quick Ratio | 0.68 | 3.74 |
| D/E (Debt-to-Equity) | 0.98 | 0.11 |
| Debt-to-Assets | 23.6% | 9.4% |
| Interest Coverage | 0 | -14.8 |
| Asset Turnover | 0.57 | 0.44 |
| Fixed Asset Turnover | 21.4 | 9.6 |
| Payout Ratio | 0 | 0 |
| Dividend Yield | 0 | 0 |
Interpretation of the Ratios
Autodesk, Inc.
Autodesk shows strong profitability ratios with a net margin of 18.14%, ROE at 42.43%, and ROIC at 18.01%, indicating efficient capital use. However, valuation metrics like PE at 60.2 and PB at 25.54 are high, and liquidity ratios are weak with a current ratio of 0.68. Autodesk does not pay dividends, reflecting a reinvestment strategy focused on growth and innovation.
ServiceTitan, Inc.
ServiceTitan reports unfavorable profitability ratios, including a negative net margin of -30.98%, ROE of -16.44%, and ROIC of -14.11%, signaling operational challenges. Liquidity is strong with a current ratio of 3.74 and a low debt-to-equity ratio of 0.11. The company pays no dividends, consistent with its negative earnings and emphasis on growth and R&D investments.
Which one has the best ratios?
Autodesk presents a more favorable financial profile with solid profitability and capital efficiency despite weak liquidity and high valuation. ServiceTitan faces significant profitability struggles but maintains strong liquidity and low leverage. Overall, Autodesk’s ratios are more balanced, while ServiceTitan’s indicate higher risk and operational difficulties.
Strategic Positioning
This section compares the strategic positioning of Autodesk, Inc. and ServiceTitan, Inc., including market position, key segments, and exposure to technological disruption:
Autodesk, Inc.
- Leading software provider in application sector with strong competitive pressure
- Diversified segments: Architecture, Manufacturing, Media, and AutoCAD software
- Exposure through cloud-based construction and design tools in innovative software
ServiceTitan, Inc.
- Smaller market cap with less competitive pressure in field service software
- Focused on platform and subscription revenue in field service management
- Limited explicit exposure to technological disruption indicated
Autodesk, Inc. vs ServiceTitan, Inc. Positioning
Autodesk’s diversified approach spans multiple industries, driving revenue across construction, manufacturing, and media, while ServiceTitan concentrates on field service software. Autodesk’s broad portfolio offers varied growth drivers; ServiceTitan’s focus may limit diversification benefits.
Which has the best competitive advantage?
Autodesk demonstrates a very favorable moat with growing ROIC above WACC, indicating durable competitive advantage and value creation. ServiceTitan shows unfavorable moat status with negative ROIC versus WACC, implying value destruction despite stable profitability.
Stock Comparison
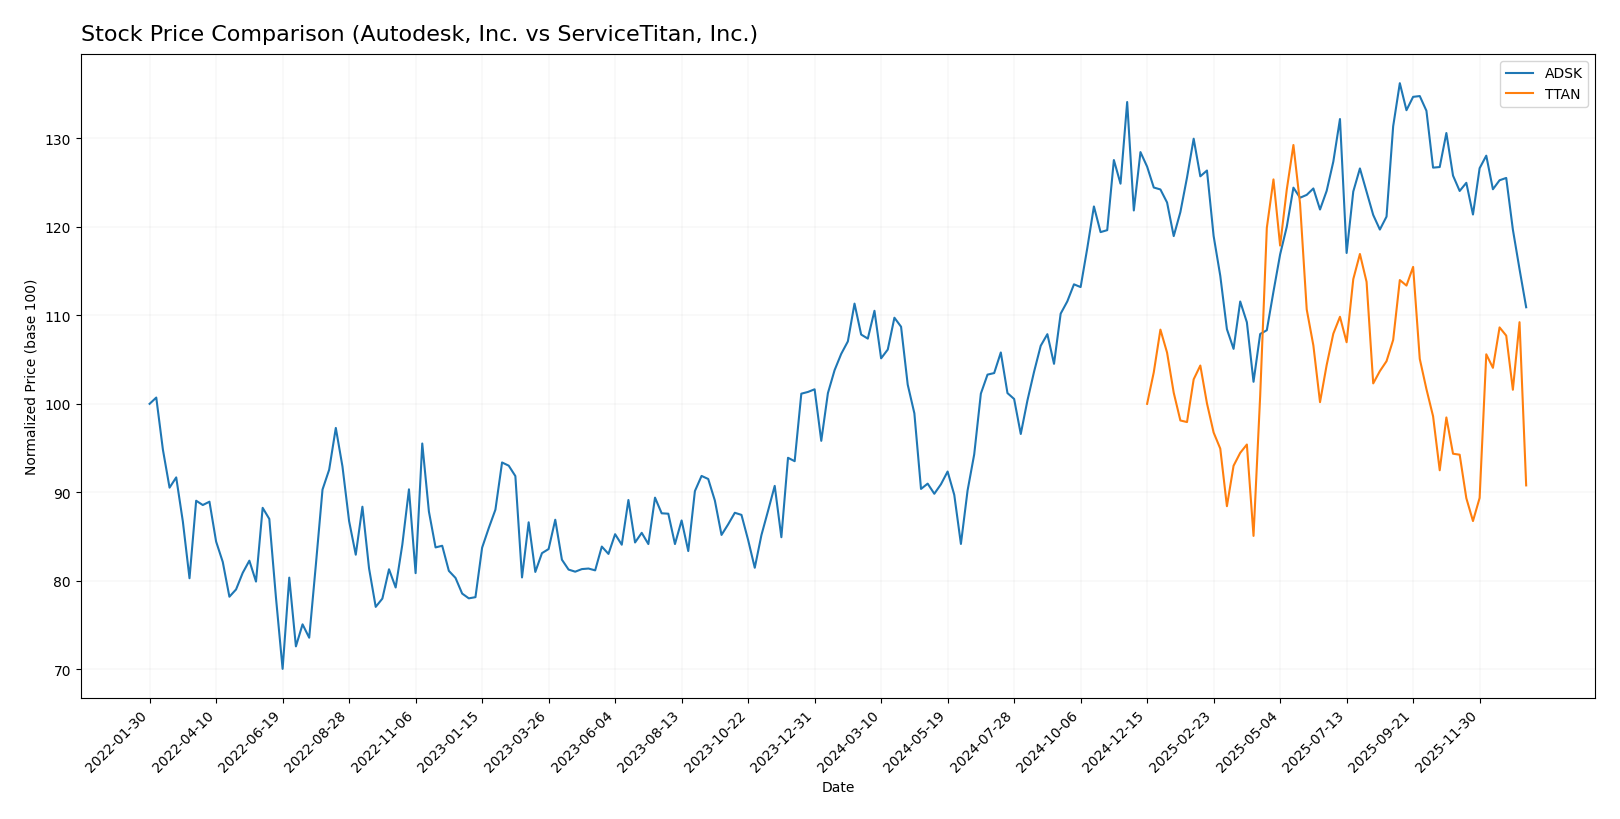
The stock price movements of Autodesk, Inc. (ADSK) and ServiceTitan, Inc. (TTAN) over the past 12 months reveal contrasting trends, with ADSK showing moderate gains amid decelerating momentum, while TTAN experiences a clear downward trajectory with accelerating losses.
Trend Analysis
Autodesk, Inc. (ADSK) displays a bullish trend over the past year with a 3.3% price increase, though momentum is decelerating. The stock’s price ranged from a low of 201.6 to a high of 326.37, with notable recent weakness marked by an 11.83% decline.
ServiceTitan, Inc. (TTAN) shows a bearish trend over the last 12 months, falling 9.22%, with accelerating downward movement. The stock fluctuated between 85.07 and 129.26, and despite a recent slight upward slope, it remains overall negative.
Comparing both, ADSK delivered the highest market performance over the past year, achieving positive returns versus TTAN’s significant decline.
Target Prices
Analysts present a positive target price consensus for both Autodesk, Inc. and ServiceTitan, Inc.
| Company | Target High | Target Low | Consensus |
|---|---|---|---|
| Autodesk, Inc. | 400 | 343 | 373 |
| ServiceTitan, Inc. | 145 | 117 | 132.44 |
The target consensus for Autodesk at 373 USD suggests a significant upside from the current price of 265.69 USD. Similarly, ServiceTitan’s consensus target of 132.44 USD indicates strong growth potential above its current price of 90.78 USD.
Analyst Opinions Comparison
This section compares analysts’ ratings and grades for Autodesk, Inc. and ServiceTitan, Inc.:
Rating Comparison
Autodesk, Inc. Rating
- Rating: B-, indicating a very favorable overall evaluation.
- Discounted Cash Flow Score: Moderate at 3, showing balanced valuation.
- ROE Score: Very favorable at 5, highlighting efficient profit generation.
- ROA Score: Favorable at 4, reflecting effective asset utilization.
- Debt To Equity Score: Very unfavorable at 1, indicating high financial risk.
- Overall Score: Moderate at 3, summarizing a mixed but stable profile.
ServiceTitan, Inc. Rating
- Rating: C-, also noted as very favorable despite lower scores.
- Discounted Cash Flow Score: Very unfavorable at 1, suggesting overvaluation.
- ROE Score: Very unfavorable at 1, indicating less efficient equity use.
- ROA Score: Very unfavorable at 1, showing poor asset efficiency.
- Debt To Equity Score: Moderate at 3, denoting balanced financial leverage.
- Overall Score: Very unfavorable at 1, reflecting weak overall financial standing.
Which one is the best rated?
Autodesk, Inc. is better rated overall with a B- rating and stronger scores in ROE and ROA, despite a weak debt-to-equity score. ServiceTitan, Inc. holds a C- rating with generally very unfavorable financial scores except for moderate debt levels.
Scores Comparison
Here is a comparison of the Altman Z-Score and Piotroski Score for Autodesk, Inc. and ServiceTitan, Inc.:
Autodesk, Inc. Scores
- Altman Z-Score: 5.05, indicating a safe zone, low bankruptcy risk.
- Piotroski Score: 8, classified as very strong financial health.
ServiceTitan, Inc. Scores
- Altman Z-Score: 15.74, indicating a safe zone, very low bankruptcy risk.
- Piotroski Score: 6, classified as average financial health.
Which company has the best scores?
ServiceTitan has a higher Altman Z-Score, indicating lower bankruptcy risk, but Autodesk has a stronger Piotroski Score, suggesting better overall financial strength.
Grades Comparison
Here is the comparison of the latest grades and ratings for Autodesk, Inc. and ServiceTitan, Inc.:
Autodesk, Inc. Grades
This table shows recent analyst grades and actions for Autodesk, Inc.:
| Grading Company | Action | New Grade | Date |
|---|---|---|---|
| Barclays | Maintain | Overweight | 2025-11-26 |
| Wells Fargo | Maintain | Overweight | 2025-11-26 |
| Deutsche Bank | Upgrade | Buy | 2025-11-26 |
| B of A Securities | Maintain | Neutral | 2025-11-26 |
| Rosenblatt | Maintain | Buy | 2025-11-26 |
| Macquarie | Maintain | Outperform | 2025-11-26 |
| BMO Capital | Maintain | Market Perform | 2025-11-26 |
| Baird | Maintain | Outperform | 2025-11-26 |
| Rosenblatt | Maintain | Buy | 2025-11-24 |
| Baird | Maintain | Outperform | 2025-11-18 |
Autodesk’s grades are predominantly positive, with multiple buy and outperform ratings and only a few neutral or market perform opinions.
ServiceTitan, Inc. Grades
This table presents the recent analyst grades and actions for ServiceTitan, Inc.:
| Grading Company | Action | New Grade | Date |
|---|---|---|---|
| Piper Sandler | Maintain | Overweight | 2025-12-05 |
| BMO Capital | Maintain | Outperform | 2025-12-05 |
| TD Cowen | Maintain | Buy | 2025-12-05 |
| Morgan Stanley | Maintain | Equal Weight | 2025-12-05 |
| BMO Capital | Maintain | Outperform | 2025-11-20 |
| Wells Fargo | Maintain | Overweight | 2025-09-19 |
| Stifel | Maintain | Buy | 2025-09-19 |
| Piper Sandler | Maintain | Overweight | 2025-09-19 |
| Canaccord Genuity | Maintain | Buy | 2025-09-19 |
| Citigroup | Maintain | Neutral | 2025-09-09 |
ServiceTitan’s grades are similarly positive, featuring numerous buy, outperform, and overweight ratings, with few neutral or equal weight opinions.
Which company has the best grades?
Both Autodesk, Inc. and ServiceTitan, Inc. have strong buy-side analyst support, but Autodesk shows a slightly larger number of buy and outperform grades from major institutions. This may indicate stronger analyst conviction, potentially impacting investor confidence and portfolio weighting decisions.
Strengths and Weaknesses
The table below presents a comparative analysis of key strengths and weaknesses for Autodesk, Inc. (ADSK) and ServiceTitan, Inc. (TTAN) based on their financial performance, market position, and innovation metrics as of 2026.
| Criterion | Autodesk, Inc. (ADSK) | ServiceTitan, Inc. (TTAN) |
|---|---|---|
| Diversification | Highly diversified across Architecture, Manufacturing, AutoCAD, and Media segments with $7.9B total revenue in 2025 | Less diversified; primarily platform and subscription revenue totaling about $1.3B in 2025 |
| Profitability | Strong profitability: ROIC 18%, Net Margin 18.14%, ROE 42.43% | Negative profitability: ROIC -14.11%, Net Margin -30.98%, ROE -16.44% |
| Innovation | Consistent investment leading to growing ROIC (+15.4% trend), strong market position in design software | Innovation present but not yet profitable; neutral ROIC trend (+1.7%) |
| Global presence | Established global footprint with diverse client base in multiple industries | Primarily North American market focus, smaller scale global reach |
| Market Share | Leading market share in CAD and engineering software sectors | Emerging player in service management software with limited market penetration |
Key takeaways: Autodesk demonstrates a robust competitive moat with diversified revenue streams, strong profitability, and sustained innovation, indicating a durable investment. ServiceTitan shows potential but currently suffers from negative profitability and limited diversification, suggesting higher risk for investors.
Risk Analysis
Below is a comparative table outlining key risks for Autodesk, Inc. (ADSK) and ServiceTitan, Inc. (TTAN) based on the most recent data from 2025.
| Metric | Autodesk, Inc. (ADSK) | ServiceTitan, Inc. (TTAN) |
|---|---|---|
| Market Risk | Beta 1.47 indicates moderate volatility, exposed to tech sector swings. | Beta -0.85 suggests inverse or low correlation with market trends, unusual but may reduce systematic risk. |
| Debt Level | Debt-to-assets 23.6%, debt-to-equity neutral at 0.98, moderate leverage. | Low debt-to-assets 9.35%, low debt-to-equity 0.11, low financial risk from leverage. |
| Regulatory Risk | Moderate, consistent with US software industry regulations, no major issues reported. | Similar regulatory exposure in US tech, IPO in 2024 means evolving compliance environment. |
| Operational Risk | Large employee base (15,300) and diversified software products mitigate risk but complexity is higher. | Smaller size (3,049 employees), newer company with growing pains and scaling risks. |
| Environmental Risk | Moderate, software industry has low direct environmental impact but increasing cloud energy use scrutiny. | Similar low direct impact but potential scrutiny on operational sustainability as company grows. |
| Geopolitical Risk | US-based, moderate exposure to global supply chain and trade policies affecting software exports. | Mainly US-focused, but growth ambitions could increase exposure to geopolitical uncertainties. |
The most likely and impactful risks for Autodesk are market volatility and operational complexity given its scale and beta above 1. For ServiceTitan, the primary concerns are operational risks from rapid growth and financial instability indicated by negative profitability and weak interest coverage. Autodesk’s safe Altman Z-score (5.05) contrasts with ServiceTitan’s much higher score (15.74), both in a safe zone, but ServiceTitan’s negative margins and lower Piotroski score suggest caution.
Which Stock to Choose?
Autodesk, Inc. (ADSK) shows favorable income evolution with 12.7% revenue growth in 2025 and strong profitability metrics, including an 18.14% net margin and 42.43% ROE. Its debt level is moderate with a net debt to EBITDA of 0.62 and a current ratio below 1. The company holds a very favorable rating of B- and demonstrates a very favorable economic moat driven by a growing ROIC exceeding its WACC.
ServiceTitan, Inc. (TTAN) presents mixed financials with 25.64% revenue growth but negative net margin of -30.98% and losses reflected in negative ROE and ROIC. It maintains low debt levels and a strong current ratio of 3.74. Despite a very favorable rating of C-, the company’s overall financial ratios are slightly unfavorable, and its economic moat is rated unfavorable due to value destruction.
For investors prioritizing stable profitability and durable competitive advantages, Autodesk may appear more favorable given its strong income statement and very favorable moat. Conversely, risk-tolerant or growth-focused investors might interpret ServiceTitan’s rapid revenue growth and strong liquidity as potential for future improvement despite current losses.
Disclaimer: Investment carries a risk of loss of initial capital. The past performance is not a reliable indicator of future results. Be sure to understand risks before making an investment decision.
Go Further
I encourage you to read the complete analyses of Autodesk, Inc. and ServiceTitan, Inc. to enhance your investment decisions: